Integration of GIS for Mapping Distributed Online Learning - IOPscience
←
→
Page content transcription
If your browser does not render page correctly, please read the page content below

IOP Conference Series: Materials Science and Engineering

PAPER • OPEN ACCESS

Integration of GIS for Mapping Distributed Online Learning
To cite this article: Jenny Ohliati et al 2021 IOP Conf. Ser.: Mater. Sci. Eng. 1088 012023

View the article online for updates and enhancements.

                                This content was downloaded from IP address 46.4.80.155 on 23/04/2021 at 04:33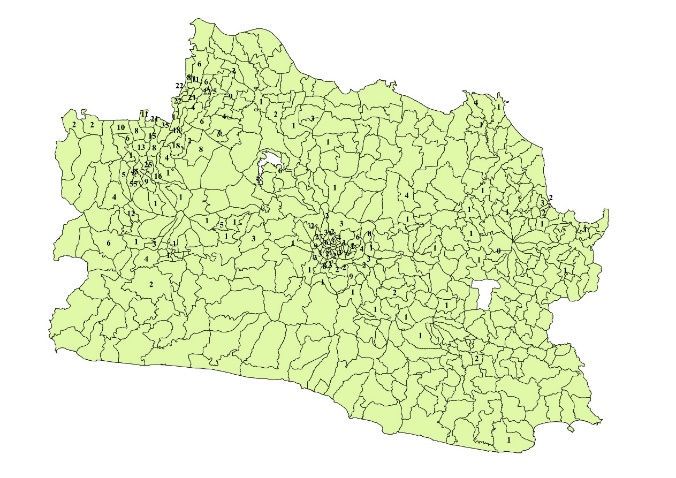
Annual Conference on Computer Science and Engineering Technology (AC2SET) 2020                                           IOP Publishing
IOP Conf. Series: Materials Science and Engineering              1088 (2021) 012023           doi:10.1088/1757-899X/1088/1/012023

Integration of GIS for Mapping Distributed Online Learning

                     Jenny Ohliati, Arief Agus Sukmandhani, Emny Harna Yossy
                     Computer Science Department, School of Computer Science, Bina Nusantara
                     University, Indonesia

                     *jenny.ohliati@binus.ac.id

                     Abstract. This study was carried out to overcome one of the main obstacles encountered, namely
                     the lack of information on the location of student residences in private universities that provide
                     online learning system. Quantum GIS can display the distribution of students in all regions of
                     Indonesia. The method used in this study is the descriptive analysis method. The results of this
                     study are presented in the form of a distribution map of online learning students across Indonesia,
                     which shows information about student data based on a regional boundary map.

1. Introduction
In early 2020, the world was shocked by the outbreak of a new virus, namely Corona Virus Disease
2019 (COVID-19). To prevent the spread of COVID-19 in the educational environment, the Minister of
Education and Culture of the Republic of Indonesia issued Notice No.4 of 2020 concerning the
implementation of Education Policies in an Emergency Period for the Spread of Corona Virus Disease
(COVID-19). One of the policies is written that the teaching and learning process is carried out from
home through distance learning. Referring to this Notice, the teaching and learning process of all
educational institutions has switched from face-to-face system to distance learning, includes primary to
higher education.
    The distance learning method utilized the internet and electronic media or e-learning. E-learning
itself is a learning process using information and communications technology media[1]. One university
that implements an e-learning system in Indonesia is a private university in Jakarta. Therefore, during
the Covid-19 pandemic, this private university was ready to implement the Notice letter from the
Ministry of Education.
    Currently, the students at private universities that provide online learning have been geographically
spread in various cities in Indonesia. The distance learning implemented by the ministry offers private
universities that offer online learning education the opportunity to help high school graduate students to
continue their education even during the Covid-19 pandemic. Therefore, it is necessary to map the
current students geographically. Geographic data mapping uses a basic information system, i.e., a
geographic information system (GIS). GIS aims to store, manage, analyze, organize, and visualize all
types of geographic data[2]. Geographic information systems have been used in the search for dynamic
management systems to extract land use maps, risk and resource maps for geography and disaster
simulation [3][4][5]. According to Dewa (2020)[6], GIS can be used to aid learning activities related to
space. The purpose of this research is to determine the distribution of students across Indonesia as an
institution's data enrichment system.

              Content from this work may be used under the terms of the Creative Commons Attribution 3.0 licence. Any further distribution
              of this work must maintain attribution to the author(s) and the title of the work, journal citation and DOI.
Published under licence by IOP Publishing Ltd                          1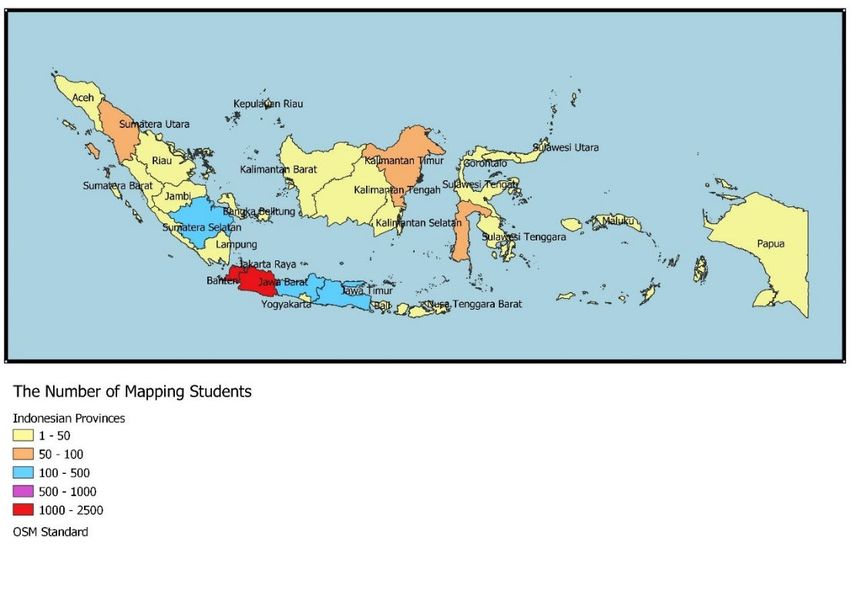
Annual Conference on Computer Science and Engineering Technology (AC2SET) 2020                   IOP Publishing
IOP Conf. Series: Materials Science and Engineering   1088 (2021) 012023    doi:10.1088/1757-899X/1088/1/012023

2. Methodology
The design used in this research is to first conduct exploratory research to describe and understand the
research problem, and then the results of the exploratory research will become the input of the
descriptive research. Descriptive analysis methodology is a GIS research method used for mapping
online learning students. The data used is secondary data.

3. Result and Discussion
While mapping the students, the steps in this study can be seen in the image of the fishbone flowchart
below:

                                  Figure 1. Research procedure stage diagram

At the planning stage, it begins with preparing student’s data and the QGIS application. Vector data for
Indonesian maps in the form of .shp files are uploaded to the QGIS application. Student data is managed
in excel and then input into the QGIS application. The maps and student data have been uploaded and
inputted; the mapping process is carried out using the QGIS application. The output of mapping using
the QGIS application is a map of the distribution of online learning students.

3.1. Digitizing student distribution map throughout Indonesia
After taking some steps to collect data, input the data into the GIS and management system, then
generate output in the form of a digital student map. GIS digital mapping is a classic approach that builds
a spatial image by combining a layer of digital information and to develop algorithms to be tested and
visualized in special selection [2]. The digital map-drawing process using the Quantum GIS (QGIS)
application. Quantum GIS is an open-source software that can be used for spatial data management and
application development for GIS[7]. The spatial data structure used to create the geographic GIS data is
used for the mapping of students in Indonesia using a vector data model. The vector data model is stored
as coordinates of points, these points use dashed lines or areas to display their positions and store spatial
data[8]. The implementation of the digital map in the geographic conditions of Indonesia is shown in
Figure 2:

                                                         2
Annual Conference on Computer Science and Engineering Technology (AC2SET) 2020 IOP Publishing
IOP Conf. Series: Materials Science and Engineering 1088 (2021) 012023 doi:10.1088/1757-899X/1088/1/012023
Figure 2. Result digitized distribution map of students throughout Indonesia
The result of digitized distribution student mapping throughout Indonesia show that many students
domiciles are in Banten Province, DKI Jakarta Province, and West Java Province. The number of
students in these three provinces is above 1000 students on average. At these three provinces, a mapping
was carried out again into cities and sub-districts to be more specific about which cities and sub-districts
where the most student domiciles are. The results of digitizing the distribution of students in the
provinces of Banten, DKI Jakarta, and West Java are as follows:
a. Banten Province
The results of the student distribution map in the city of Banten province are mainly concentrated
in the city of South Tangerang with a total of 573 students and the City of Tangerang with a total
of 516 students. Afterward, Banten province is remapping into sub-district, and the Serpong sub-
district had the most student residences with a total of 225 students.
Figure 3. Result digitized distribution map of students in Banten Cities (left) and Sub-district(right)
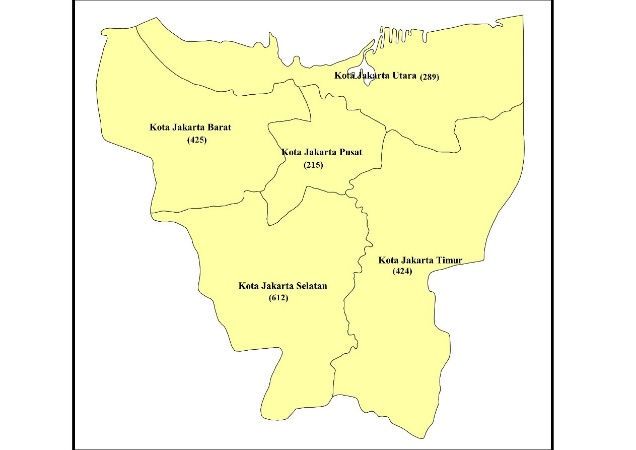
b. DKI Jakarta Province
The results based on the student distribution map based on students in DKI Jakarta province are
mainly located in South Jakarta with a total of 612 students. Meanwhile, West Jakarta with a
total of 425 students, East Jakarta with a total of 424 students, North Jakarta with a total of 289
3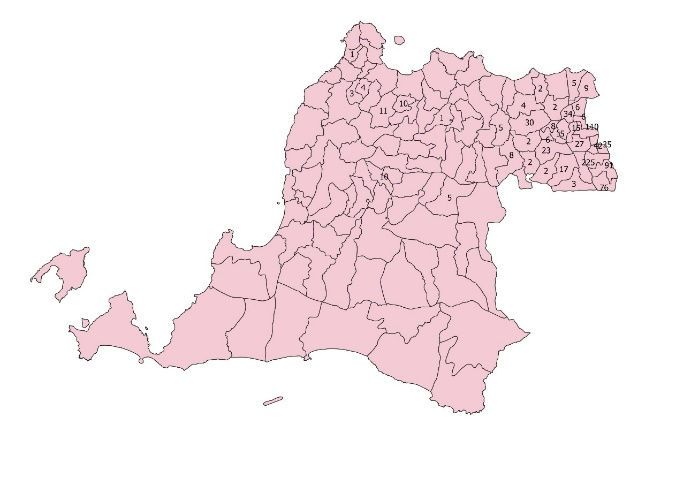
Annual Conference on Computer Science and Engineering Technology (AC2SET) 2020                   IOP Publishing
IOP Conf. Series: Materials Science and Engineering   1088 (2021) 012023    doi:10.1088/1757-899X/1088/1/012023

        students, and Central Jakarta with a total of 215 students. The results of digitizing the distribution
        map of students in the province of DKI Jakarta based on the districts were mostly in Tebet sub-
        district with a total of 138 students, followed by Tanjung Priok sub-district with a total of 122
        students and Duren Sawit sub-district with a total of 102 students.

Figure 4. Result digitized distribution map of students in DKI Jakarta Cities (left) and Sub-district(right)

    c. West Java Province
       According to the map of the distribution of students in various cities of West Java, many students
       live in Bogor City with a total of 282 students, Depok City with a total of 146 students, and
       Bandung City with a total of 146 students. Then, the distribution of students by area in West Java
       is mainly concentrated in Ciomas sub-district with a total of 55 students and West Bogor with a
       total of 45 students.

Figure 5. Result digitized distribution map of students in West Java Cities (left) and Sub-district(right)

4. Conclusion
Based on the results of the completed study, it can be concluded that this research is able to produce a
geographic information system for mapping online learning students, which contains information on the
number of students in each city and sub-district. This student map can help institutions show the
distribution of Indonesian students.

References
[1]   A. K. M. N. Islam, “Investigating e-learning system usage outcomes in the university context,”
      Comput. Educ., vol. 69, pp. 387–399, 2013.
[2]   D. Kurniasih and A. Setiyadi, “Geographic Information System for Mapping New Entrepreneurs
      in West Java,” IOP Conf. Ser. Mater. Sci. Eng., vol. 662, no. 2, 2019.

                                                         4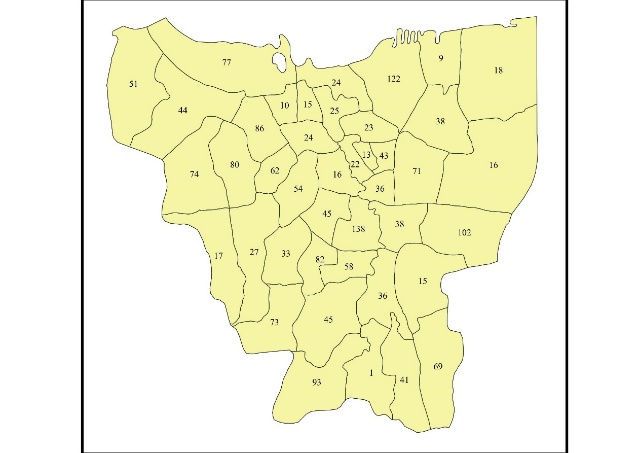
Annual Conference on Computer Science and Engineering Technology (AC2SET) 2020                   IOP Publishing
IOP Conf. Series: Materials Science and Engineering   1088 (2021) 012023    doi:10.1088/1757-899X/1088/1/012023

[3]     M. Hashemi and A. A. Alesheikh, “GIS: Agent-based modeling and evaluation of an earthquake-
        stricken area with a case study in Tehran, Iran,” Nat. Hazards, 2013.
[4]     Y. Q. Wang, “MeteoInfo: GIS software for meteorological data visualization and analysis,”
        Meteorol. Appl., 2014.
[5]     M. Leh, S. Bajwa, and I. Chaubey, “IMPACT of land use change on erosion risk: AN integrated
        remote sensing, geographic information system and modeling methodology,” L. Degrad. Dev.,
        2013.
[6]     P. Dewa, B. Mulyanti, and I. Widiaty, “Geographic information system in education,” IOP Conf.
        Ser. Mater. Sci. Eng., vol. 830, no. 4, 2020.
[7]     O. Sonnentag, “review - Open source gis a grass gis approach,” Comput. Geosci., vol. 35, no.
        11, p. 2282, 2009.
[8]     A. W. Nirwansyah, “Dasar Sistem Informasi Geografi dan Aplikasinya Menggunakan ARCGIS
        9.3,” Deepublish, 2017.
[9]     K. K. Pendidikan, “Mendikbud Terbitkan SE tentang Pelaksanaan Pendidikan dalam Masa
        Darurat Covid-19,” kemdikbud, 2020. .
[10]    “Indonesia: WHO Coronavirus Disease (COVID-19) Dashboard | WHO Coronavirus Disease
        (COVID-19) Dashboard.” [Online]. Available: https://covid19.who.int/region/searo/country/id.
        [Accessed: 25-Aug-2020].

                                                         5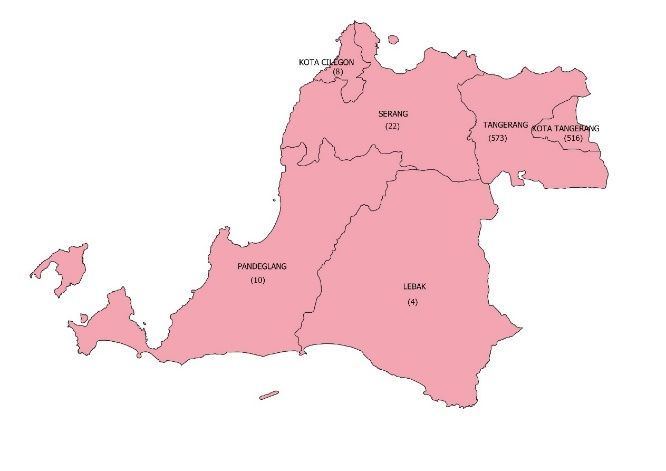
You can also read