Corporate Presentation 1H18 Results - PT Telkom Indonesia (Persero) Tbk July 2018 - Macquarie Group
←
→
Page content transcription
If your browser does not render page correctly, please read the page content below
Corporate Presentation
           1H18 Results
PT Telkom Indonesia (Persero) Tbk
                        July 2018
Disclaimer

This document may contain forward-looking statements within the meaning of safe-
harbor. Actual results could differ materially from projections, estimations or
expectations. These may involve risks and uncertainties, and may cause actual results
and development to differ substantially from those expressed or implied in the
statements. The company does not guarantee that any action, which may have been
taken in reliance of this document will bring specific results as expected.

                                                                                2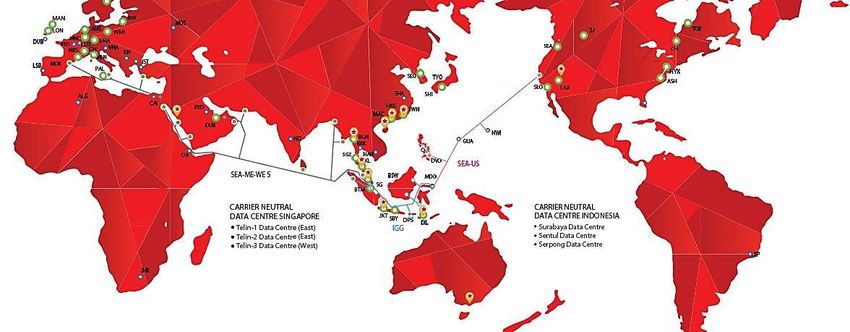
TELKOM in Brief

1H18 Financial & Operational Results

           Company Guidance 2018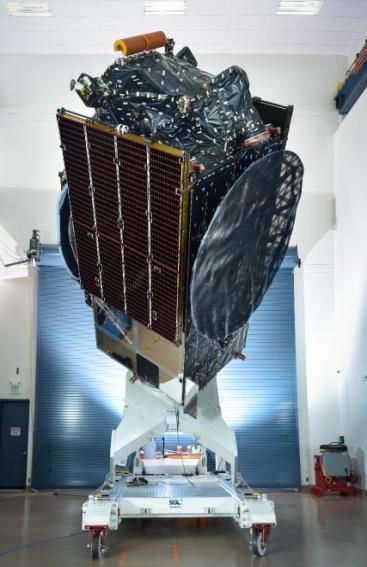
Board of Directors
               CEO TELKOM GROUP   Director       Director      Director
Telkom Group

               ALEX J. SINAGA     HARRY M. ZEN   HERDY R.      ABDUS SOMAD
                                                 HARMAN        ARIEF

               Director           Director       Director      Director
               DIAN               SITI           ZULHELFI      DAVID
               RACHMAWAN          CHOIRIANA      ABIDIN        BANGUN

               CEO Telkomsel      Director       Director      Director
Telkomsel

               RIRIEK             HERI           EDWARD YING   ALISTAIR D
               ADRIANSYAH         SUPRIADI       SIEW HENG     JOHNSTON

               Director           Director       Director       Director
               SUKARDI            MONTGOMERY     BOB            IRFAN TACHRIR
               SILALAHI           HONG           APRIAWAN
                                                               4
Share Ownership

Government                    52.1%                                    Public      47.9%
Total Shares                                                                           Telkom Indonesia is listed at
99,062,216,600 shares                                                                  Indonesia Stock Exchange (Bloomberg: TLKM IJ)
                                                                                       and New York Stock Exchange (TLK US)
 Market Capitalization
 Rp387.3 Tn (USD27.4 Bn)*
Telkom’s AGMS for the fiscal year of 2017 decided to withdraw the remaining
1,737,779,800 treasury shares by reduction of the Company’s issued and paid up
capital.
On July 2, 2018, the Company’s amended Articles of Association has obtained the
approval from the Ministry of Law and Human Rights of the Republic of Indonesia.

*as of July 30, 2018                                                                                                       5
TELKOM in Brief

1H18 Financial & Operational Results

           Company Guidance 2018
1H18 Performance Highlights

Telkom Indonesia recorded 0.5% growth YoY in revenue in the middle of tight
competition in telco industry.

Data, Internet & IT Services segment remained the growth driver and largest revenue
contributor, increasing by 20.7% YoY and representing 50.9% of total revenue.

Consolidated EBITDA was Rp28.3 trillion and Net Income Rp8.7 trillion.

Telkomsel remained focus on growing its digital business and providing excellent customer
experience, installing 14,978 new BTSs during 1H18, all of which were 4G BTS.

                                                                                            7
Data, Internet & IT Services as the Growth Driver
Revenue YoY (Rp Trillion)
64,0 64,4
32.7
27.1
26.0
20.4
0.5%
5.7
4.6
3.7 3.2 2.7 2.4
Data, Internet Cellular Voice Fixed Line Interconnection Network & Other
1H17 1H18
& IT Services and SMS Voice 11.3% Telco Services
20.7% 21.4% 14.7% 25.1%
8
Note: SMS included SMS Banking and SMS advertising 1H17 1H18
EBITDA and Net Income
33,2 12,1
EBITDA
28,3 YoY
(Rp Trillion)
8,7
14.7% Net Income
YoY
(Rp Trillion) 28.1%
Margin Margin
51.9% 44.0%
18.9% 13.5%
1H17 1H18 1H17 1H18
9
Expenses Grew Inline with Infrastructure Development
Expenses YoY (Rp Trillion) 46,3
21.9 40,2
18.4
15.0%
10.3
9.6
6.7 7.0
3.3
1.4 1.9 2.1 2.0 2.2
O&M Personnel Interconnection Marketing G&A D&A 1H17 1H18
18.9% 4.8% 31.6% 4.5% 49.5% 7.3%
10
1H17 1H18Telkomsel Performance
YEAR ON YEAR
REVENUES EBITDA NET INCOME CAPEX
In Trillion In Trillion In Trillion In Trillion
-7.1% -18.2% -24.4% +13.9%
46.0 42.7 27.2 7.4
22.2 15.5
Digital 11.7
Business
18.1 +17.5%
21.2
6.5
Legacy 27.9 -23.0%
1H17 1H18
21.5 1H17 1H18
Margin Margin
1H17 1H18 1H17 1H18
59% 52% 34% 27%
TOTAL ASSET CUSTOMER BTS ON AIR
In Trillion In Million In Thousand
+4.9% -0.1% +19.9%
84.9 175.7
178.0
146.6
80.9 -1% 177.9
1H17 1H18 1H17 1H18 1H17 1H18 11
4Telkomsel Performance
YEAR ON YEAR DIGITAL BUSINESS
DIGITAL BUSINESS DATA USER DATA TRAFFIC
REVENUE
In Trillion In Million In PB
+17.5% +32.5% +134.8%
21.2 1,898.1
18.1 134.7
101.7
+13.0%
18.4 808.4
Broadband 16.3
Digital +59.1%
Services 1.8 2.8
1H17 1H18 1H17 1H18 1H17 1H18
3G/4G CAPABLE DEVICE 3G & 4G BTS ON AIR
In Million In Thousand
+24.6% +30.3%
125.4
112.1 96.2
89.9 43.1 +141.9%
4G 17.8
3G 78.4 82.2 +4.9%
12
1H17 1H18 1H17 1H18Excellent Operational Results
Telkomsel TELKOM
Operational Operational
◼ 3G/4G-capable device users: 112.1 Mn (+24.6% ◼ Consumer segment revenue grew 20.8% to
YoY). 57.6Mn has enjoyed 4G Rp6.4Tn. IndiHome revenue grew 46.8% YoY to
Rp5.3Tn
◼ Mobile data payload jumped 134.8% YoY to
1,944 PB ◼ Improved IndiHome margin to around 25%
inline with the bigger economic of scale,
◼ Added 14,978 new BTSs (all were 4G). Total BTS
improvement in sales and technician
175.7K (125.4K 3G/4G)
productivity, product diversification, as well as
◼ 4G LTE Service: 490 municipal cities across better network quality and IT system
Indonesia, 43K BTS
◼ IndiHome subs added by 1.1 Mn during 1H18,
◼ Telkomsel has started to raise data price reaching 4.1 Mn, an increase of 105.3% YoY
nationwide by around 4-11% (four to eleven
percent) in early July.
13Enterprise Business
Trend for Indonesian corporations to focus TELKOM
on their core businesses and outsource Enterprise Business
their ICT solution needs to reliable third-
party providers 12.3 trillion
Revenues (Rp) 19.5%
Corporate Government SME
Demand Indonesia government IT- 3.7 million identified SMEs in
◼ smart enablers related spending is around our database and very low
◼ data center and cloud Rp15 trillion annually, ICT adoption rate among
◼ platforms and application
Indonesia SMEs
◼ business process outsourcing
1,453 62%
to rev.
994 24%
to rev.
300,416 14%
to rev.
corporate clients institutions SME Clients
14
14Wholesale & International Business
Domestic and international traffic carrier, wholesale
connectivity, towers, satellite, as well as telecommunication 4.3 trillion
and infrastructure managed services Revenues (Rp) 21.7%
Merah Putih
Satellite
◼ The coverage
area of
Merah Putih
includes
Indonesia,
South East
Asia and
South Asia
◼ Planned to be
launched on
the 7th of
August from
IGG SEA-US Cape
SEA-ME-WE-5 15,000 km from Manado, Canaveral,
Indonesia Global Gateway
20,000 km from Dumai, Indonesia - California, Florida
Connect SEA-ME-WE 5, SEA-US and our
Indonesia - Marseille, France
domestic network has reached USA
has started to operate Commenced
96% progress and is expected
in January 2017 operation by
to commence operation in
September 2018 August 8, 2017 15Cost Leadership
To respond to the slowdown top line growth, we have embarked on cost leadership program in
many aspects.
O&M Marketing Personnel
◼ Manageable O&M per BTS at ◼ Expense went down by ◼ Modest increase of 4.8% YoY to Rp7.0 Tn
Telkomsel 4.5% YoY (despite increased compensation).
◼ Due to the new dealership ◼ Massive retirement and the much smaller
incentive in Telkomsel. number of new recruits that we have been
doing since 2015.
◼ From 2018 until 2022, natural retirement
in Telkom will reach around 7,200
employees.
16TELKOM in Brief
1H18 Financial & Operational Results
Company Guidance 20182018 Guidance
Revenue Growth EBITDA & CAPEX
Net Income Margins
We expect Telkomsel to grow Expected to decline in line with Around 25% of revenue with
inline or slightly above cellular revenue shift towards digital more capex for fixed broadband
industry. business and continued business
Overall Telkom Group is infrastructure development
expected to grow around mid
to high single digit supported
by healthy growth in fixed-line
businesses
MAIN PROGRAM
Delivering Best Expanding Intensifying
Customer Experience Digital Business Smart Inorganic
Delighting Customer Defend and Expand Optimizing Smart Inorganic
Journey by Delivering Digital Connectivity and to Strengthen Digital
Superior Digital Experience Boosting Digital Services Capabilities and Enhance
and Solutions Enterprise Value 18Thank You
PT Telkom Indonesia (Persero) Tbk
July, 2018You can also read