Investor Presentation - Q1 2019 Activity - GTT
←
→
Page content transcription
If your browser does not render page correctly, please read the page content below

Investor Presentation

      Q1 2019 Activity

           16 April 2019
Disclaimer

      This document contains information resulting from testing,
      experience and know-how of GTT, which are protected under the
      legal regime of undisclosed information and trade secret (notably
      TRIPS Art. 39) and under Copyright law. This document is strictly
      confidential and the exclusive property of GTT. It cannot be copied,
      used, modified, adapted, disseminated, published or communicated,
      in whole or in part, by any means, for any purpose, without express
      prior written authorization of GTT. Any violation of this clause may
      give rise to civil or criminal liability - © GTT 2010 - 2019

                                                                             2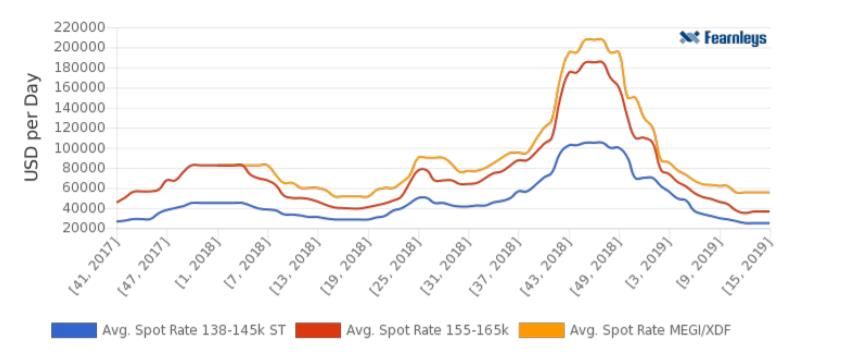
Disclaimer

This presentation does not contain or constitute an offer of securities for sale or an invitation or inducement to invest in securities in France, the
United States or any other jurisdiction.
It includes only summary information and does not purport to be comprehensive. No representation, warranty or undertaking, express or
implied, is made as to, and no reliance should be placed on, the accuracy, completeness or correctness of the information or opinions contained
in this presentation. None of GTT or any of its affiliates, directors, officers and employees shall bear any liability (in negligence or otherwise) for
any loss arising from any use of this presentation or its contents.
The market data and certain industry forecasts included in this presentation were obtained from internal surveys, estimates, reports and studies,
where appropriate, as well as external market research, including Poten & Partners, Wood Mackenzie and Clarkson Research Services Limited,
publicly available information and industry publications. GTT, its affiliates, shareholders, directors, officers, advisors and employees have not
independently verified the accuracy of any such market data and industry forecasts and make no representations or warranties in relation
thereto. Such data and forecasts are included herein for information purposes only. Where referenced, as regards the information and data
contained in this presentation provided by Clarksons Research and taken from Clarksons Research’s database and other sources, Clarksons
Research has advised that: (i) some information in the databases is derived from estimates or subjective judgments; (ii) the information in the
databases of other maritime data collection agencies may differ from the information in Clarksons Research database; (iii) while Clarksons
Research has taken reasonable care in the compilation of the statistical and graphical information and believes it to be accurate and correct,
data compilation is subject to limited audit and validation procedures.
Any forward-looking statements contained herein are based on current GTT’s expectations, beliefs, objectives, assumptions and projections
regarding present and future business strategies and the distribution environment in which GTT operates, and any other matters that are not
historical fact. Forward-looking statements are not guarantees of future performances and are subject to various risks, uncertainties and other
factors, many of which are difficult to predict and generally beyond the control of GTT and its shareholders. Actual results, performance or
achievements, or industry results or other events, could materially differ from those expressed in, or implied or projected by, these forward-
looking statements. For a detailed description of these risks and uncertainties, please refer to the section “Risk Factors” of the Document de
Référence (“Registration Document”) registered by GTT with the Autorité des Marchés Financiers (“AMF”) on April 25, 2018 and the half-yearly
financial report released on July 26, 2018, which are available on the AMF’s website at www.amf-france.org and on GTT’s website at www.gtt.fr.
The forward-looking statements contained in this presentation are made as at the date of this presentation, unless another time is specified in
relation to them. GTT disclaims any intent or obligation to update any forward-looking statements contained in this presentation.

                                                                                                                                                          3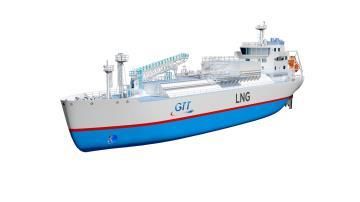
Key Highlights
Q1 2019 Consolidated Revenues: €58.9 million

Strong level of new orders: 14 LNGC + 1 bunker ship in Q1

                                                                 CORE BUSINESS

              Order book: 101 units                                        Q1 2019 movements in the order book
 88 LNGC*                              2 FLNG                            New orders: 14 LNGC
 8 FSRU                                3 Onshore storage                 Deliveries: 10 (9 LNGC, 1 FSRU)

                                                           NEW BUSINESS (LNG FUEL)

                  Order book: 12 units                                    Q1 2019 New orders
 9 ULCS                                      2 Bunker ships                1 Bunker ship
 1 Cruise ship

April 2019: new commercial success in LNG Fuel business with an additional order to equip a
container ship converted to LNG

                                                                                 Notes: LNGC – Liquefied Natural Gas Carrier, VLEC – Very Large Ethane Carrier,
                                                                                 FSRU – Floating Storage and Regasification Unit, RV – Regasification Vessel,
          * Taking into account one order cancelled in Q4 2018                   FLNG – Floating Liquefied Natural Gas ,ULCS – Ultra Large Container Ships        4
LNG strong demand outlook
2035 LNG demand outlook
700
600
500
400
Mtpa
300
200
100 Q1 2019 for Shell, BP
Q4 18 forecast for WM
Q2 18 for IHS
0
2015 2020 2025 2030 2035
LNG demand expected to double between 2018 and 2035
Growth mainly coming from Asia
Continuous growth expected
5LNG short term charter rates are stabilising
Spot Charter rates have stabilised since the beginning of 2019 at around $60k/d
Short term outlook remain positive, as 1 year charter rate stabilising at around $90k/d
6Liquefaction projects: more FIDs expected
FID at Golden Pass (15.6 Mtpa) in February 2019
36.5 Mtpa FIDed in one year to date
More FIDs expected in 2019-20
Mozambique LNG Area 1:
9.5 Mtpa contracted out of 12 Mtpa
Anadarko to be taken over by Chevron
Arctic LNG2: 14 booked slots at Zvezda for future ship orders
Qatar LNG expansion: engineering contracts signed for North Pars expansion
Note: FID – Final Investment Decision / Main source: Wood Mackenzie
7LNG Fuel focus: entry into a new market segment
March 2019
1 bunker ship
12,000 cbm capacity
Mark III Flex technology
Owned by MOL, built by
Sembcorp Marine
April 2019
1 very-large container ship converted
to LNG
6,500 cbm capacity
Mark III technology
Owned by Hapag Lloyd,
converted by Hudong-Zhonghua
8First quarter 2019 consolidated revenues
Summary financials Key highlights
in € M Q1 2018 Q1 2019 Change Total revenues: €58.9 million (-8.2%)
(%)
Revenues 64.2 58.9 -8.2%
Revenues from newbuilds:
Newbuilds 61.5 55.4 -10.0%
€55.4 million (-10.0%)
% of revenues 96% 94%
Q1 2019 royalties from LNGCs and
LNGC/VLEC 54.6 46.2 -15.3% FSRUs did not fully benefit from the flow
% of revenues 85% 78% of orders in 2018, whilst Q1 2018 was
FSRU 6.2 5.2 -16.2% essentially based on orders prior to 2016
% of revenues 10% 9%
royalties from
• FLNGs: €1.3 million (+153.3%)
FLNG 0.5 1.3 +153.3%
• LNG as fuel: €1.6 million (i.e. 3% of total
% of revenues 1% 2% revenues)
Onshore storage - 0.9 nm
% of revenues - 2%
Revenues from services:
Barge 0.2 0.2 -22.9%
€3.6 million (+34.7%)
% of revenues - -
notably due to the rise of maintenance
LNG Fuel - 1.6 nm services and, to a lesser extent, the
% of revenues - 3% contribution of Ascenz
Services 2.6 3.6 34.7%
% of revenues 4% 6%2019 Outlook confirmed
GTT revenue(1) 2019 consolidated revenue estimated in a range of €255 M to €270 M
EBITDA 2019 consolidated EBITDA estimated in a range of €150 M to €160 M
Dividend
2019 and 2020 payout of at least 80%
Payment(2)
(1) In the absence of any significant delays or cancellations in orders. Variations in order intake between periods could lead to fluctuations in revenues
(2) Subject to approval of Shareholders' meeting. GTT by-laws provide that dividends may be paid in cash or in shares based on each shareholder’s preference
10Contact: information-financiere@gtt.fr / +33 1 30 23 20 87
You can also read