European power prices - Challenges and opportunities for wind Andreas Gandolfo November 28, 2018 - R-Meetings
←
→
Page content transcription
If your browser does not render page correctly, please read the page content below

European power
prices
Challenges and opportunities for wind

Andreas Gandolfo

November 28, 2018

Introduction
What is BloombergNEF

1   Eneco, R-meeting, November 28, 2018
2 Eneco, R-meeting, November 28, 2018
Power prices in
Europe
The challenge for wind

3   Eneco, R-meeting, November 28, 2018
Ten years of stable power prices
Real 2007 power prices in select European markets, indexed to 2007
100 = 2007, real 2007

    250

                                                                             Above the red line                  United Kingdom
                                                                             real prices are up

    200
                                                                                                                 Nordpool

                                                                                                                 Spain
    150

                                                                                                                 Netherlands

    100
                                                                                                                 France

     50                                                                                                          Germany

                                                                             Below the red line
                                                                            real prices are down                 Italy
      0
       2007        2008      2009      2010     2011   2012   2013   2014        2015      2016    2017   2018

Source: Bloomberg Terminal, Bloomberg NEF.

4         Eneco, R-meeting, November 28, 2018
Why are power prices stable
Wind and solar as a share of total EU 28
Commodity prices in Europe, indexed to 2007
capacity and generation
100 = 2007
180 30%
160
25% Capacity
140
Gas
120 20%
100
15%
80
Generation
60 10%
Coal
40
5%
20
0 0%
2007 2008 2009 2010 2011 2012 2013 2014 2015 2016 2017 2018 2007 2008 2009 2010 2011 2012 2013 2014 2015 2016 2017
Source: Bloomberg Terminal, BloombergNEF. Note: TTF hub prices used for gas Source: BloombergNEF. Note: EU 28 is the 28 countries of the European Union
5 Eneco, R-meeting, November 28, 2018European power prices unlikely to
rise
U.K. power price outlook Germany power price outlook
GBP/MWh, real 2010 EUR/MWh, real 2010
60 60
Outlook Outlook
50 50
40 40
30 30
20 20
10 10
0 0
2010 2015 2020 2025 2030 2035 2040 2010 2015 2020 2025 2030 2035 2040
Source: Bloomberg NEF Source: Bloomberg NEF
6 Eneco, R-meeting, November 28, 2018What is keeping European power
prices from rising
Wind and solar as a share of total European
Coal and gas price outlooks indexed to 2010 capacity and generation
100 = 2010
200 80%
Outlook
180 Gas
70%
Outlook
160
60%
140
50%
120
100 40%
80
Coal 30%
Capacity
60
20%
40 Generation
10%
20
0 0%
2010 2015 2020 2025 2030 2035 2040 2010 2015 2020 2025 2030 2035 2040
Source: BloombergNEF Source: BloombergNEF
7 Eneco, R-meeting, November 28, 2018How much wind and solar do we
expect in Europe
Cumulative installed generating capacity Generation by technology
GW TWh
2,500 4,000
3,500
2,000
3,000
2,500
1,500
2,000
1,000
1,500
1,000
500
500
0 0
2015 2020 2025 2030 2035 2040 2015 2020 2025 2030 2035 2040
Flexible capacity Solar Wind Other Hydro Nuclear Fossil fuel Solar Wind Other Hydro Nuclear Fossil fuel
Source: BloombergNEF. Note: Other includes biomass, and geothermal Source: BloombergNEF. Note: Other includes biomass, and geothermal
8 Eneco, R-meeting, November 28, 2018Why do wind and solar depress
prices
What does it cost different technologies to generate a megawatt-hour of electricity
currency per megawatt-hour
60
50
40
30
20 Subsidy
Variable O&M
10 Emissions
Fuel
0
-10
-20
-30
Coal Gas Wind Solar
Source: BloombergNEF. Note: O&M stands for operation and maintenance, not all subsidy schemes pay out during negative power prices
9 Eneco, R-meeting, November 28, 2018We have already seen wind and
solar push prices down
German electricity generation by fuel type and power price for the week of October 23, 2017
GW
80 80
60 60
40 40
20 20
0 0
-20
-40
-60
-80
-100
23/10/2017 24/10/2017 25/10/2017 26/10/2017 27/10/2017 28/10/2017 29/10/2017
Solar Wind Other Nuclear Fossil fuel Load Day ahead price
Source: Bloomberg Terminal, Bloomberg NEF
10 Eneco, R-meeting, November 28, 2018Renewables capture a discounted
price
U.K. historical realized prices by technology German historical realized prices by technology
GBP/MWh EUR/MWh
60 60
50 50
40 40
30 30
20 20
10 10
0 0
2010 2011 2012 2013 2014 2015 2016 2017 2010 2011 2012 2013 2014 2015 2016 2017
Coal Gas Solar Wind Average Coal Gas Solar Wind Average
Source: Bloomberg NEF Source: Bloomberg NEF
11 Eneco, R-meeting, November 28, 2018And the discount does not go
away
U.K. outlook on realized power price German outlook on realized power price
GBP/MWh, nominal EUR/MWh, nominal
90 90
80 80
70 70
60 60
50 50
40 40
30 30
20 20
10 10
0 0
2015 2020 2025 2030 2035 2040 2015 2020 2025 2030 2035 2040
Gas Wind Solar Average Gas Wind Solar Average
Source: Bloomberg NEF Source: Bloomberg NEF
12 Eneco, R-meeting, November 28, 2018What can wind and solar expect to
make
U.K. wind realized margins in power market and U.K. solar realized margins in power market and
O&M* costs and margin needed for ROI** O&M* costs and margin needed for ROI**
GBP/kW, nominal GBP/kW, nominal
160 70
Margin
needed
140 60 Margin
needed
120
50
Missing
100 money
40
80
30
60 Realized
Realized margin
margin 20
40
10 O&M costs
20
O&M costs
0 0
2018 2020 2025 2030 2035 2040 2018 2020 2025 2030 2035 2040
Source: Bloomberg NEF Note: *O&M stands for operation and maintenance **ROI Source: Bloomberg NEF Note: *O&M stands for operation and maintenance **ROI
stands for return on investment stands for return on investment
13 Eneco, R-meeting, November 28, 2018Finding the missing money Revenue opportunities for renewables 14 Eneco, R-meeting, November 28, 2018
What revenue options are there

                                                    Revenue options

                             Selling energy                           Selling services

                                 Wholesale market                        Capacity markets

                                 Subsidy auctions                        Balancing markets

                                 Power Purchasing
                                 Agreements (PPA)

15   Eneco, R-meeting, November 28, 2018
Selling energy – guaranteeing
revenue
Sell energy through Get paid for energy by
Wholesale power High uncertainty,
The market with both upside and
market
downside risk
The Low uncertainty,
Generator Auctioned subsidy with limits on upside
state/government
and downside risk
Medium uncertainty,
Power purchasing Consumers of potential for upside
agreement electricity and downside
16 Eneco, R-meeting, November 28, 2018Selling energy – Auctions: where in Europe Source: BloombergNEF 17 Eneco, R-meeting, November 28, 2018
Selling energy – Auctions:
volumes and prices
                                                                   Average clearing price of European Union
Capacity clearing in European Union auctions                       auctions
GW                                                                  EUR/MWh

     14                                                              300
                                                                                          Solar

     12
                                                                     250

                                                           5
     10
                                                                     200

      8
                                                                     150
      6                                                                    Wind

                                                                     100
      4                                                    8
                                                   2
                                      Solar                           50
      2                                                        4
           Wind                                        3
                                                   2
                               1      1
      0                                                                0
          2009 2010 2011 2012 2013 2014 2015 2016 2017 2018                2009 2010 2011 2012 2013 2014 2015 2016 2017 2018

Source: BloombergNEF. Note: 2018 is year to date                   Source: BloombergNEF

18        Eneco, R-meeting, November 28, 2018
Selling energy – PPAs: where and
what technologies
European renewable PPAs by country European renewable PPAs by technology
MW MW
2,500
2,500
2,000
2,000
1,500
1,500
1,000 1,000
500 500
0 0
2009 2010 2011 2012 2013 2014 2015 2016 2017 2018 2009 2010 2011 2012 2013 2014 2015 2016 2017 2018
or or
earlier earlier
Sweden Netherlands Norway United Kingdom Other Wind Solar
Source: BloombergNEF Note: Other includes Finland, Belgium, Poland, Germany,
Italy, Ireland, Spain, and Iceland Source: BloombergNEF
19 Eneco, R-meeting, November 28, 2018What to do? Ideas to navigate the
future
U.K. wind realized margins in power market and U.K. wind example margins from different
O&M* costs and margin needed for ROI** sources
GBP/kW, nominal GBP/kW, nominal
160 160
Margin Margin Other
needed needed revenue
140 140
120 120
Market
Missing revenue
100 100
money
80 80
60 60
Realized PPA revenue
margin
40 40
20 20
O&M costs O&M costs Subsidy revenues
0 0
2018 2020 2025 2030 2035 2040 2018 2020 2025 2030 2035 2040
Source: Bloomberg NEF Note: *O&M stands for operation and maintenance **ROI Source: BloombergNEF. Note: Purely hypothetical scenario, not representing
stands for return on investment modelled or observed data, other revenue could include payments for grid services
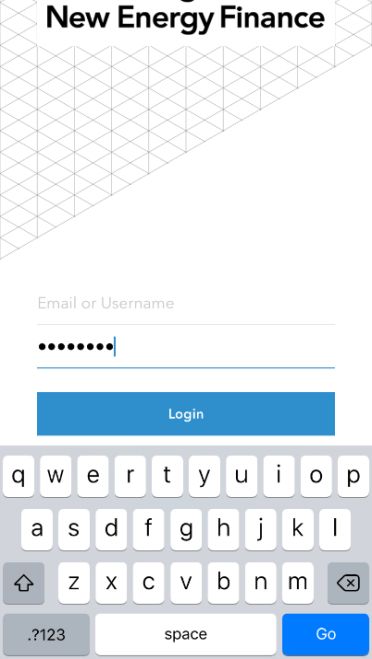
20 Eneco, R-meeting, November 28, 2018Instant access to BNEF
On the Login screen, leave the
Download the BNEF app from username field blank and enter
your mobile app store. bnef in the password field and
Available in the Apple store click “Login”.
and Google Play.
Success! You now have You will be prompted
instant access to BNEF for a 2 to enter your details.
week period Click “submit”.
21 Eneco, R-meeting, November 28, 2018Copyright and disclaimer
The Bloomberg NEF ("BNEF"), service/information is derived from selected public sources. Bloomberg Finance L.P. and its affiliates, in providing
the service/information, believe that the information it uses comes from reliable sources, but do not guarantee the accuracy or completeness of
this information, which is subject to change without notice, and nothing in this document shall be construed as such a guarantee. The statements
in this service/document reflect the current judgment of the authors of the relevant articles or features, and do not necessarily reflect the opinion
of Bloomberg Finance L.P., Bloomberg L.P. or any of their affiliates (“Bloomberg”). Bloomberg disclaims any liability arising from use of this
document, its contents and/or this service. Nothing herein shall constitute or be construed as an offering of financial instruments or as investment
advice or recommendations by Bloomberg of an investment or other strategy (e.g., whether or not to “buy”, “sell”, or “hold” an investment). The
information available through this service is not based on consideration of a subscriber’s individual circumstances and should not be considered
as information sufficient upon which to base an investment decision. You should determine on your own whether you agree with the content. This
service should not be construed as tax or accounting advice or as a service designed to facilitate any subscriber’s compliance with its tax,
accounting or other legal obligations. Employees involved in this service may hold positions in the companies mentioned in the
services/information.
The data included in these materials are for illustrative purposes only. The BLOOMBERG TERMINAL service and Bloomberg data products (the
“Services”) are owned and distributed by Bloomberg Finance L.P. (“BFLP”) except that Bloomberg L.P. and its subsidiaries (“BLP”) distribute
these products in Argentina, Australia and certain jurisdictions in the Pacific islands, Bermuda, China, India, Japan, Korea and New Zealand. BLP
provides BFLP with global marketing and operational support. Certain features, functions, products and services are available only to
sophisticated investors and only where permitted. BFLP, BLP and their affiliates do not guarantee the accuracy of prices or other information in
the Services. Nothing in the Services shall constitute or be construed as an offering of financial instruments by BFLP, BLP or their affiliates, or as
investment advice or recommendations by BFLP, BLP or their affiliates of an investment strategy or whether or not to “buy”, “sell” or “hold” an
investment. Information available via the Services should not be considered as information sufficient upon which to base an investment decision.
The following are trademarks and service marks of BFLP, a Delaware limited partnership, or its subsidiaries: BLOOMBERG, BLOOMBERG
ANYWHERE, BLOOMBERG MARKETS, BLOOMBERG NEWS, BLOOMBERG PROFESSIONAL, BLOOMBERG TERMINAL and
BLOOMBERG.COM. Absence of any trademark or service mark from this list does not waive Bloomberg's intellectual property rights in that that
name, mark or logo. All rights reserved. © 2018 Bloomberg.
22 Eneco, R-meeting, November 28, 2018Bloomberg NEF (BNEF) is a leading
provider of primary research on clean
energy, advanced transport, digital industry,
innovative materials, and commodities.
BNEF’s global team leverages the world’s
most sophisticated data sets to create clear
perspectives and in-depth forecasts that
frame the financial, economic and policy
implications of industry-transforming trends
and technologies.
BNEF research and analysis is accessible
via web and mobile platforms, as well as on
the Bloomberg Terminal.
Coverage.
Clean energy
Advanced transport
Commodities
Digital industry
Client enquiries:
Bloomberg Terminal: press key twice
Email: support.bnef@bloomberg.net
Learn more:
about.bnef.com | @BloombergNEFYou can also read