Gas Market Outlook - Peter Stewart Presentation to International LNG Congress - Chief Energy Analyst - Global LNG Hub
←
→
Page content transcription
If your browser does not render page correctly, please read the page content below
Gas Market Outlook
Presentation to International LNG Congress

              March 14, 2016

        Peter Stewart
           Chief Energy Analyst
Key points we’ll be discussing
What we know
• US LNG exports have begun, first cargo to Brazil
• Around 70-75-million tpa US export capacity by around 2019
• Australian capacity to hit >80 million tpa by around 2018
• Asian market glutted with new supply from Australia
• Oil prices likely to stay trapped in $30-50/barrel range

What we don’t know
• Utilisation of Australian, US LNG projects under construction
• Where US LNG export cargoes will be sold
• Whether production ramp-ups will be slowed, delayed
• Which further projects will take FID to invest in new capacity
• Impact of geopolitical tensions on oil, gas prices

Asia-pacific LNG capacity additions to 2018
Cumulative LNG capacity additions (Asia-Pacific)
            PFLNG 2 FLNG                                                                     •   65 million tpa of
            Prelude FLNG
                                                                                     2018        capacity due to come
           Ichthys Train 2                                                                       on stream in Asia-
      Wheatstone Train 2                                                             2017
                                                                                                 Pacific region by end
           Gorgon Train 3
                                                                                                 2018
           Gorgon Train 2
                                                                                             •   These are firm projects
        Gladstone Train 2
                                                                                                 that are already under
            APLNG Train 2
                                                                                                 construction
    Sengkang LNG Train 1

           Ichthys Train 1                                                                   •   Will take care of
      Wheatstone Train 1                                                             2016        region’s future demand
            APLNG Train 1                                                                        growth
            PFLNG 1 FLNG

           Gorgon Train 1
                                                                                             •   LNG is contracted to
    Donggi-Senoro Train 1
                                                                                                 buyers in Asia-Pacific,
        Gladstone Train 1
                                                                                                 destination-restricted
 Queensland Curtis Train 2
                                                                                             •   Pricing primarily oil
 Queensland Curtis Train 1                                                            2015       linked through JCC
          Existing capacity
                                                                                                 mechanism
                              0   20   40   60   80          100   120   140   160    180
                                                      MtPa

             Floating
             Coal-Seam gas
             Conventional                                                                    Source: IPA Advisory Ltd
             Existing Capacity

22/03/2016                                                                                               3
US LNG exports are game-changer for market
                                                                                                                         Contract volumes
                                                                                  Capacity
Project                                Location            Company                                   Train    Start-Up
                                                                                   (mtpa)

Sabine Pass                            Louisiana           Cheniere                 27.0             1-6     2016-2019

Freeport LNG                           Texas               Freeport                 13.2             1-3     2018-2019

Cameron LNG                            Louisiana           Sempra                   12.0             1-3     2019-2020

Corpus Christi LNG                     Texas               Cheniere                 15.0             1-3     2018-2020

Cove Point LNG                         Maryland            Dominion                  5.3              1        2017

Total                                                                               72.5                     2016-2020

Liquefaction capacity by development certainty
                                 900
                                                                                                                           •     US volumes contracted for Asia
                                                                                                                                 likely to be resold.
                                 800

                                 700                                                                                       •     Prices linked to Henry Hub index
                                 600
  Liquefaction Capacity (mtpa)

                                                                                                                           •     Potential for LNG to remain at low
                                 500
                                                                                                                                 prices even if oil prices rebound
                                 400

                                 300
                                                                                                                           •     Many large LNG projects still to
                                                                                                                                 take FID
                                 200

                                 100

                                  0
                                                                                                                                            Source: IPA Advisory Ltd
                                           Existing   Under-construction   Firm   Probable   Other

                     22/03/2016                                                                                                                       4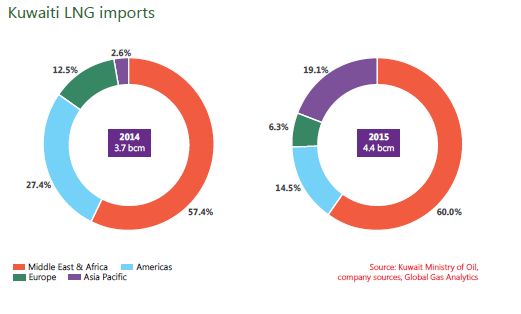
Pricing mechanisms impact global LNG demand

                                          Atlantic    Europe
                            North          Basin
                           America
                                     • Prices = Gas Hubs UK                            South and
                                       NBP Spot Market Index                            East Asia
                                     • Continental = (Gas Oil +   Middle
             Price (U.S.) =            Fuel Oil) Index            East                           Pacific
             Henry Hub Index                                                                     Basin
                                                                           Prices (Asia) = JCCrude Oil
                         Pacific                                           Index + Negotiated
                         Basin

 •    Pricing remains predominantly linked to benchmark crude oil; with ~70% imports delivered on LNG term
      contracts
 •    New supplies from USGC linked to Henry Hub index (NYMEX)
 •    Europe increasingly linked to European gas trading hub prices
 •    New LNG export developments depend on price                                      Source: IPA Advisory Ltd

22/03/2016                                                                                                 5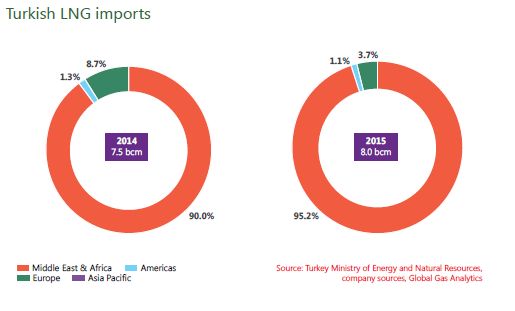
Oil, gas and LNG prices converge: But will this last?
     Estimated Oil, Gas and LNG prices (LNG uses average 6 month lag)

 •     WB projects that oil prices rebound by 50% over the next 12 months from lows~
       US30/bbl, but capped around US$60/bbl until 2020
                                                                        Source: IPA Advisory Ltd

                                                                                   6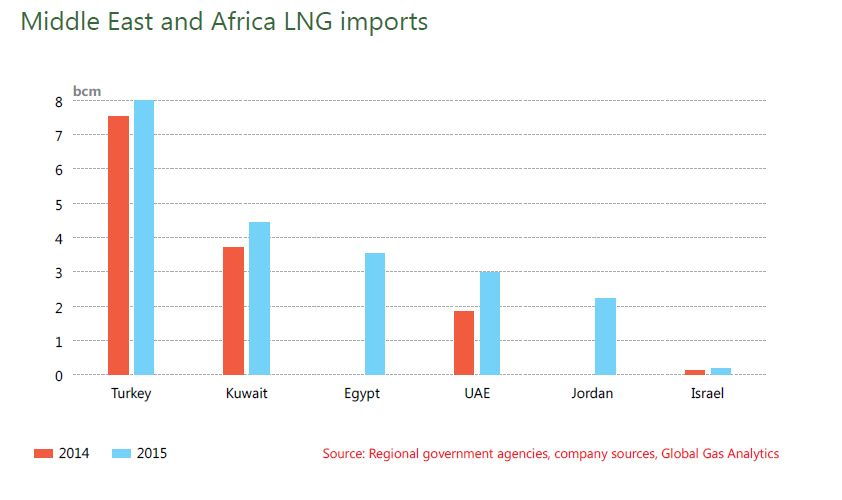
HH-linked and oil-indexed LNG to Europe

Comparison based on current Henry Hub prices

      •      Based on Cheniere formula of Henry Hub *1.15 + $2.25-3.00 / MMBtu liquefaction
             plus freight to Europe

22/03/2016                                                                          7
Where will US LNG export cargoes head? • Conventional wisdom has been that significant volume of US LNG will flow to Europe • European worries about supply security from Russia after the Ukraine crisis • US LNG was seen as cheap and reliable source when oil prices at above $100/bbl • Reality is now very different since oil prices have collapsed • US LNG lands in Europe at $5-6/MMBtu but NBP currently 28 pence/therm (around $4/Mmbtu) • Potential gains in gas use by power sector but carbon price still insufficient to incentivize • Potential for strong growth in transport demand for gas has evaporated now that oil and gas prices have converged • So where will US LNG exports actually target in the near term?
Northeast Asia suffers loss of appetite
                      • Chinese demand growth
                        slowed by sluggish GDP,
                        move to services
                      • Japanese demand has
                        suffered from nuclear
                        restarts
                      • Korean stocks high so
                        limited spot demand
                      • Demand not sufficient
                        to absorb incremental
                        flows from Australia
                      • Australian/Asian LNG
                        even flowing as far
                        afield as Middle East
Americas LNG demand has slowed
• Latin America’s appetite
for LNG has also waned
• Economic slowdown and
political uncertainty
• Strong dollar curbing
imports, as countries
face mounting trade
deficits
• Argentina, Mexico, Brazil
prioritizing development
of domestic resourcesMiddle East demand growing
• Middle East LNG demand growing despite oil price decline. Incentive to import gas
and maximize oil export earnings.New Middle East Importers
• Egypt and Jordan have started
importing LNG. Shipments so far
mainly sourced from other
Middle Eastern countries and
Africa
• Jordan started importing LNG in
May 2015 using an FSRU at the
port of Aqaba, and it is expected
to be a key regional LNG importer
in coming years.
• Egypt is set to become the
largest LNG importer in the MEA
once it installs its third FSRU in
2016. Growing gas-for-power
demand in Egypt, together with
declining production, made the
country an LNG importer in 2015Middle East growth opportunities
• Kuwait sees its dependence on imported
LNG increasing in the coming years. The
country imports LNG using an FSRU at
Mina al-Ahmadi.
• The lease on the vessel expires in 2019, but
Kuwait is working towards extending it and
has considered expanding regas capacity.
• The UAE is an exporter and importer of
LNG. Abu Dhabi exports LNG, while Dubai
imports it. Dubai imported 3 bcm of gas as
LNG in 2015 – an increase of 66.7% on an
annual basis.
• Dubai has a 15-year LNG sales-and-
purchase agreement with Shell, but the
country also issues shorter-term LNG
import tenders. Dubai issued tenders in
October and November 2015 for extra LNG
in 2016 and 2017. Portfolio players are
expected to supply these volumes.Turkey set to buy more LNG
• Turkey was the largest LNG consumer in the Middle east and Africa region last year despite weak weather-related
gas demand. The country’s LNG imports rose by 6.7% on an annual basis in 2015 – to 8 bcm.
• The competitive price of LNG compared with pipeline gas and supply disruptions from Iran and Azerbaijan
contributed to the result. Tensions with Russia make it likely it will need more LNG as new pipeline flows in doubt.Conclusions • Oversupply likely out to around 2020 but this will be managed by lower utilisation, FID delays for new projects, slower ramp-ups • Prices to remain depressed but potential for US LNG to act as cap to prices if oil market recovers • Large volumes of US LNG held by portfolio players. Volumes are free destination and so will be driven by arbitrage • Pricing of LNG will become more flexible, shorter-term contract terms, more frequent break clauses • European demand looks unlikely to be a significant driver unless gas in transport takes off or carbon prices rise significantly (unlikely for now) • Middle East and Latin America look likely to be the key markets for US LNG in near term.
Thank You !

                                                   Questions
                                                   Welcome

Global Gas Analytics:
“Gas market analysis driven by industry insight”
You can also read