PT Semen Indonesia (Persero) Tbk. And the Prospect of Indonesia Cement Industry - Corporate Presentation - August 2018 - IDX

Page created by Roland White
 
CONTINUE READING
PT Semen Indonesia (Persero) Tbk. And the Prospect of Indonesia Cement Industry - Corporate Presentation - August 2018 - IDX
PT Semen Indonesia (Persero) Tbk.
And the Prospect of Indonesia Cement Industry

         Corporate Presentation - August 2018
PT Semen Indonesia (Persero) Tbk. And the Prospect of Indonesia Cement Industry - Corporate Presentation - August 2018 - IDX
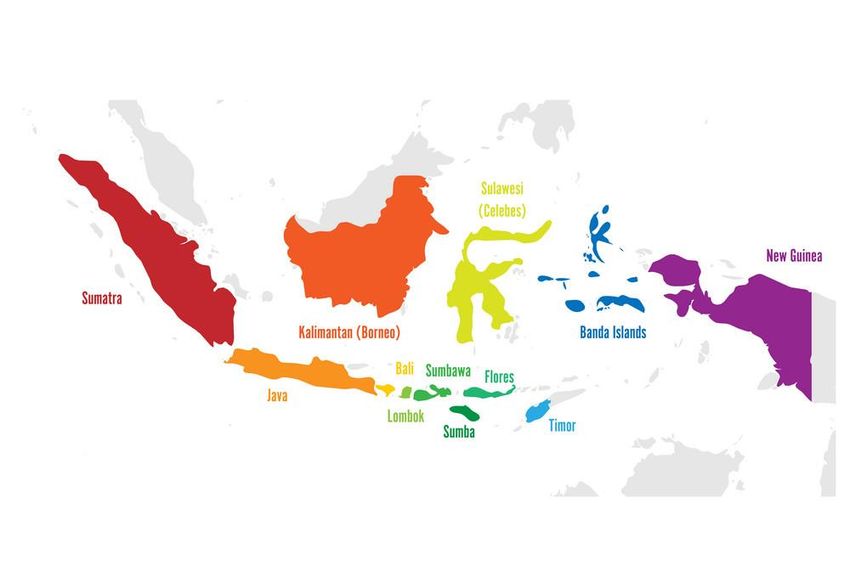
Cement Companies in Indonesia
                                                        Domestic Capacity 2017

                                        Total
                                        107.4 Mio Ton
                                                              2017

           SMGR market share 2017 was 40.8% despite of only 33.4% capacity share

                                                                             2
PT Semen Indonesia (Persero) Tbk. And the Prospect of Indonesia Cement Industry - Corporate Presentation - August 2018 - IDX
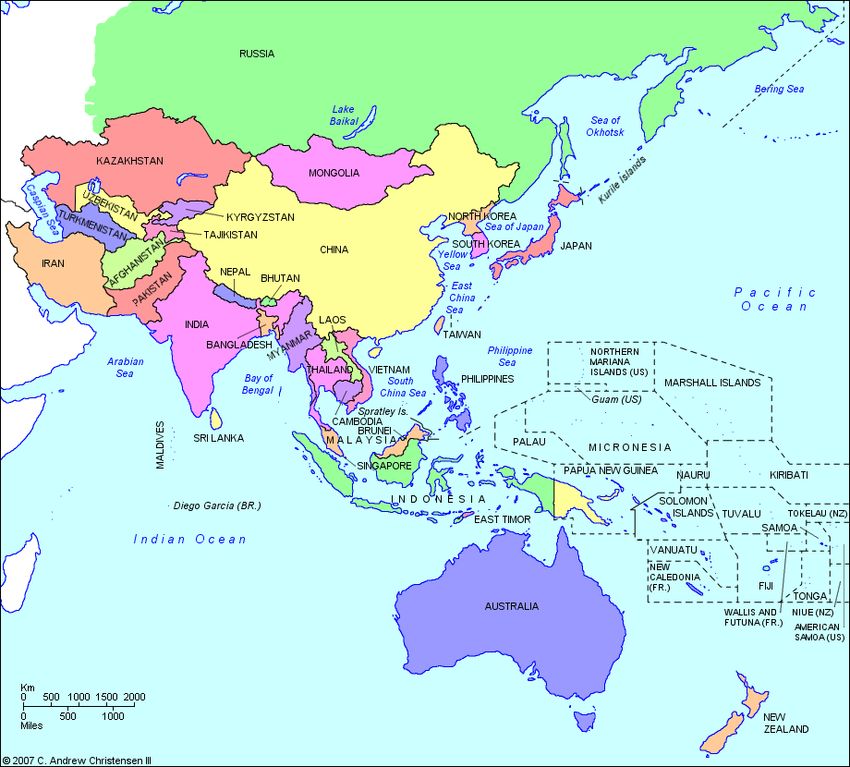
Sales Volume - August 2018 (in Ton)
  Semen Indonesia Group

  Industry - Domestic

  source: company data, Indonesia Cement Association
  Note: The market data is not final since one small player has not updated its sales volume.   3
PT Semen Indonesia (Persero) Tbk. And the Prospect of Indonesia Cement Industry - Corporate Presentation - August 2018 - IDX
Domestic and SMGR’s Market Consumption (up to August 2018)
– Type of Cement

              Domestic Demand                                                                        SMGR Sales
                                                              Ready-mix (infrastructure): ± 60%
                                                              Fabricator (pre-cast, fiber cement,
                                                               cement based industry): ± 35%
                    BULK                                      Projects (mortar, render): ± 5%
                    26.2%                                                                       BULK
                                                                                                30.7%
                                      BAG
                                     73.8%
                                                                                                                  BAG
                                                                                                                 69.3%

  source: Indonesia Cement Association
                                                                                                            Housing: ± 90%
        Demand Growth by Type                                                                               Cement based industry: ±10%

                  15,5%
                                                       14,5%
   13,6%

                                                                          Retail (residential) sector is still the largest
                                                                           consumer of cement in Indonesia
                                                       5,5%
    3,6%
                   2,5%           2,2%          2,0%                      Bulk cement growth is higher than bag cement in
                              1,5%                                         the last two years. Bulk demand growth up to
                                             -1,4%
    2013           2014          2015           2016   2017
                                                                           July 2018 was 12.3% while demand for bag was
                                                                           2.0%
                               Bag       Bulk
                                                                                                                                   4
Market Share (“MS”) by Geography – up to August 2018

                          SMGR is still the dominant player in all regions other than West Java & Jakarta where
                                                                                the competition is more intense

           SMGR MS                                     SMGR MS
           41.8%                                       39.6%
                                                6.4% of total            SMGR MS
                                                national demand          59%

      21.6% of total                                                  8.1% of total
      national demand                                                 national demand
                                                                                         2.2% of total
                              SMGR MS                                                    national demand

        WEST JAVA,            17.4%
        DKI JAKARTA,
        BANTEN
        26.5% of total                      SMGR MS
        national demand                     41.7%         SMGR MS      SMGR MS
                                                          66%          32%
                          CENTRAL JAVA
                          16 % of total          EAST JAVA          5.6% of total
                          national demand        13.6% of total     national demand
                                                 national demand

                                                                                                              5
2018 - KEY STRATEGY

                           Supply Chain Optimization
   (Growth)
    Strategy                 Centralize Marketing
    Refresh                 Centralize Procurement

       Cost Transformation & Enable Corporate Growth

                                                       6
Financial Summary 1H-2018

                    Operating Profit

  28,8%
            26,5%
                       22,2%     19,9%
                                           12,0%    12,8%

  7,06       7,15
                       5,98
                                 5,20
                                           3,34      1,70

  2013      2014       2015      2016      2017    1H 2018

          Operating Profit      Operating Profit Margin

                             EBITDA                                           Net Profit
  33,1%
                                                             21,9%   20,6%
            30,8%                                                            16,9%    17,3%
                       27,5%     26,6%
                                           19,4%    19,5%
                                                                                               7,2%      7,3%

  8,10       8,30                                            5,37    5,56
                       7,43      6,96                                        4,56      4,52
                                           5,40
                                                     2,60
                                                                                                2,01      0,97

  2013      2014       2015      2016      2017    1H 2018   2013    2014    2015     2016     2017      1H 2018

                    EBITDA     EBITDA Margin                          Net Income     Net Income Margin
                                                                                                                   7
Cost of Revenue Breakdown 1st Half 2018

                                          COST STRUCTURE

      20,9%
              15,9%
                                                                                           13,0%
                      10,0% 8,6%
                                   8,0%   7,0%
                                                 3,7%   3,5%   2,6%                 4,3%
                                                                      1,9%   0,7%

                                                                                                   8
Balance Sheet
  Cash Balance (IDRbn)                               Total Interest Bearing Debt (IDRbn)

          5.032                                                                        10.019   10.312

  4.213
                  3.989
                                  3.665
                                           3.105                               6.260
                          2.847

                                                    4.083    3.913    3.999

   2013   2014    2015    2016    2017    1H 2018    2013     2014    2015     2016     2017    1H 2018

  Debt/EBITDA (x)                                    Net Debt/Equity

                                                                                                23,53%
                                  1,93     1,93                                        20,80%

                          0,93                                                11,10%

   0,5    0,47    0,54

                                                                      0%
                                                    -0,60%   -0,45%
   2013   2014    2015    2016    2017    1H 2018   2013     2014     2015     2016     2017    1H 2018

                                                                               9
Key Factors Supporting Domestic Cement Consumption

   Infrastructure Development                               Cement Consumption per Capita (2016)
  Continuous increase in infrastructure budget
  (Rp Tn)                                      410,4
                                         388,3

                        256,1    269,1
    155,9     154,7

    2013       2014       2015   2016    2017    2018
  Source: Ministry of Finance

   Commercial & Industrial
   High growth in retail, commercial and institutional                            Average (ex China) = 462 kg
    sector in urban and semi-urban area
   High growth industry segment (precast, light brick,    Interest Rate
    cement fiber, pave, ready mixed concrete)
                                                          BI policy on interest rate is expected to remain low which
                                                          drives demand for housing loan
    LTV Policy                                           7,50 7,50
  Bank Indonesia loosening macro-prudential policies in               6,75
  the form of an increase in Loan to Value Ratio
                                                                             5,25 5,00                               5,25 5,50
                                                                                       4,75 4,50 4,50
                                                                                                      4,25 4,25 4,50
   Potential Market
   The fourth largest population in the world: 267
    millions people (2017)
   Demographic bonus: rapidly growing productive         Sep Dec Mar Jun Sep Dec Mar Jun Sep Dec May June Aug
                                                           15 15 16 16 16 16 17 17 17 17 18 18 18
    population in Indonesia

                                                                                                                                 10
Our facilities
                                               Kiln                1 unit
                                                                                                       Integrated Cement Plant          5 location
                                               Cement Mill
                                                                   1 unit                                                        Kiln   17 Unit
                                                                                                                         Cement Mill    29 Unit
                                                                                                       Grinding Plant                   4 location
                                                                                                                         Cement Mill    6 Unit
                                               Grinding       1 unit Cement
                                               Plant          Mill                                     Warehouse                        30 location
                                                                                                       Packing Plant                    30 location
                                                                                                       Sea Port                         17 location
                                  Grinding     1 unit Cement
                                  Plant        Mill

Kiln            6 unit
Cement Mill     9 unit

Grinding      1 unit
Plant         Cement Mill
                                                                                                       Kiln          4 unit
       Kiln              1 unit         Kiln              5 unit
                                                                                                       Cement Mill   6 unit
       Cement Mill       2 unit         Cement Mill       11 unit           Grinding   3 unit Cement
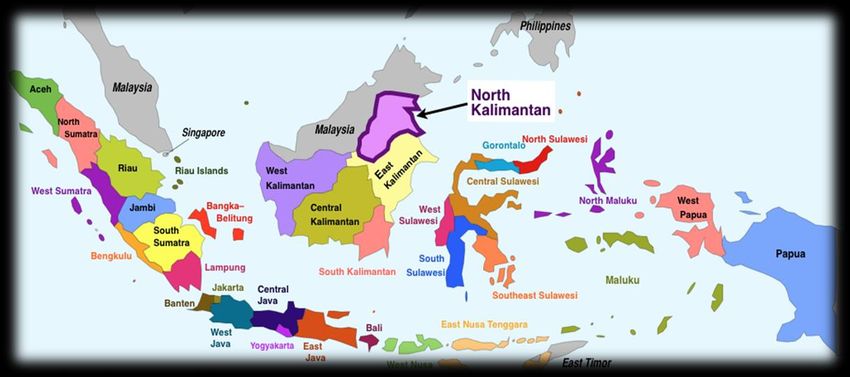
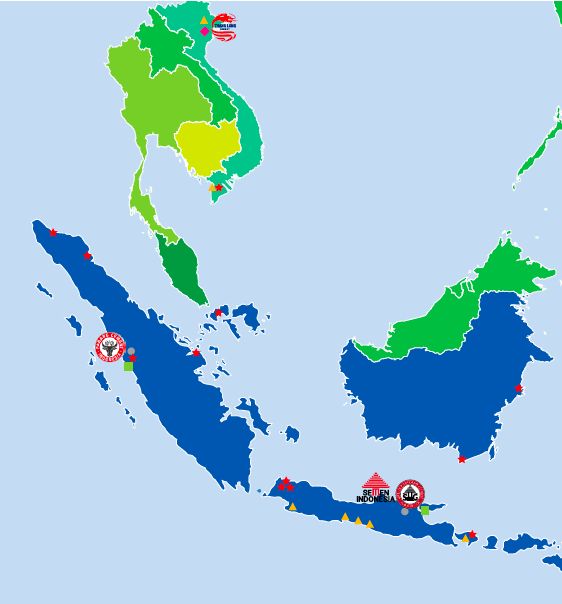
                                                                            Plant      Mill                                                       11
Opportunity Regional Cement Market

                                     12
Dividend Pay Out

         Dividen Pay Out (DPO)

                                 Dividend Per Share (DPS)

                                                            13
Thank You
                                                                                     IMPORTANT NOTICE
THIS PRESENTATION IS NOT AND DOES NOT CONSTITUTE OR FORM PART OF, AND IS NOT MADE IN CONNECTION WITH, ANY OFFER FOR SALE OR SUBSCRIPTION OF OR
SOLICITATION, RECOMMENDATION OR INVITATION OF ANY OFFER TO BUY OR SUBSCRIBE FOR ANY SECURITIES NOR SHALL IT OR ANY PART OF IT FORM THE BASIS OF
OR BE RELIED ON IN CONNECTION WITH ANY CONTRACT, COMMITMENT OR INVESTMENT DECISION WHATSOEVER.
THE SLIDES USED IN THIS PRESENTATION ARE STRICTLY CONFIDENTIAL AND HAVE BEEN PREPARED AS A SUPPORT FOR ORAL DISCUSSIONS ONLY. THE INFORMATION
CONTAINED IN THIS PRESENTATION IS BEING PRESENTED TO YOU SOLELY FOR YOUR INFORMATION AND MAY NOT BE REPRODUCED OR REDISTRIBUTED TO ANY OTHER
PERSON, IN WHOLE OR IN PART.
This presentation includes forward-looking statements, which are based on current expectations and forecast about future events. Such statements involve known / unknown risks
uncertainties and other factors, which could cause actual results to differ materially from historical results or those anticipated. Such factors include, among others:
● economic, social and political conditions in Indonesia, and the impact such conditions have on construction and infrastructure spending in Indonesia;
● the effects of competition;
● the effects of changes in laws, regulations, taxation or accounting standards or practices;
● acquisitions, divestitures and various business opportunities that we may pursue;
● changes or volatility in inflation, interest rates and foreign exchange rates;
● accidents, natural disasters or outbreaks of infectious diseases, such as avian influenza, in our markets;
● labor unrest or other similar situations; and
● the outcome of pending or threatened litigation.
We can give no assurance that our expectations will be attained.
                                                                                         DISCLAIMER
The information contained in this report has been taken from sources which we deem reliable. However, none of PT Semen Indonesia (Persero) Tbk and/or its affiliated companies and/or
their respective employees and/or agents make any representation or warranty (express or implied) or accepts any responsibility or liability as to, or in relation to, the accuracy or
completeness of the information and opinions contained in this report or as to any information contained in this report or any other such information or opinions remaining unchanged after
the issue thereof.
We expressly disclaim any responsibility or liability (express or implied) of PT Semen Indonesia (Persero) Tbk, its affiliated companies and their respective employees and agents
whatsoever and howsoever arising (including, without limitation for any claim, proceedings, action, suits, losses, expenses, damages or costs) which may be brought against or suffered by
any person as a result of acting in reliance upon the whole or any part of the contents of this report and neither PT Semen Indonesia (Persero) Tbk, its affiliated companies or their
respective employees or agents accepts liability for any errors, omission or mis-statements, negligent or otherwise, in the report and any liability in respect of the report or any inaccuracy
therein or omission therefrom which might otherwise arise is hereby expresses disclaimed.

                                                                       Head Office:        Representative Office:
                                        Gedung Utama Semen Indonesia                       The East Tower, 18th floor
                       Jalan Veteran, Gresik 61122, East Java – Indonesia                  Jalan Dr. Ide Anak Agung Gde Agung Kav. E3.2 No. 1
                                    Phone: (62-31) 3981731 -2, 3981745                     Jakarta 12950, Indonesia
                                         Fax: (62-31) 3983209, 3972264                     Telp.: (62-21) – 5261174, 5261175;
                                                                                           Fax : (62-21) – 5261176

                                                                         www.semenindonesia.com
                                                                                                                                                                                             14
You can also read