UK House Price Index - Zoopla Advantage
←
→
Page content transcription
If your browser does not render page correctly, please read the page content below
Research and Insight
                                                                                          December 2020 index
                                                                                          (published 27 January 2021)

UK House Price
Index
Demand rebounds but lockdown makes sellers reluctant to list homes for sale

         +4.3%
            Current UK house
                                        +13%
                                        Demand for homes in
                                                                                    -12%
                                                                               Flow of new supply onto
              price growth          first 2 weeks of 2021 v 2020             market in first 2 weeks of 2021

                               Executive summary
                               •   The third lockdown is exacerbating a supply/demand imbalance in housing.
                               •   Demand has rebounded faster than last year, but the flow of new supply is
                                   slower as sellers are reluctant to list their home while restrictions remain.
                               •   London the only region to register more supply – primarily flats, as owners
                                   trade-up for space and/or investors take gains ahead of possible tax changes.

                               •   The strength of demand in 2020 H2 absorbed a lot of supply, meaning we
                                   start 2021 with 7% fewer homes for sale than a year ago.
                               •   The result is upward pressure on prices – the UK growth rate is +4.3%.

                               •   Three regions are recording their highest growth rates since 2007. Liverpool
                                   city has annual growth running at a 15-year high.
                               •   70,000 households who agreed a sale in 2020 are at risk of missing the stamp
                                   duty deadline – the case for a short, 4-week extension grows.

“ Rising demand and a
  lack of new homes
  coming to the
  market for sale will
  keep an upward
  pressure on house
  prices in the near
  term, especially in
  the more affordable
  parts of the UK.”

 Richard Donnell
 Research and Insight
 Director, Zoopla
December 2020 | UK House Price Index | Page 2
4.3%
Annual UK house price inflation +4.3%
The annual rate of UK house price growth is 4.3%, the highest since April 2017.
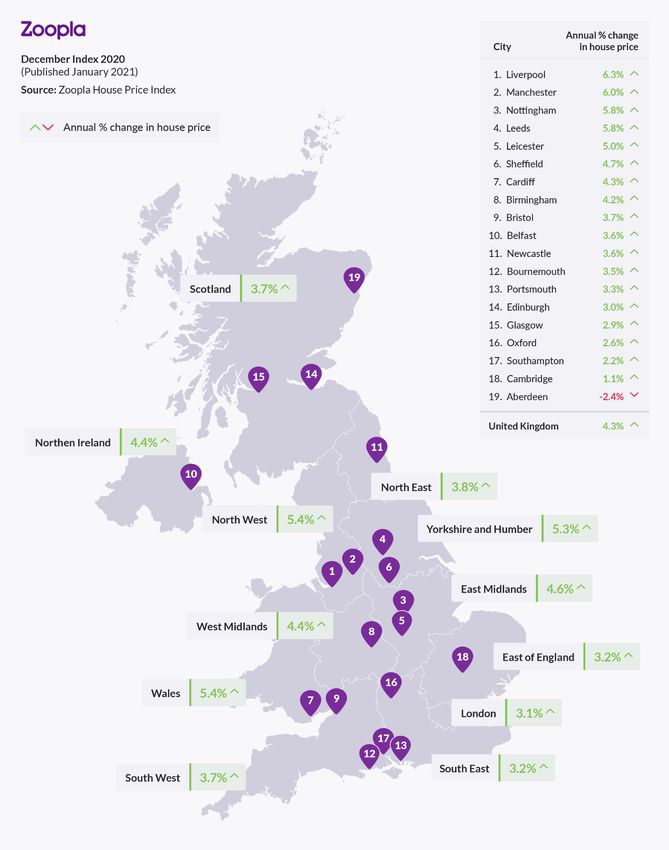
The impetus for growth is coming from Wales, northern England and Scotland
Annual UK house
price growth where strong demand and attractive affordability allow headroom for above
average growth rates. The rate of annual price inflation is highest in Wales and
the North West at +5.4% - see map at page 6.
At a city level, Liverpool has jumped to the top of the growth rankings with
house prices rising by 6.3% over the last 12 months – this is the highest annual
growth rate for 15 years. Manchester is close behind with a growth rate of
+6.0%, back to levels of inflation last seen 2 years ago.
UK house price index summary, December 2020
3-month % year Average
change on year price
Jul-2020 0.3% 2.4% £218,600
Aug-2020 0.8% 3.0% £220,300
Sep-2020 2.2% 3.6% £221,900
Oct-2020 2.1% 4.0% £223,100
Nov-2020 1.2% 3.9% £222,900
Dec-2020 0.8% 4.3% £223,700
Source: Zoopla UK House Price Index
Growth rate hits 10 year high in northern English regions
House price growth is at a decade high across three regions – North East, North
West, Yorkshire and the Humber – in fact growth is running at the highest since
before the global financial crisis. The chart compares current growth rate to the
high-low range between 2010 and 2020. Affordability pressures are acting as a
drag on price growth across southern England where, in 2014 London house
price growth reached +20%. Decade high growth rates of c.5% are low by
historic standards yet remain ahead of the growth in household incomes.December 2020 | UK House Price Index | Page 3
-6%
Number of homes avilable
Fast start to 2021 as demand rebounds faster than 2020
Despite the new lockdown, demand for homes has posted the usual seasonal
rebound which has been stronger than last year. Demand for homes is up 13%
‘for sale’ versus a year ago on this time last year, with new sales agreed also up 8%. This rebound is
broadly uniform across all regions and countries. It is a continuation of above
average demand and market activity from 2020 H2. The ongoing impact of the
pandemic continues to drive moving intent amongst home-owners.
Some new buyers will be looking to beat the stamp duty deadline. In a normal
year over 50% would make it, but far fewer are likely to complete a sale in time
this year given the volume of business in the pipeline and longer completion
times, unless they look to buy a new home.
Third lockdown creates reluctance amongst would-be sellers
The flow of new supply onto the market is slower than this time last year, down
12%. Sellers remain cautious in the face of 3rd lockdown, higher case numbers
and calls for people to limit movement, even though the housing market
remains open for business. We expect sellers to list homes once case numbers
start to fall sharply and/or we move back to regional tier-based restrictions.
The one area where supply is growing is London with flats accounting for much
of this increase. We believe this is a combination of 1) more owners looking to
trade up from flats to houses motivated by a desire for space and more flexible
working patterns; 2) investors looking to sell homes in the face of falling rents
and expectations of an increase in capital gains tax rates in 2021.
Lack of homes for sale keeps upward pressure on prices
A lack of new listings, together with rising demand and more new sales being
agreed is reducing the available pool of homes for sale. There are currently 6%
fewer homes available for sale than this time last year. This is reducing choice
for would-be buyers and will keep an upward pressure on house price growth
in the near term, especially if demand remains in line with or ahead of last year.December 2020 | UK House Price Index | Page 4
70k
Stamp duty holiday – end or extend?
The impact of the stamp duty holiday deadline on activity has been the focus of
intense debate. No-one could have foreseen how strong market conditions
Number of sales agreed in
2020 that may miss 31 March would be in 2020 H2 with 47% more homes selling compared to 2019. Under
stamp duty deadline normal market conditions nearly all homes sold in a calendar year would
complete by the end of March the following year – an average of 90-days to
complete a sale. Market evidence suggests this period has extended by around
two weeks to an average of 110-115 days or just under 4 months.
The chart shows the volume of agreed sales by week number over 2020. We
project forward the sale completions into 2021 assuming it takes an average of
90 days or 120 days to complete a sale – the dotted lines. The stamp duty
holiday is in week 13 of 2021. The range for the number of sales potentially
missing the deadline is 36,000 and 105,000. Most buyers that agreed a sale in
2020 would have expected to complete by the 31 March. Up to 70,000 sales
agreed in 2020 may miss the deadline assuming a 4-month completion period.
What is unclear is how many sales are 100% dependent upon securing the
stamp duty savings. The more buyers who are wholly reliant on securing the
savings, the greater the risk of a spike in fall-throughs. This will have a knock-
on impact on chains of sales. No extension of the holiday will result in chains
failing or buyers within the chain having to help fund the loss of stamp duty.
Growing case for a short extension?
The housing market has been one of the bright spots for the economy. While
the Government will be eager to start raising tax revenues once again the case
for a short, month-long stamp duty extension is growing , to ensure all sales
agreed in 2020 complete. A delayed announcement closer to March would
avoid drawing new buyers into the market. As with all tax policy, this is a purely
political decision. The housing market will not grind to a halt without an
extension, but we expect a short period of lower sales in Q2 which we have
factored into our forecasts for sales in 2021. The debate on property taxes,
their format, who they impact, and potential reforms, will continue to run. It
will remain a hot topic of debate given how much of the nations’ wealth is
accounted for by the value of UK housing which now exceeds £9 trillion.December 2020 | UK House Price Index | Page 5 House Price Index – Country, region and city summary Note: The Zoopla house price index is repeat sales-based price index using sold prices, mortgage valuations and data for agreed sales. The index uses more input data than any other and is designed to accurately track the change in pricing for UK housing.
December 2020 | UK House Price Index | Page 6

                      Zoopla UK house price index – City Summary - December 2020

                      Source: Zoopla House Price Index
                      Sparklines show last 12 months trend in annual and monthly growth rates – red bars are a negative value – each
                      series has its own axis settings providing a more granular view on price development

Contact               If you have any questions about our research please do get in touch.
                      Richard Donnell                                       Gráinne Gilmore
                      Director of Research & Insight                        Head of Research
                      richard.donnell@zoopla.co.uk                          grainne.gilmore@zoopla.co.uk

Recent publications   Sign up for all the latest research from Zoopla at
                      advantage.zpg.co.uk
 UK
 Rental
 Market               The information and data in this report was correct at the time of publishing and high standards are
 Report
                      employed to ensure its accuracy. However, no reliance should be placed on the information
 2020 Q2
                      contained in this report and Zoopla Ltd and its group companies make no representation or
                      warranty of any kind regarding the content of this article and accept no responsibility or liability
                      for any decisions made by the reader based on the information and/or data shown here.
You can also read