Key Insights - Housing Outcomes in Established Melbourne 2005-2016 - Monitoring Land Use Planning Outcomes April 2018
←
→
Page content transcription
If your browser does not render page correctly, please read the page content below

Key Insights – Housing Outcomes in
          Established Melbourne 2005-2016

Monitoring Land Use
Planning Outcomes
April 2018
Introduction
The Housing Development Data
(HDD) provides annual lot by lot
information on Melbourne's housing
stock.

This presentation uses the HDD to
examine:
•   The ratio of development in
    Melbourne’s growth and
    established areas.
•   The impact of long term
    planning to promote housing in
    locations with good access to
    jobs, services and public
    transport.
•   Reform of the business/
    commercial zones.
These policies and reforms span
the 2005-2016 period which
encompassed Melbourne2030, the
reform of the Residential Zones
and the release of Plan Melbourne.   2
The 70/30 aspiration
                                     Net new dwellings in Growth Area precinct structure planning areas
The 70/30 aspiration identified      and established Melbourne*
in Plan Melbourne (Direction
2.1) seeks to shift a higher
proportion of new housing
development to land with
existing infrastructure by 2051.

As a long term aspiration for the
city’s growth the HDD
demonstrates that housing
growth is steadily shifting toward
established areas and that the
70/30 aspiration is an
achievable long term objective
for Melbourne.

                                                                                                                                                 Source: HDD16

                                          *Growth Areas are defined as any location within Growth Area municipalities that is subject to the
                                          Precinct Structure Planning process or a locally equivalent process. This division distinguishes land with
                                          existing infrastructure (established Melbourne) from land that requires new infrastructure.

                                                                                                                                                         3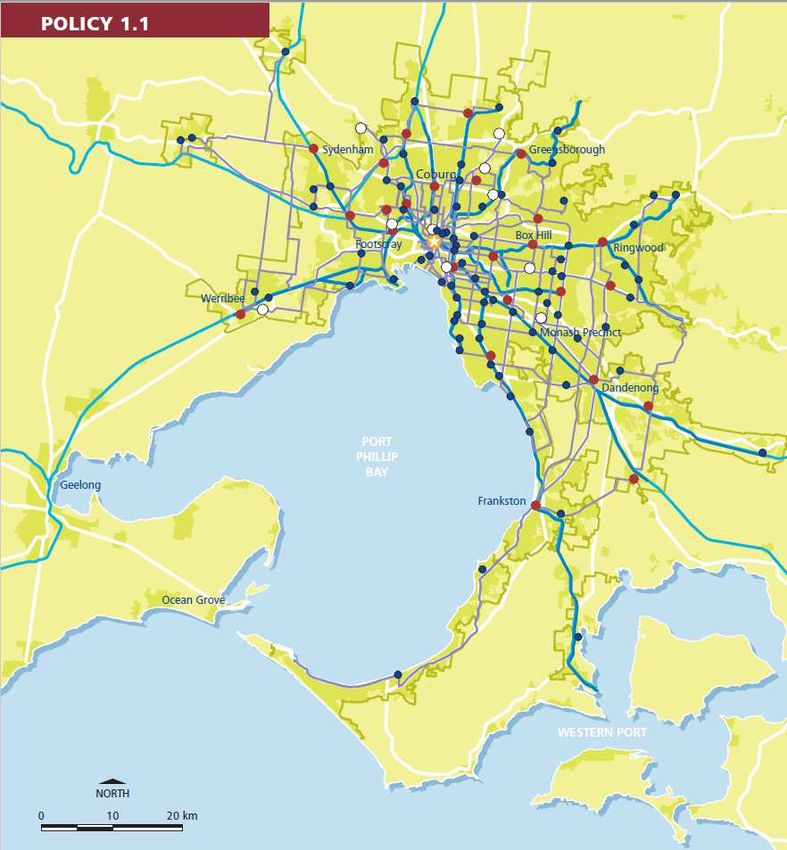
Urban Renewal
The redevelopment of            Projected major redevelopment projects 2017

existing and redundant sites
for new housing provides a
high proportion of
Melbourne’s established
area housing supply.

There are currently 235,000
dwellings planned for major
redevelopment sites
throughout established
Melbourne that are
scheduled for development
over the next decade.

The number of new
dwellings in the urban
renewal pipeline will grow as
more sites are identified and
undergo detailed planning.

                                                                              Source: Urban Development Program 2017

                                                                                                            4
Urban Renewal

A growing proportion of the                          Projected major redevelopment projects 2017
redevelopment pipeline is in                         120,000
Melbourne’s middle ring.                                                                                                Apartments 10+
                                                                                                                        Storey
                                                                                                                        Apartments 4-9
There are currently 97,000                           100,000
                                                                                                                        Storey
dwellings planned in major                                                                                              Apartments 2-3
renewal sites in Melbourne’s                                                                                            Storey
                                                      80,000                                                            Townhouses
middle ring up from 70,000

                               Number of dwellings
dwellings in 2016.                                                                                                      Detached

                                                      60,000

                                                      40,000

                                                      20,000

                                                           0
                                                                    Inner             Middle            Outer              Growth Areas
                                                                                               Region

                                                                                                        Source: Urban Development Program 2017

                                                                                                                                      5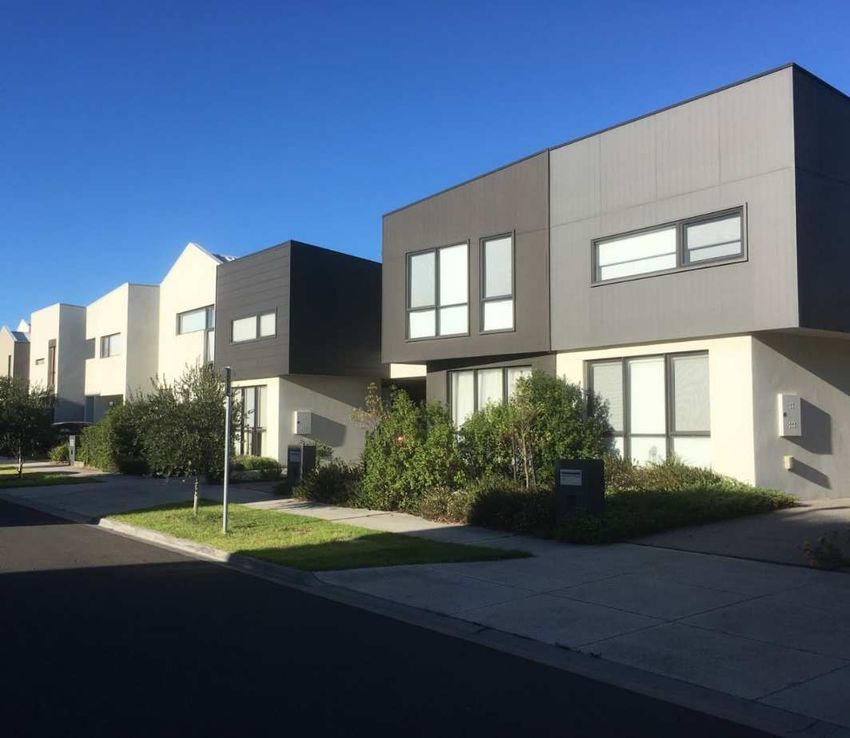
Growing housing near jobs and services
Direction 1 of Melbourne2030 – A
More Compact City - aimed
to locate a substantial proportion
of new housing in or close to
activity centres and other sites
offering good access to services
and transport.

Local government responded to
Melbourne2030 directions
by developing structure plans to
guide the growth of their centres.

Plan Melbourne Outcome 2:
Melbourne provides housing
choice in locations close to jobs
and services
reaffirms and expands the role of
accessible locations in supporting
housing growth.

                                              6
Growing housing near jobs and services
                                                                  Proportion of development in established Melbourne* in and around Activity
The HDD demonstrates that the                                     centres (400 metres) 2005-2016

aspiration to locate a higher proportion                                            Established                  In and around                 %
of new housing in and around activity                                               area dwellings*              Activity Centres
centres is being achieved.                                         2005             1,200,000                    335,000                       28%
As at December 2016, 51% of the                                    2016             1,420,000                    448,000                       32%
220,000 net new dwellings
completed between 2005 and 2016                                    Change           220,000                      113,000                       51%
were within 400 metres of an activity
centre.
Long term activity centre planning is
successfully enabling
more Melbournians to live in close
proximity to jobs, services and
transport.

Activity Centre policy spans both Plan Melbourne and Melbourne
2030 and is the most spatially specific and locally implemented
policy promoting housing near jobs, services and transport.
Melbourne 2030 identified 122 centres and Plan Melbourne an
                                                                                                                                              Source: HDD16
additional 11 primarily in growth areas. As Plan Melbourne is
further implemented in local planning schemes other strategic         *Established Melbourne is defined as the 25 local government areas in Melbourne that do
areas will be added to the Department’s monitoring.                   not include a growth area.

                                                                                                                                                        7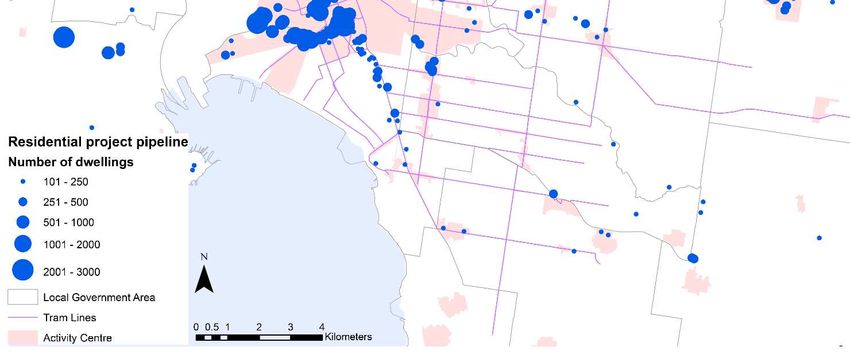
Growing housing near jobs and services
                                           Activity centres with highest change in dwelling stock within the
As at 2016, 32% of established area        Activity Centre boundary 2005-2016             Note: table revised April 2018

dwellings were within 400 metres of                                                       Change
                                                                     Stock     Stock
Activity Centres (approximately            Activity Centre Name                           2005-             Growth
                                                                     2004       2016
                                                                                           2016
450,000 dwellings).
                                          Melbourne Central City          17,476          52,192          34,716           Trebled+
Since 2005, housing within the core of
activity centres has grown by near on     Prahran/South Yarra             2,836           8,476           5,640            Trebled+
90% (from 86,000 dwellings to             Brunswick                       1,293           5,196           3,903            Trebled+
160,000 in 2016).                         Port Melbourne-Bay
                                          Street                          4,009           6,237           2,228               56%
In many activity centres dwelling stock   Richmond-Victoria
has doubled and trebled, which is         Street                          1,401           3,252           1,851           Doubled+

reflected in the changing form, amenity   Box Hill                        1,315           2,990           1,675           Doubled+
and general level of activity in
                                          Doncaster Hill                  423             1,878           1,455           Emerged*
Melbourne’s centres.
                                          Fitzroy-Smith Street            2,296           3,721           1,425               62%

                                          Footscray                       1,047           2,330           1,283           Doubled+

                                          Richmond-Bridge Road            185             1,401           1,216           Emerged*

                                          Dandenong                       925             1,899           974             Doubled+

                                          Richmond-Swan Street            4,845           5,813           968                 20%

                                          North Essendon                  263             1,170           907             Emerged*
                                          Hawthorn-Glenferrie                                                             Source: HDD16
                                          Road                            47              843             796             Emerged*

                                          St Kilda                        1,129            1,851          722                 64%
                                                                                                                                 8
                                           *Emerged describes centres that at 2004 had minimal housing stock which over the 12 year
                                           period added significant residential stock.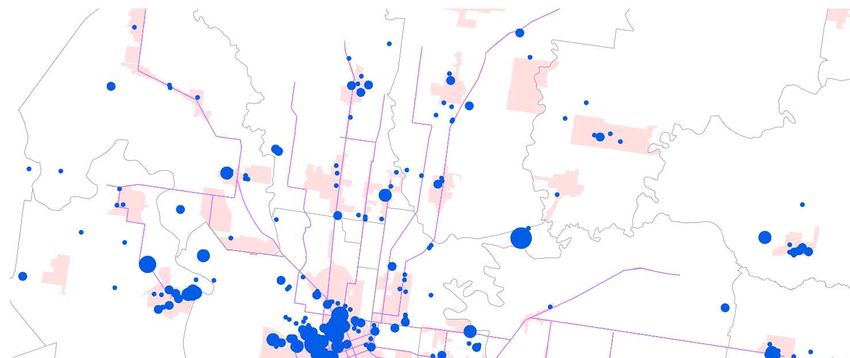
Moonee Ponds – Relative housing affordability
New dwellings constructed in and around activity centres are primarily apartments.
Case studies comparing the price of off the plan apartment sales with those of established stock
in the suburbs of Moonee Ponds, Hawthorn, Doncaster and Brunswick demonstrate the relative
affordability of new apartments. Apartments create housing choice by providing households with
the option of a generally smaller dwelling that is of a comparatively lower cost than surrounding
townhouses and detached houses.

82% of apartment transactions were below $650,000
Moonee Ponds January 2016 - December 2017

                                                                                                                                Source: Charter Keck Kramer

    *The X axis measures area. For Off the Plan apartment sales internal area is measured. For established sales the lot area
    is measured unless the sale is an existing apartment in which case internal area is measured. In most case established                             9
    sales are detached houses and townhouses and therefore are measured according to lot size.
Hawthorn – Relative housing affordability

56% of apartment transactions below $600,000
Hawthorn January 2015 - June 2016

                                                 Source: Charter Keck Kramer

                                                                    10
Brunswick – Relative housing affordability
94% of apartment transactions below $600,000
Brunswick and Brunswick East January 2015 - June 2015
Source: Charter Keck Kramer
11Doncaster – Relative housing affordability
100% of apartment transactions were below the median house price
Doncaster March 2014 - 2015
Source: Charter Keck Kramer
*The X axis measures area. For Off the Plan apartment sales internal area is measured. For established
sales the lot area is measured unless the sale is an existing apartment in which case internal area is
measured. In most case established sales are detached houses and townhouses and therefore are
measured according to lot size. 12Directing density to the right locations
Relative housing affordability
Average site density of projects in and around Activity Centres,
The planning system is successfully established Melbourne, 2011-2016 (excluding Melbourne LGA)
directing density to the right
locations.
The parts of Melbourne with the best
access to jobs, services and
transport are being developed at the
highest residential densities while, in
suburban areas, new housing is
developed at relatively lower
densities.
13Activity Centre Success – Key Learnings
Learnt
The success of activity centre
policy demonstrates the role of
strategic planning in anticipating
and facilitating long term change. A
consensus between state and local
government in supporting higher
levels of growth and density in
activity centres has been central to
the success of this policy.
At a statutory level, a clear logic
linking broader city wide planning
objectives to detailed spatial plans
and statutory controls has helped
direct growth to activity centres.
Councils have also worked with
developers and their community to Doncaster Hill Structure Plan 2002 - 2004
facilitate growth in their centres.
Planning that adapts and evolves to
changing conditions can help
deliver more amenity and choice to
14
local communities.Directing density to the right locations
Relative
Plan Melbourne aims housing
to affordability
facilitate a spectrum of high,
medium and lower density
housing change areas that
together create choice for
households.
When the 2004 slide is
compared to the 2016 slide, a
more diverse urban form can
be seen to be emerging
particularly in and around
suburban activity centres.
For households a spectrum of
housing densities means
greater housing choice.
2004 Source: HDD2016
15
Source: HDD16Directing density to the right locations
Relative
Plan Melbourne aims housing
to affordability
facilitate a spectrum of high,
medium and lower density
housing change areas that
together create choice for
households.
When the 2004 slide is
compared to the 2016 slide, a
more diverse urban form can
be seen to be emerging
particularly in and around
suburban activity centres.
For households a spectrum of
housing densities means
greater housing choice.
Source: HDD2016
2016 16
Source: HDD16Nodes of activity, services and housing
State activity centre policy aimed to build
up centres as locations of activity, local
living and as places that provide a wider
range of services over longer hours.
Essential Economics were commissioned
to investigate the impacts of housing and
population growth in the Heidelberg,
Oakleigh and Moonee Ponds Activity
Centres. The study identified:
• Employment diversification and growth
• According to traders increased activity
has contributed positively to street
safety and retail demand
• Increasing specialisation and growth in
the night time economy.
17Housing growth in mixed use locations growth
Doing density well
Mixed use/commercial areas are an Net dwellings by residential and commercial zones 2005-2016
(excluding growth area LGAs)
increasingly important source of
Melbourne’s housing supply.
In established Melbourne, housing
development in commercial/mixed
use areas has increased from 30%
of new dwellings in 2005-2010 to
nearly 50% in 2011-2016.
Source: HDD2016
Department of Environment Land Water and Planning 18
March 2018Key Insights
• Established Melbourne is successfully growing housing near jobs, services and
transport which will be enhanced through the implementation of Plan Melbourne.
• The success of activity centre policy shows that strategic planning takes time and
requires statutory implementation and a clear logic linking objectives to plans.
• Government is seeking to maintain high quality urban environments as the city
increases its density. The introduction of apartment standards, garden area
requirements and new set back and height requirements in the central city are
important steps in achieving liveability while the city changes.
• Competition for land between economic and residential land use requires ongoing
monitoring.
19You can also read