COMPREHENSIVE PLAN UPDATE - TOWN OF BETHLEHEM COMPREHESIVE PLAN UPDATE COMMITTEE
←
→
Page content transcription
If your browser does not render page correctly, please read the page content below
TOWN OF BETHLEHEM
COMPREHENSIVE PLAN
     UPDATE
   COMPREHESIVE PLAN UPDATE COMMITTEE
               Meeting #2
             January 15, 2020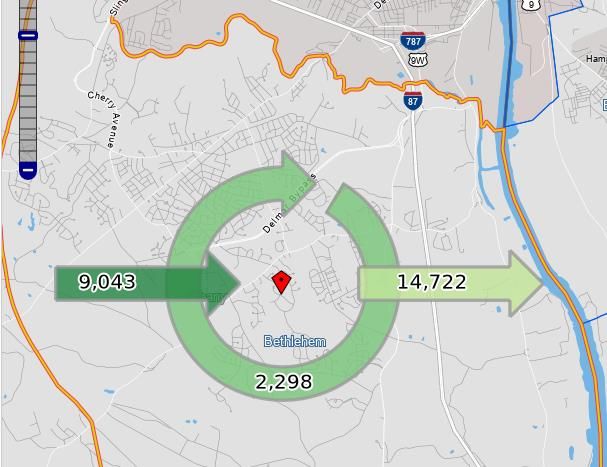
Meeting Agenda

1.   Welcome
2.   Bethlehem Demographic and Growth Analysis
     Presentation
3.   Discussion of Key Takeaways from Analysis
4.   Components of Comprehensive Plan Update –
     Consultant Tasks
Bethlehem Demographic and Growth Analysis
1991-2018
• Capital District Regional Planning Commission Technical
 Assistance Grant
• Establish an important baseline of
 • current conditions,
 • analysis of trends over time, and
 • assist in providing emphasis or background to future goal, policy,
   recommendations
• Comparison communities – are we unique or consistent with
 Capital Region
Residential Development Trends

All Residential Building
Permits (Units)                           300

1991-2019                                                                                2011
                                                                                        Market
•   Single family permit issuance         250                              2006        improves
    slowed after-2005 Comprehensive                                        Down
    Plan (housing downturn)                                                 turn
•   Multifamily units permit issuance     200

    similar pre- and post- 2005                                            2005
    Comprehensive Plan, but                                                Comp
    concentrated in years after           150                              Plan
    recession (2011 – 2016)
•   2016 – 2019 shift back to SFH
                                          100
•   Since 2005 Comprehensive Plan,
    Town had 35% the single family
    development that occurred
                                           50
    between 1991 and 2004.
•   Nearly 1,500 residential units have
    been proposed, are under review,       0
    or have been approved but await
    construction.
                                                Bethlehem: Single-Family    Bethlehem: Multi-Family
Residential Building 310
Permits 1991-2019
Community Comparison 260
• Bethlehem - above average in
1990’s and early 2000’s to 210
below average in late 2000’s
and 2010’s 160
• Halfmoon saw steady increases
• Colonie top or second most 110
residential unit permitter
• Rotterdam permit issuance 60
declined
• Malta had ups and downs, but 10
no significant change over time
-40
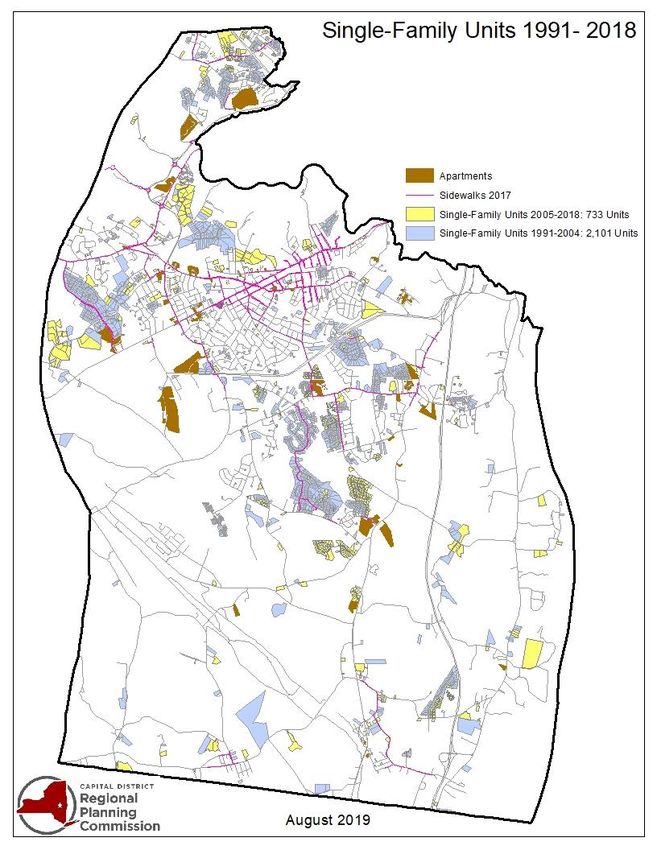
Colonie Halfmoon Malta Rotterdam BethlehemDeveloped Residential
Parcels 1991-2019
• Developed 2,834 parcels with Single
Family Residences (2,948 acres)
• 2,101 parcels on 2,112 acres between
‘91 and ‘04
• 733 parcels on 836 acres between ‘05
and ‘18
• Location
• south of the Delmar Bypass/Glenmont
• near Fisher Blvd.,
• near NYS Rt. 85,
• North BethlehemTakeways - Discussion
• In the 14 years since the 2005 Comprehensive Plan was adopted (2005 – 2018),
Bethlehem has seen close to 35% of the single family residential development that
occurred in the years prior, between 1991 and 2004.
• Total multi-family permitting was about the same between these two periods, but
since the 2005 Comprehensive Plan was adopted, multifamily permit issuance
occurred in a tighter timeframe during the period between 2011 and 2016.
• Housing growth has slowed for Bethlehem and other peer towns over the past 7
years compared to previous decades growth.
• Consider the breakdown of housing types in the development pipeline in relation
to the demographic changes the Town expects to experience in the next 10 years.
As the share of older adults (age 65+) grows, will residential development projects
under review now address their housing needs? Do we wish to attract a younger
generation, and if so, what are their housing needs?Population and Housing Characteristics
Population Characteristics                   Population Breakdown by Age Cohort                                        Educational Attainment
                              35%                                                                              100%
                                                                                       29.90%
• ~35,000 Population (2019)   30%                                                                              80%                                     33.00%
                              25%                                          21.70%
                                                                                                17.20%         60%
                              20%                 16.70%
• 30% of Bethlehem
                                                                                                                                                       25.60%
                              15%                                                                              40%
                                                             8.50%                                                                                     22.50%
                              10%      6.10%
 residents estimated           5%
                                                                                                               20%
                                                                                                                                                        16.00%
                               0%
 between 45 and 64 years
                                                                                                                0%                                      3.00%
                                     Preschool School     College    Young Adult (45  Older                           Graduate or professional degree
                                      (0 to 4) Age (5 to Age (18 to Adult (25 to 64) Adult (65
 of age                                          17)        24)      to 44)           plus)
                                                                                                                      Bachelor's degree
                                                                                                                      Some college or associate's degree
                                                            Bethlehem town                                            High school graduate (includes equivalency)

• Estimated 90% of                                                                                                    Less than high school graduate

 residents White, non-                                               Population Breakdown by Race/Ethnicity

 Hispanic.                                     Black or African American        2.1%

                                      American Indian or Alaska Native       0.0%

• 33% have a Graduate or                                    Asian alone          4.1%

 Prof. degree, 58.6% have     Native hawaiian and other pacific islander     0.0%

 at least a Bachelor’s                      Two or More Races, percent          1.9%

 degree                                      Hispanic or Latino, percent        1.5%

                                     White alone, not Hispanic or Latino                                                                                   90.3%

                                                                           0%       10%   20%    30%     40%   50%     60%      70%       80%      90%          100%
40,000
Bethlehem Population 36,088 36,735 36,899
Estimates and 35,000 33,656
34,861
Projections by Age 31,304
Cohorts 30,000
27,552
• Older adults, ages 65+, make up 25,000
17.2%. Projected to increase
significantly by 2030 20,000
• Number of young and school
age children to decline by 2030 15,000
• 2017 age dependency ratio for 10,000
Bethlehem is 53; increases to 71
by 2030 5,000
• New services for population
0
1990 2000 2010 2020 2030 2040 2050
Under 5 5 to 14 15 to 24 25 to 34 35 to 44
45 to 54 55 to 64 65 to 74 75 & OverTakeways - Discussion
• The large increase in the number of dependent population (children, seniors) in
the town emphasizes the need for thoughtful planning for transportation,
housing, and services to support the dependent population in the long term.
• The Town may want to attract more young and middle aged adults to the Town to
balance out the polarization in the age distribution. Is this a goal for the
Comprehensive Plan Update? What land uses, services, or activities do we need
that we don’t have to attract young and middle aged adults?Housing Characteristics 90%
76.8%
80%
• Mostly single family 70%
60%
residences – 76.8% 50%
40%
30%
• Fewer attached single 20% 14.2%
10% 4.3%
family units – 6.5% 0%
3.0%
(townhomes) 1-Unit
(Attached or
2-9 Units 10-19 Units 20 or More
Units
Detached)
• More than ¾ of residents Bethlehem Owner Occupied Renter Occupied
own homeMonthly Housing Costs Bethlehem Occupied Units Paying Rent Bethlehem Housing Units with a Mortgage
by Tenure 50%
Albany MSA Occupied Units Paying Rent Albany MSA Housing Units with a Mortgage
• More than 50% of owner- 45%
occupied homes with a
mortgage pay more than 40%
$2,000 per month in housing 35%
costs
30%
• While $2,000 per month aligns
with 30% rule for many in 25%
Bethlehem ($96,384 Median 20%
HH Income), affordability may
be difficult for those with 15%
income at or below Albany 10%
metro area median HH income
($65,743) 5%
• Rental units affordable, but 0%
fewer of themTakeways - Discussion
• Bethlehem’s ratio of single-family detached to single-family attached has
remained consistent over the last 7 years. Developments such as Walden Fields
and Chadwick Square provide single-family attached townhome housing options
for residents. Do we need more single-family attached homes?
• Bethlehem’s higher rates of single family and owner occupied units and lesser
amount of multifamily and rental units may indicate a limited supply of attainable
and affordable housing in the Town.
• What types of housing (single-family detached, single-family attached
townhomes, multi-family) does Bethlehem need?Economic Number of Establishments by
Industry Sector Population Breakdown by
Characteristics Labor Force Status
Finance and insurance 48 80%
• Employment is high Information 11
70%
60%
among residents Other services (except public
administration)
71
50%
40%
30%
• Management,
Accommodation and food services 69
20%
Arts, entertainment, and 10%
business, science recreation
15
0%
Civilian labor Employed Unemployed Not in labor
Health care and social assistance 104
occupations are well force force
Educational services 11 United States Bethlehem town
above national level. Administrative and support and
47
waste management and… Resident Occupations
Professional, scientific, and
75
60%
technical services
50%
Real estate and rental and leasing 27 40%
30%
Transportation and warehousing 18 20%
10%
Retail trade 93 0%
Management, Service Sales and Natural Production,
business, occupations office resources, transportation
Wholesale trade 19
science, and occupations construction, etc
arts and
Manufacturing 17 occupations maintenance
occupations
0 20 40 60 80 100 120
United States Bethlehem townCommuting Behavior
5.70%
• 86% of employed residents in Worked at home 3.50%
4.70%
Bethlehem commute outside
community to go to work 0.90%
Other means 1.60%
• 1 in 5 working in town also live 1.80%
in town
1.70%
• An estimated 9,043 people Walked 4.60%
2.70%
commute into town for work
1.30%
• Approximately 84% of Public transportation (excluding taxicab) 5.90%
employed residents drive alone 5.10%
to work, 6.1% carpool
6.10%
Car, truck, or van -- carpooled 7.50%
• Approximately 3% of employed 9.20%
residents walk or take public
transportation to work 84.30%
Car, truck, or van -- drove alone 77.00%
76.40%
• An estimated 5.7% of employed
residents work at home 0% 20% 40% 60% 80%
Bethlehem Albany city United StatesComponents of Comp Plan Update Consultant Tasks Task 1: Public Participation Plan – how to obtain public input to inform Vision, Goals, Policy and Project Recommendations, Land Use Revisions Task 2: Build-Out Analysis – development growth scenarios Transportation assessment – future roadway improvements Task 3: Comprehensive Plan Update document Task 4: Town Code Amendments? – Zoning Law, Subdivision Regulations, Stormwater Management, etc.
Next Steps
• Prepare Request for Proposal based on Tasks
• Solicit consultants – 3 week response period
• Sub-group of Committee reviews consultant
 responses/interviews and selects consultant
Thank You.

Next Meeting: February 19, 2020
You can also read