Starting Genetic Imaging Analyses with SOLAR-Eclipse - Peter Kochunov Ph.D.
←
→
Page content transcription
If your browser does not render page correctly, please read the page content below
Starting Genetic
Imaging Analyses with
   SOLAR-Eclipse
     Peter Kochunov Ph.D.
     pkochunov@gmail.com
To participate in the demo
• Please register and get HCP account
• http://hcpx-demo.humanconnectome.org
• The univariate demo
– http://tinyurl.com/mvyxcmq
– or
– https://hcpx-demo.humanconnectome.org/app/template/
UnivariatePolygenic.vm
• The bivariate demo
– http://tinyurl.com/ltqf8sj
– or
– https://hcpx-demo.humanconnectome.org/app/template/
GeneticCorrelation.vmIntroduction
•What is SOLAR-Eclipse
•Downloading and installing SOLAR-Eclipse
•Creating a solar analysis directory
• Pedigree file
• Phenotype file
•Common analyses types
• Heritability
• Genetic Correlations
•Get this file: www.mdbrain.org/personalpages/peter/
lpa.tarSOLAR-Eclipse
• Extension of SOLAR for imaging genetics
• Developed for multiplatform (pc/mac/linux)
–Genetic analysis of discreet and continuous traits
–Supports All Common Genetic Analyses for
Continuous and Discrete traits.
• Heritability
• Genetic Correlation
• Quantitative trait Linkage
• GWAS analyses in related and unrelated samples
–Supports uni-and-multivariate analyses
–Supports discrete and continuous covariates
Main Strength – Genetic Analysis in Family and Twin
SamplesDownloading/Installing SOLAR
• Get it from NITRC website
– http://www.nitrc.org/projects/se_linux/
– Use the linux version for most of the features
• Latest Apple/PC versions are compiled at request
• Email your user name to get the registration
code.
– solar@txbiomedgenetics.org
– This code will work on any machine with the same
user name
– Registering for a specific domain is also available
• Manual/Instructional videos at http://
www.mdbrain.org/solareclipse/Develop Analysis Plan • Background – Lipo-Protein A (LAP) stimulates lipid metabolism. – Specific polymorphisms may influence LPA1/2 levels measured in blood • Questions – Are LPA1/2 concentrations in blood influenced by additive genetic effects? – To what extent is white matter integrity measured through DTI-FA determined by additive genetic effects? – What extent are the same genetic factors influencing both white matter integrity and LPA levels? • Approach – Measure DTI-FA and [LPA1/2] in blood in N=60/50 MZ/DZ twin pairs. – Measure heritability of average FA values – Measure heritability of [LPA] – Calculate pleiotropy between two traits!
Our Twin Pedigree
                                   Founders

MZ Female twins   MZ Male twins   DZ Male twins   DZ Female twins    DZ twins
  (Npairs=33)      (Npairs=27)     (Npairs=13)      (Npairs=14)     (Npairs=13)

                                   Subjects
Making a pedigree
• A very important step.
• Pedigree contains “genetic information” based
on relatives.
– Expressed as kinship matrix
– MZ twins share 100% genetic variance
– DZ twins share 50% of genetic variance
• SOLAR pedigree must have “founders”
– Founders are the basis of the pedigree and
are assumed unrelated
– Founder only pedigrees can be used for
GWAS analysis of unrelated individuals.Actually is a very simple process
• Best done in Excel
• Start coding one subject per line.
• ID – subject id (your choice)
• FA/MO are IDs for parents
– will have to be included as founders even if
they don’t have phenotypes
• FAMID – optional family id
• MZTWIN – identifier for MZ twins. A twin pair is
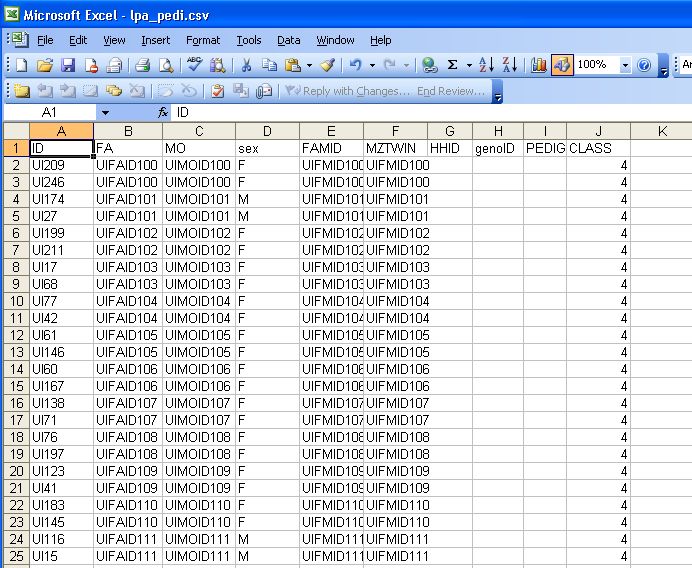
defined as subjects with same identifier.Pedigree file in excel Lpa_pedi.csv. CSV stands for comma separated value file format
Continued

• HHID
  – Household id. Use for study of household effects
  – Use it if you have twins living in different households
• genoID
  – Is not commonly used
• Pedigree Number
  – Is not commonly used in humans
• CLASS
  – Important for mega-genetic analysis. Covariates and other
    normalizations are performed per class
  – If you plan to combine multiple studies assign them non-
    overlapping class valus
Code founders like this • Founders are identified as “orphaned” subjects. – Make sure you have the right gender • Save the file in the .csv format. – On the mac use “Windows CSV” option – Otherwise, “^L” is used to identify end of line
Fire up solar-eclipse

             Solar command starts the tcl shell with R-like interface

Solar inherits all bash commands, so “ls” gives listing of directory

   Lpa_pedi is the file we just created. Lpa_pheno doesn’t exist yet!
Load your pedigree
“Load pedi” command with the name of the file
Several new files will be created
SOLAR creates several internal files that re-arrange pedigree in computation
friendly format
Hint – phi2.gz is the kinship matrix in text format that can be used for other
packagesObtaining phenotypes
• DTI-FA values we calculated using ENIGMA-
DTI pipeline
– http://enigma.ini.usc.edu/protocols/dti-protocols/
– Average whole brain FA values were used
• LPA 1 and 2 levels were obtain from blood
– 12 hour fasting
– Measured using Cardio IQ™ Ion Mobility assay
• Unknown to me and hence presumed very accurateLets make a phenotype file
• Phenotypes are stored in a simple csv format
• Subject ID should match IDs in pedigree file
• Multiple phenotypes files can be loaded at once
and merged in memory
– Convenient for storing fixed factors such as sex
and age for the entire pedigree
• Load phenotype command is
– “load pheno file_name.csv”
– http://www.mdbrain.org//solareclipse/
solar_commd.html
– Type “pheno” to check that phenotypes were
loadedPhenotype file • Let put average FA values measured from DTI • Blood-levels of two LPA proteins LPA1 and LPA2 • Add sex and gender • Simple CSV format.
Load the phenotype file

Listing shows the phenotype file in the directory
                Load the phenotype file
   Check the loaded phenotypes using pheno command
Calculating heritability
• What is heritability?
Normally distributed trait: Average FA
σ2
Variance in Average FA
µVariance Decomposition
2 2 2
σ
p =
σ
g +
σe
2
σ
p =
Total phenotypic variance
2
σ
g =
Variance due to genetic sources
2
σ
e =
Variance due to environmental sourcesGenetic variance is due to
2 2 2
σ
g =
σ
a +
σd
2
σ
a =
Additive genetic variance
2
σ
d =
Dominance varianceAdditive genetic effect
Homozygote allele Heterozygote Homozygote allele
AA AB BB
Mean-a Mean Mean+a
heterozygote is half way between the two homozygotes,
Homozygote allele Homozygote allele
Heterozygote
AA AB BB
Mean-a Mean Mean+a
Dominant genetic effect: A dominates BAdditive genetic
(narrow sense) heritability
2
2 σ
a
h =
2
σ
p
Fraction of the total variance in a trait explained by additive genetic varianceHow to calculate it?
Identify the trait
Identify the covariates
Run polygenic command
Calculating sporadic model – just covariates
Calculating polygenic model –covariates + kinship
Polygenic function tests two GLM models based on their log-likelihood values
Sporadic model assumes no genetic effects (unitary kinship matrix)
Polygenic model assumes genetic effects (non-unitary kinship matrix)Output
Hmm, we have
a basic
statistical
problemDo the same to LPA1
Another basic
statistical problemWhat to do about it? • Both problems infer lack of normal distribution • Normality of the distribution has to be enforced for validity of measurements • Inorm function in solar does it – AverageFAINOR = inorm_AverageFA – LPA1INORM = inorm_LPA1 • Lets repeat!
Forcing normal distribution via inverse Gaussian transform.

                   LPA1        LPA1INORM
A-ha, inorm did the trick!
Do the same for LPA2
What do we have
Additive genetic variance explains
• 82% of FA variance
• 61% of the variance in LPA1 protein
• 72% of the variance in LPA2 protein
Now the important part.
• Is that variance shared between traits?
  – This would suggest common genetic or
    environmental cause
Perform genetic correlation
• Use genetic correlation (ρG)
• Pearson’s r decomposed into ρG and ρE
• ρG is the proportion of variability due to
shared genetic effects
– To calculate degree of shared genetic
varianceMultivariate Analysis in Solar
• Simply use more then one trait
– trait AverageFAINORM LPA1INORM
– covar age^1,2#sex
• Covaries effects of age, age^2, sex and age by sex
– Polygen –testrhoe –testrhog –testrhop
• –testrhoe calculates signficance of genetic
correlation
• –testrhog calculates signficance of enviormental
correlation
• –testrhop calculate signficance of the phenotypic
(combined) correlation
– Useful for calculating correlations in family samplesResults for FA and LPA1
Environmental correlation =
0.42
Genetic correlation = 0.38
Phenotypic correlation
= 0.38Results for FA and LPA2
What about LPA1 and LPA2

             Correlated unique
             environmental effects
What have we learned?
• FA has shared genetic variance with blood
volumes of two lipid messenger/receptors
• FA shows shared environmental variance
– Caused by factors like stress or diet
• The two LPA molecules are genetically
independent
– Encoded by different genes
– But show some common environmental
varianceContact (pkochunov@gmail.com)
• HCP researchers are running SOLAR-
Eclipse as a part of their analysis service
• https://hcpx-demo.humanconnectome.org/app/template/UnivariatePolygenic.vm
https://hcpx-demo.humanconnectome.org/app/template/GeneticCorrelation.vm
• Visit SOLAR-Eclipse workshop at Imaging
Genetic Conference
– http://www.imaginggenetics.uci.edu/
– 1/19-20, 2015/ Irvine California
– To learn how to use SE
• Voxel-wise genetic analysis
• Mega and Meta genetic analysisHuman Connectome Web SE https://hcpx-demo.humanconnectome.org/app/template/UnivariatePolygenic.vm
Human Connectome Web SE
Acknowledgements
• Collaborative effort of
   – John Blangero
   – Charles Peters
   – David Glahn
   – Tom Nichols
   – Bennett Landman
   – Neda Jahanshad
   – Paul Thompson
• Supported by EB015611, P01HL045522,
  R37MH059490, R01MH078111, R01MH0708143
  and R01MH083824
You can also read