INTERHEMISPHERIC RELATIONSHIP OF GENETIC INFLUENCE ON HUMAN BRAIN CONNECTIVITY - MPG.PURE
←
→
Page content transcription
If your browser does not render page correctly, please read the page content below
Cerebral Cortex, January 2021;31: 77–88

                                                                              doi: 10.1093/cercor/bhaa207
                                                                              Advance Access Publication Date: 14 August 2020
                                                                              Original Article

                                                                                                                                                      Downloaded from https://academic.oup.com/cercor/article/31/1/77/5892625 by Max-Planck-Institute for Psycholinguistics user on 02 February 2021
ORIGINAL ARTICLE

Interhemispheric Relationship of Genetic
Influence on Human Brain Connectivity
Suyu Zhong1 , Long Wei2 , Chenxi Zhao1 , Liyuan Yang1 , Zengru Di3 ,
Clyde Francks4,5 and Gaolang Gong1,6
1 StateKey Laboratory of Cognitive Neuroscience and Learning & IDG/McGovern Institute for Brain Research,
Beijing Normal University, Beijing 100875, China, 2 School of Computer Science and Technology, Shandong
Jianzhu University, Jinan, Shandong 250101, China, 3 School of Systems Science, Beijing Normal University,
Beijing 100875, China, 4 Language and Genetics Department, Max Planck Institute for Psycholinguistics, 6525
XD Nijmegen, The Netherlands, 5 Donders Institute for Brain, Cognition and Behavior, Radboud University,
6525 EN Nijmegen, The Netherlands and 6 Beijing Key Laboratory of Brain Imaging and Connectomics, Beijing
Normal University, Beijing 100875, China
Address correspondence to Dr Gaolang Gong, State Key Laboratory of Cognitive Neuroscience and Learning, Beijing Normal University, #19 Xinjiekouwai
Street, Beijing 100875, China. Email: gaolang.gong@bnu.edu.cn.
S.Z. and L.W. contributed equally to this work.

Abstract
To understand the origins of interhemispheric differences and commonalities/coupling in human brain wiring, it is crucial
to determine how homologous interregional connectivities of the left and right hemispheres are genetically determined and
related. To address this, in the present study, we analyzed human twin and pedigree samples with high-quality diffusion
magnetic resonance imaging tractography and estimated the heritability and genetic correlation of homologous left and
right white matter (WM) connections. The results showed that the heritability of WM connectivity was similar and coupled
between the 2 hemispheres and that the degree of overlap in genetic factors underlying homologous WM connectivity (i.e.,
interhemispheric genetic correlation) varied substantially across the human brain: from complete overlap to complete
nonoverlap. Particularly, the heritability was significantly stronger and the chance of interhemispheric complete overlap in
genetic factors was higher in subcortical WM connections than in cortical WM connections. In addition, the heritability and
interhemispheric genetic correlations were stronger for long-range connections than for short-range connections. These
findings highlight the determinants of the genetics underlying WM connectivity and its interhemispheric relationships,
and provide insight into genetic basis of WM connectivity asymmetries in both healthy and disease states.

Key words: brain asymmetry, genetic correlation, heritability, homology, WM connectivity

Introduction                                                                  other hand, the commonalities and coupling between the 2
The differences and commonalities between the 2 brain hemi-                   hemispheres are obvious: the left and right hemispheres largely
spheres are of general interest in neuroscience. By focusing on               mirror each other; the developmental and aging-related changes
interhemispheric differences, numerous studies have demon-                    that occur in homologous left and right brain structures are
strated the existence of structural asymmetries and functional                highly synchronized (Scott et al. 2012; Andescavage et al. 2016).
lateralization in various brain phenotypes (Toga and Thompson                    To understand the origin of interhemispheric differences
2003; Bishop 2013; Herve et al. 2013; Kong et al. 2018). On the               and commonalities/couplings, it is crucial to determine how

© The Author(s) 2020. Published by Oxford University Press. All rights reserved. For permissions, please e-mail: journals.permission@oup.com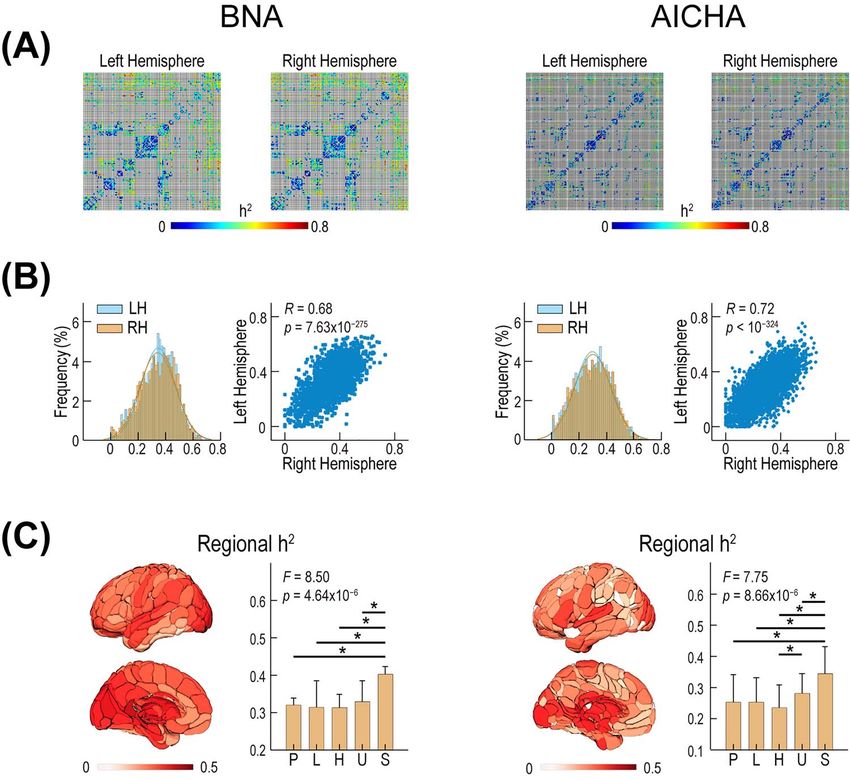
78     Cerebral Cortex, 2021, Vol. 31, No. 1

homologous left and right brain structures are genetically           Materials and Methods
related. This involves 2 related questions: 1) Are homologous
                                                                     Subjects
left and right brain structures affected to similar degrees by
genetic influences? 2) To what degree do overlapping genetic         The HCP dataset was used in this study (Van Essen et al. 2012). In
factors affect homologous left and right brain structures?           total, 930 healthy adults from the HCP S1200 release for whom
Neuroimaging findings have provided important clues to both          both diffusion and T1 images were available were included.
questions. Relevant to the first question, while a few studies       The included subjects aged 22–37 years old (28.7 ± 3.7 years; 426

                                                                                                                                           Downloaded from https://academic.oup.com/cercor/article/31/1/77/5892625 by Max-Planck-Institute for Psycholinguistics user on 02 February 2021
have reported that the degree of heritability of gray matter (GM)    males and 504 females). The zygosity and parental identities
morphometric phenotypes is stronger in the regions/lobes of          of the included individuals were confirmed by genomic data
one hemisphere than in the other hemisphere (Geschwind et al.        obtained using blood or saliva samples. The 930 HCP subjects
2002; Yoon et al. 2010), many other studies have concluded no        included 107 monozygotic twin pairs with their 77 siblings and
interhemispheric differences in heritability (Wright et al. 2002;    3 half-siblings, 54 dizygotic twin pairs with their 47 siblings and
Kremen et al. 2010; Eyler et al. 2014; Wen et al. 2016; Liu et al.   5 half-siblings, 356 siblings, 10 half-siblings, and 110 unrelated
2019). Regarding the second question, a number of studies have       individuals. All subjects provided written informed consent, and
applied analyses of genetic correlations to measure degrees          the research protocol was approved by the Institutional Review
of overlap in genetic factors between 2 phenotypes, and the          Board of Washington University.
majority of them have consistently shown that there is great
overlap in the genetic factors that underlie the various GM
                                                                     MRI Acquisition and Preprocessing
phenotypes of homologous left and right regions/lobes (Eyler
et al. 2014; Guadalupe et al. 2016; Kong et al. 2018; Liu et al.     MRIs were acquired using a Siemens Connectome Skyra 3 T
2019).                                                               scanner housed at Washington University in St. Louis. The
    However, the relevant findings in previous studies are limited   diffusion-weighted images (DWI) were collected using an HCP-
to GM phenotypes. Very few studies have focused on the genetic       specific variant of the multiband diffusion sequence. For the
relationships between homologous left and right white matter         diffusion images, 3 different gradient tables were used. Each
(WM) phenotypes, although the heritability of voxelwise or tract-    table was acquired once with right-to-left and left-to-right
wise WM imaging parameters, such as volume and fractional            phase-encoding polarities and included 90 diffusion-weighting
anisotropy, has been explored (Chiang et al. 2011; Kochunov          directions plus 6 b = 0 images interspersed throughout each
et al. 2014; Kochunov et al. 2015; Lee et al. 2015). Interregional   run. The DWI consisted of 3 shells of b = 1000, 2000 and
WM connectivity represents an intuitive measurement of the           3000 s/mm2 interspersed with an equal number of acquisitions
strength of anatomical connections between 2 GM regions of           on each shell within each run. The detailed parameters were as
interest and has been widely applied in the context of brain         follows: time repetition (TR) = 5520 ms, time echo (TE) = 89.5 ms,
connectome research (Gong et al. 2009; Sporns 2011; Sotiropou-       flip angle = 78◦ , refocusing flip angle = 160◦ , field of view
los and Zalesky 2019). Surprisingly, the genetics of this impor-     (FOV) = 210 × 180 mm2 , matrix = 168 × 144, slice thickness = 1.25
tant WM phenotype remain very poorly explored. As a con-             mm (111 slices), and multiband factor = 3. For T1 -weighted
sequence, the mechanisms by which the homologous left and            images, 256 slices per slab were acquired with a 3D magnetization-
right WM connectivities of the 2 hemispheres are genetically         prepared rapid gradient echo sequence as follows: TR = 2400 ms,
determined and related remain largely unknown. Understand-           TE = 2.14 ms, time to inversion = 1000 ms, flip angle = 8◦ ,
ing these particular genetics is a prerequisite for detangling       FOV = 224 × 224 mm2 , and resolution = 0.7 × 0.7 × 0.7 mm3 . DWI
the genetic basis of observed interhemispheric similarities and      and T1 -weighted images were preprocessed using the HCP
asymmetries in human brain connectivity and the human brain          minimal-preprocessing pipelines (Glasser et al. 2013).
connectome (Thompson et al. 2013; Zhong et al. 2017; Zhao et al.
2019b).
                                                                     Diffusion MRI-Based Tractography
    The present study sought to exclusively assess the genetics
of interregional WM connectivity with a focus on genetic             For each voxel, fiber orientation distributions (FODs) were
relationships between the 2 hemispheres. Given previous              estimated using multishell multitissue constrained spherical
findings related to GM phenotypes, we first hypothesized             deconvolution (Tournier et al. 2007; Jeurissen et al. 2014). Here,
that the heritability of homologous WM connectivity would            the single-fiber WM response function as well as the GM and
be similar between the 2 hemispheres and that the degree of          cerebrospinal fluid (CSF) response functions were estimated
overlap in genetic factors would be high between homologous          using the dhollander algorithm with a harmonic order of 8
left and right WM connections. Given that the functions of           (Dhollander et al., 2016). Whole-brain tractography was then
short- and long-range WM connections are putatively distinct         carried out in the individual-specific diffusion MRI space
at the system level (Kaiser and Hilgetag 2006; Betzel and            by using the second-order integration over fiber orientation
Bassett 2018), we further hypothesized that short- and long-         distributions (iFOD2) algorithm in the MRtrix3 package (Tournier
range WM connections differ in the heritability of phenotypes        et al. 2012; Tournier et al. 2019). To improve the biological
and interhemispheric genetic correlations. To test these             accuracy of fiber reconstruction during tracking, we used
hypotheses, we used diffusion magnetic resonance imaging             the anatomically constrained tractography (ACT) framework,
(MRI) acquisition of the Human Connectome Project (HCP)              in which anatomical prior information can be effectively
dataset to estimate the interregional WM connectivity of             considered (Smith et al. 2012). Here, the anatomical prior
∼ 1000 subjects and then applied twin and pedigree infor-            information was obtained by segmenting the T1 images. Given
mation to estimate the heritability of and genetic corre-            that the HCP preprocessed T1 images were well aligned with
lations between the homologous WM connections in both                the DWI, we did not need to coregister the 2 images for each
hemispheres.                                                         subject. Specifically, the T1 image was segmented into tissue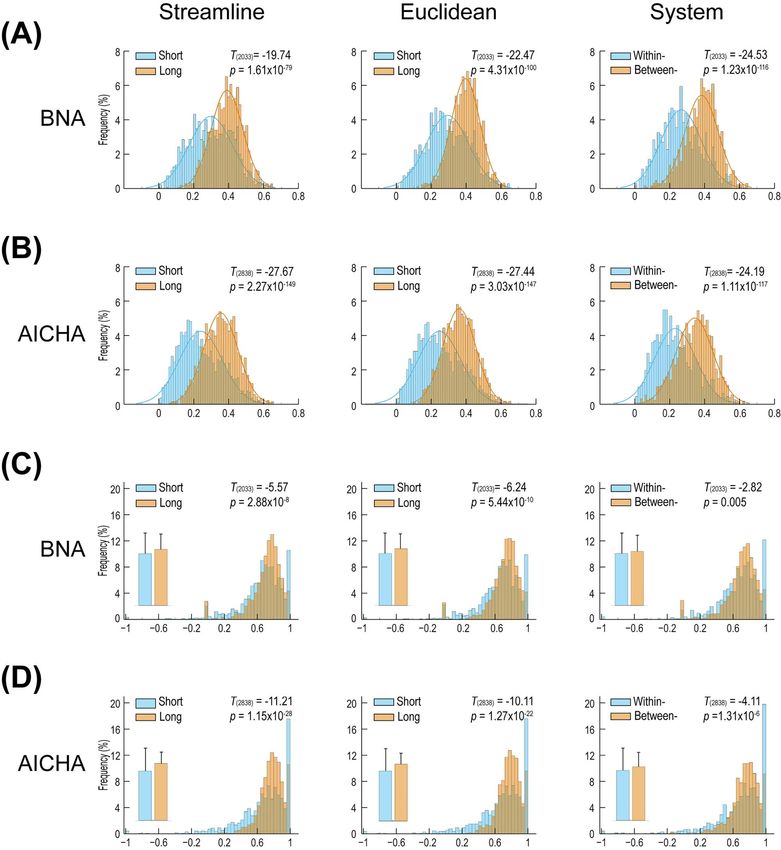
Genetic Relation between Hemispheric Connectivity Zhong et al.               79

partial volume maps (PVMs) of the brain WM, GM and CSF               definition of connection strength used in retrograde-tracer-
using FMRIB Software Library tools (Smith et al. 2004). The          based studies. Strong correlations between this diffusion
resultant PVM images were then taken as anatomical priors            MRI-derived measure and tracer-based connection strength
into the ACT framework. The detailed fiber-tracking parameters       have been verified in monkey brains (Donahue et al. 2016).
were as follows: step size = 0.625 mm, maximum curvature             Specifically, the FSe was calculated as the fraction of streamlines
per step = 45◦ , FOD amplitude threshold = 0.06, minimum             that linked 2 regions relative to the total number of streamlines
length = 2.5 mm, and maximum length = 250 mm. For each               extrinsic to those regions (Donahue et al. 2016; Zhao et al. 2019b).

                                                                                                                                            Downloaded from https://academic.oup.com/cercor/article/31/1/77/5892625 by Max-Planck-Institute for Psycholinguistics user on 02 February 2021
individual, 100 million streamlines were initially generated by
seeding randomly from the ACT-generated GM/WM interface,
                                                                     Short- and Long-Range Definitions of Interregional WM
and these streamlines were subsequently filtered to obtain
                                                                     Connections
10 million streamlines through the spherical-deconvolution
informed filtering of tractograms method. This postfiltering         For each interregional WM connection within a hemisphere,
process can effectively improve the quantitative nature of all       the length was estimated in 2 ways: 1) the mean length
reconstructed streamlines (Smith et al. 2013).                       of the tractogram-derived streamlines between the 2 linked
                                                                     BNA/AICHA regions across all subjects and 2) the Euclidean
                                                                     distance between the 2 linked BNA/AICHA regions on the
                                                                     atlas of the MNI space. For both methods, the length of
Interregional WM Connectivity                                        the homologous left and right WM connection was highly
Two atlases in the Montreal Neurological Institute (MNI) space       correlated (streamline-based, BNA: R = 0.93, P < 10−15 ; AICHA:
were applied to parcellate the entire GM into a set of regions.      R = 0.94, P < 10−15 ; Euclidean distance-based, BNA: R = 0.98,
The first was the Brainnetome atlas (BNA), which was derived         P < 10−15 ; AICHA: R = 0.99, P < 10−15 ), and we therefore averaged
from WM connectional information (Fan et al. 2016). Specifi-         the left and right measurements to obtain a single length
cally, this atlas includes 246 cerebral regions (210 cortical and    for each pair of homologous WM connections. To provide
36 subcortical GM regions, with half of each from each hemi-         a straightforward illustration of the effect of length on the
sphere), and the voxels within each parcellated region were          genetics of interregional WM connectivity, we used this single
considered putatively homogenous in terms of the whole-brain         length value to categorize all interregional WM connections into
WM connectional profile. The second was the atlas of intrinsic       1) short-range connections (length < mean of all connections) or
connectivity of homotopic areas (AICHA) (Joliot et al. 2015). This   2) long-range connections (length > mean of all connections).
particular functional atlas takes the regional homotopy between          Based on its linked BNA/AICHA regions, each WM connection
the 2 hemispheres into account when parcellating GM regions          was also categorized as anatomically within- or between-system
with resting-state functional connectivity. It includes 384 cere-    (7 classical anatomical systems were defined as follows: the
bral regions (340 cortical and 44 subcortical GM regions, with       frontal lobe, temporal lobe, partial lobe, occipital lobe, insular
half of each from each hemisphere). To obtain the BNA/AICHA          lobe, limbic system, and subcortical nuclei). This categorization
parcellation for each individual-specific diffusion MRI space,       was taken as another indirect approach to define the length
the MNI-to-T1 nonlinear transformations derived from the HCP         of WM connections, with within- and between-system con-
minimal-preprocessing pipelines were applied to the original         nections corresponding to short- and long-range connections,
BNA/AICHA of the MNI space.                                          respectively.
    For each individual, the interregional WM streamlines
connecting each pair of BNA or AICHA regions within each             Quantitative Genetic Estimation and Statistical Analysis
hemisphere were determined using the whole-brain tractogram
described above (Fig. 1). Each streamline was assigned to the        In the present study, we mainly focused on 2 types of genetic
closest region within a sphere with a 2-mm radius centered at its    estimation: 1) the heritability of WM connectivities and 2) the
endpoint, and the set of streamlines linking each BNA or AICHA       genetic correlations between the homologous left and right WM
regional pair was then derived from the tractogram (Tournier         connectivities of the 2 hemispheres.
et al. 2012, 2019). Given the large-scale nature of BNA/AICHA
regions, it is plausible to assume a consistent yes–no pattern       Heritability
for the existence of fibers between each pair of regions across      For any phenotype, heritability represents the proportion of
all subjects. The observation of streamlines linking a particular    phenotypic variance that can be explained by genetic variance
pair of regions in only a portion of subjects was likely to be       among individuals within a population and is typically referred
spurious (e.g., due to noisy data and algorithm errors), and         to as h2 . For each WM connection (BNA: 2035 connections in total
these streamlines were therefore discarded in those subjects         for each hemisphere; AICHA: 2840 connections in total for each
(Zhao et al. 2019b). This is equivalent to applying a threshold      hemisphere), h2 was estimated after controlling for age, sex, and
of 100% to the subject proportion of nonzero connections for         hemispheric intracranial volume (ICV). Here, we controlled for
every 2 regions. A set of WM connections was then obtained           the hemispheric ICV because this highly heritable trait showed
for each atlas (BNA connections: 2467 for the left and 2313 for      a strong association with WM connectivity and therefore may
the right; AICHA connections: 3351 for the left and 3457 for         confound our genetic estimation for WM connectivity (Hänggi
the right). Furthermore, to ensure comparability between the 2       et al. 2014; Jansen et al. 2015). To determine whether the her-
hemispheres, we confined our analysis to interregional WM            itability of the left WM connectivity is significantly different
connections found in both hemispheres (BNA: 2035 within-             from that of its homologous right WM connectivity, we used a
hemispheric connections; AICHA: 2840 within-hemispheric              confidence interval (CI)-based approach. Specifically, under the
connections). For each of the interregional WM connection,           asymptotic normality assumption of the maximum likelihood
the strength/weight (i.e., WM connectivity) was defined as           estimator, the CI at 100 (1−α)% for the estimated heritabil-
the fraction of streamlines (FSe), which is analogous to the         ity is [h2 − Z(α/2) × σ , h2 + Z(α/2) × σ ], where σ is the standard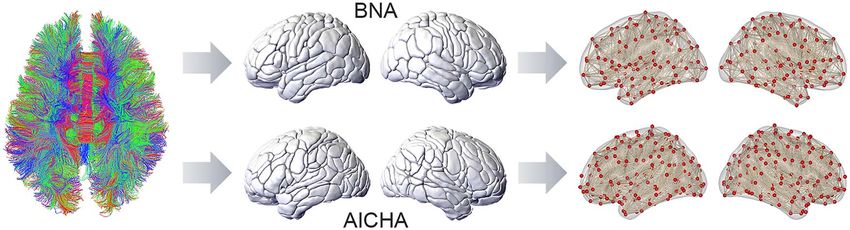
80 Cerebral Cortex, 2021, Vol. 31, No. 1
Downloaded from https://academic.oup.com/cercor/article/31/1/77/5892625 by Max-Planck-Institute for Psycholinguistics user on 02 February 2021
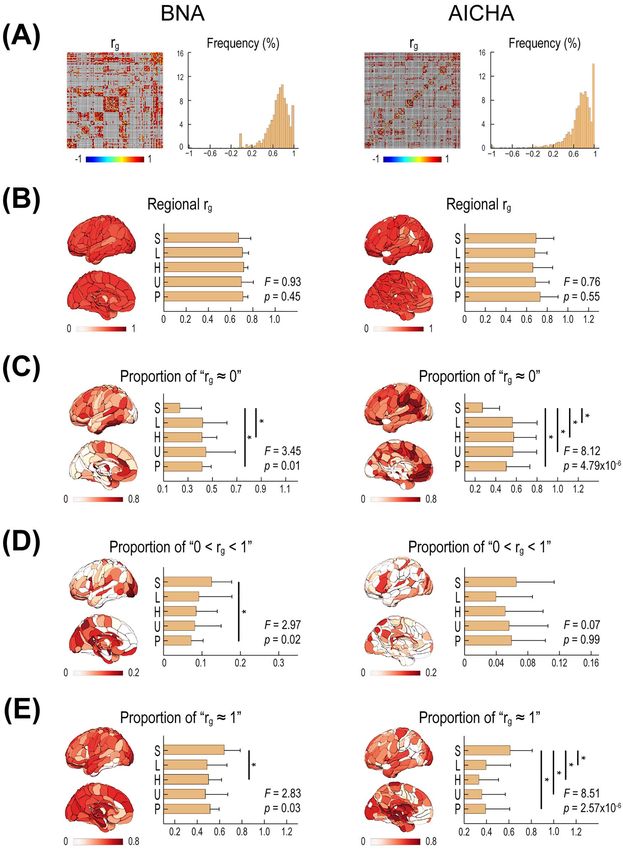
Figure 1. Schematic overview of the extraction of interregional WM connections. Whole-brain tracts were first estimated using diffusion MRI-based tractography. Two
atlases were applied to parcellate the entire cerebral GM into a set of regions: BNA, the Brainnetome atlas (Fan et al. 2016), and AICHA (Joliot et al. 2015).
error of the estimated heritability (Neale and Miller 1997). For 2 significantly Z(α/2) × (σ right + σ left ) (Eyler et al. 2014; Le Guen was set as the significance level. Given the approximate nature
et al. 2018). of the statistical results, this 5-level stratification scheme for rg
should be considered exploratory.
Genetic Correlation To locate the distribution of the genetic influences, we pro-
To estimate the degree of overlap in genetic factors underlie jected the genetic-relevant values (i.e., h2 value and rg value)
homologous WM connectivity in the 2 hemispheres, we cal- of WM connections to its linked regions and then averaged all
culated the genetic correlation coefficient (rg ) for each pair of projected values for each region. The resultant regional genetic
homologous WM connections (BNA: 2035 connection pairs in measure represents the mean degree of the genetic influences of
total; AICHA: 2840 connection pairs in total). Specifically, the all WM connections between this region and all other connected
rg between 2 phenotypes is defined as the genetic covariance regions. For each rg stratification (i.e., rg ≈ −1, −1 < rg < 0, rg ≈ 0,
divided by the square root of the product of their separate 0 < rg < 1, or rg ≈ 1) based on the statistical significance, we calcu-
genetic variances (Neale and Cardon 1992). The rg value ranges lated the proportion of the rg -related connections out of all WM
from −1 to 1, and positive and negative values indicate the same connections for each region. To determine whether there were
or opposite functioning direction, respectively, of overlapped differences of genetic influences among functional hierarchy,
genetic factors to the 2 phenotypes. In this equation, rg = 1 or −1 we classified all BNA/AICHA regions into 5 classes according
indicates that genetic factors show complete overlap between to the Mesulam’s functional hierarchy scheme (Mesulam 1998),
the 2 phenotypes, whereas rg = 0 indicates a complete lack of and one-way analysis of variance (ANOVA) was performed. The 5
overlap in genetic factors between the 2 phenotypes (Almasy functional hierarchies are the primary cortex, unimodal associ-
et al. 1997). In the present study, the rg for each pair of homol- ation cortex, heteromodal association cortex, paralimbic/limbic
ogous WM connections was calculated after controlling for age cortex, and subcortical nuclei.
and sex.
All these genetic estimations were carried out using the
Sequential Oligogenic Linkage Analysis Routines (SOLAR) pack- Results
age (http://www.nitrc.org/projects/se_linux). All 930 HCP sub-
The Heritability of WM Connectivity
jects were included in these genetic estimations. Given the
in the 2 Hemispheres
lack of detailed common environmental information for the
HCP cohort, the additive genetics and unique environment (AE) As illustrated in Figure 2A, the h2 values of WM connectivity
model (i.e., the default model of the SOLAR) was used for both h2 between the hemispheres showed a great deal of variation.
and rg estimation. Inverse Gaussian normalization was applied The spatial patterns of the 2 hemispheres appeared quite sim-
to ensure the normality of WM connectivity due to the high sen- ilar. Specifically, the range of h2 values was ∼0–0.7 for both
sitivity of SOLAR estimation to skewed distributions. To estimate hemispheres, and left and right h2 values were strongly corre-
the relative importance of familial and environmental effects lated with each other across all WM connections (BNA: R = 0.68,
on a phenotype, maximum likelihood variance-decomposition P = 7.63 × 10−275 , AICHA: R = 0.72, P < 1.0 × 10−324 ; Fig. 2B). Further-
methods were applied, with the covariance among family mem- more, a statistical comparison showed there was no signifi-
bers modeled as a function of genetic proximity (Almasy and cant difference between the left and right h2 values for any
Blangero 1998). Notably, the h2 and rg values were re-estimated pair of homologous WM connectivities in either BNA or AICHA
in the SOLAR without controlling for any covariates (i.e., age, (corrected P > 0.05).
gender, and hemispheric ICV), and extremely similar values Given the tight coupling or similarity in heritability that was
were obtained (BNA: left h2 , R = 0.99; right h2 , R = 0.99; rg , R = 0.96; observed between homologous left and right WM connectivities,
AICHA: left h2 , R = 0.99; right h2 , R = 0.99; rg , R = 0.96). we averaged the left and right h2 values for each pair of homol-
The resultant rg was then statistically compared with 0, 1, or ogous WM connections. To locate the distribution of these h2
−1. Accordingly, all rg values were stratified into 1) not signifi- values, we projected the h2 value of WM connections to its linked
cantly different from 0, referred to as rg ≈ 0; 2) significantly larger regions and then averaged all projected h2 values for each region.
than 0 and significantly smaller than 1, referred to as 0 < rg < 1; The resultant region-specific h2 value was taken to represent
3) not significantly different from 1, referred to as rg ≈ 1; 4) the mean heritability of WM connections between this regionGenetic Relation between Hemispheric Connectivity Zhong et al. 81
Downloaded from https://academic.oup.com/cercor/article/31/1/77/5892625 by Max-Planck-Institute for Psycholinguistics user on 02 February 2021
Figure 2. The heritability (h2 ) of interregional WM connectivity in the 2 hemispheres. (A) The h2 matrices of interregional WM connectivity. Each row or column
represents one BNA/AICHA region. (B) The histogram and interhemispheric scatter plot of the homologous left and right h2 . (C) The regional mean h2 map. The 5
classes (bars), according to Mesulam’s functional hierarchy scheme (Mesulam 1998). P: primary cortex; U: unimodal association cortex; H: heteromodal association
cortex; L: limbic/paralimbic cortex; S: subcortical nuclei.
and all other connected regions. The whole-brain h2 maps for of AICHA connections were statistically stratified as rg ≈ 1, that
both BNA and AICHA regions are illustrated in Figure 2C, which is, showing a complete overlap of genetic factors underlying the
shows that overall h2 values were higher (i.e., darker red) for homologous left and right WM connectivity. In contrast, 35.1%
subcortical nuclei than for cortical regions. Statistical compar- of the pairs of BNA connections and 46.4% of the pairs of AICHA
ison (ANOVA) further revealed there was a significant differ- connections were statistically stratified as rg ≈ 0, indicating a
ence in regional h2 values among the 5 Mesulam’s functional complete lack of overlap in genetic factors between the left and
classes (BNA: F(4,118) = 8.5, P = 4.64 × 10⁻⁶ ; AICHA: F(4,182) = 7.75, right WM connectivity. All remaining pairs of WM connections
P = 8.66 × 10⁻⁶ ; ANOVA; Fig. 2C). Post hoc analysis of both the BNA (10% of paired BNA connections and 6.3% of paired AICHA
and the AICHA consistently showed that the regional h2 val- connections) were statistically stratified as 0 < rg < 1, indicating
ues were relatively higher in subcortical nuclei than in cortical a partial overlap in genetic factors. No connection pair in either
classes. This indicates that WM connections originating from the BNA or AICHA was statistically stratified as −1 < rg < 0 or
subcortical nuclei are more genetically controlled than the ones rg ≈ −1. Clearly, both complete overlap and complete nonoverlap
originating from cortical regions. For both atlases, there was no in the genetic factors that influence underlying homologous left
consistent difference in regional h2 values among the 4 cortical and right WM connectivities are common patterns across the
classes (Fig. 2C). human brain.
To determine the rg distribution, we also projected the rg val-
ues of all WM connections to their connected regions to obtain a
Genetic Correlations between Homologous Left
mean rg value for each region. As shown in Figure 3B, the whole-
and Right WM Connectivities
brain rg maps exhibited a low level of variation between regions
Figure 3A illustrates the genetic correlations (rg ) of all homolo- for both the BNA and the AICHA, and there was no significant
gous pairs of WM connections. The estimated rg values ranged difference among the 5 classes designated according to func-
from −1 and 1 and showed a great deal of variation. All pairs tional hierarchy (BNA: F(4,118) = 0.93; P = 0.45; AICHA: F(4,182) = 0.76,
of WM connections were then stratified into 5 levels based on P = 0.55; ANOVA; Fig. 3B).
statistical significance rather than raw rg values. Specifically, For each region, we further calculated the proportion
54.9% of the pairs of BNA connections and 47.3% of the pairs of connections statistically stratified as rg ≈ 1, 0 < rg < 1, or82 Cerebral Cortex, 2021, Vol. 31, No. 1
Downloaded from https://academic.oup.com/cercor/article/31/1/77/5892625 by Max-Planck-Institute for Psycholinguistics user on 02 February 2021
Figure 3. The genetic correlations (rg ) between homologous left and right WM connectivities of the 2 hemispheres. (A) The rg matrices and histogram of interregional
WM connectivities. Each row or column of the matrix represents one BNA/AICHI region. (B) The regional rg map. (C) The regional map of the proportion of connections
statistically stratified as rg ≈ 0. (D) The regional map of the proportion of connections statistically stratified as 0 < rg < 1. (E) The regional map of the proportion of
connections statistically stratified as rg ≈ 1. The 5 classes (bars) were defined according to Mesulam’s functional hierarchy scheme (Mesulam 1998).Genetic Relation between Hemispheric Connectivity Zhong et al. 83
rg ≈ 0 out of all WM connections of the region (Fig. 3C– (for both atlases and both length definitions, all T ≤ −15.17,
E). Interestingly, there was a significant difference in the all P ≤ 4.58 × 10−50 ; degree of freedom: 2032 for BNA, 2837 for
proportions of connections statistically stratified as rg ≈ 1 and AICHA). For both short- and long-range connections, we also
rg ≈ 0 among the 5 classes separated according to functional found that the proportion of connections statistically stratified
hierarchy (as shown in Fig. 3C, rg ≈ 0: BNA, F(4,118) = 3.45, P = 0.01; as rg ≈ 1 was significantly higher and the proportion of con-
AICHA, F(4,182) = 8.12, P = 4.79 × 10⁻⁶ ; as shown in Fig. 3E, rg ≈ 1: nections statistically stratified as rg ≈ 0 lower for subcortical
BNA, F(4,118) = 2.83, P = 0.03; AICHA, F(4,182) = 8.51, P = 2.57 × 10⁻⁶ ; nuclei (all χ 2 ≥ 11.71, all P ≤ 0.0029). Thus, the h2 - and rg -related
Downloaded from https://academic.oup.com/cercor/article/31/1/77/5892625 by Max-Planck-Institute for Psycholinguistics user on 02 February 2021
ANOVA). Specifically, compared with cortical regions, subcor- differences between subcortical and within-cortical connections
tical nuclei had a higher proportion of connections stratified cannot simply be attributed to the length effect on these mea-
as rg ≈ 1 but a lower proportion of connections stratified as sures.
rg ≈ 0. Regarding the proportion of connections stratified as We next assessed whether there are also significant length
0 < rg < 1, they were significantly different only for the BNA but effects on h2 and rg when considering subcortical connections
not for the AICHA (as shown in Fig. 3D, BNA, F(4,118) = 2.97, P = 0.02; alone or within-cortical connections alone. The relevant results
AICHA, F(4,182) = 0.07, P = 0.99; ANOVA). These results collectively are summarized in Supplementary Figures S1 and S2, and the
indicate that homologous left and right WM connections vast majority of the length effects (i.e., higher h2 and rg values
from subcortical nuclei were more likely to have completely and the proportion of connections statistically stratified as rg ≈ 1
overlapping patterns of genetic factors and less likely to have a for long-range connections) remained in either subcortical con-
nonoverlapping pattern of genetic factors. Notably, the observed nections only or within-cortical connections only. This result
significant results for the proportion of stratified connections implies that there is a general length effect on the genetics
contrasted with the negative results for the raw rg values of WM connectivity across the connection sets of the entire
above, suggesting that the 2 measures capture related but hemisphere, the subcortical system, and the cortical system.
distinct aspects of genetic correlation between homologous WM Finally, to evaluate the reproducibility of our results, we
connectivity. reran the main analyses using split-half samples. Specifically,
all 930 HCP subjects were randomly divided into 2 subsamples
that were matched in the number of monozygotic twins. The 2
Effect of Connectional Length on Heritability
subsamples (each subsample: 465 subjects) yielded highly repro-
and Interhemispheric Genetic Correlations
ducible results that were similar to our key findings achieved
All pairs of homologous left and right WM connections were when using the full HCP samples, as described above. All split-
categorized as short- or long-range based on the streamline half results are included in the Supplementary Materials.
length (BNA, 947/1088 short-/long-range connections; AICHA,
1430/1410 short-/long-range connections) and Euclidean dis-
tance (BNA, 1067/968 short-/long-range connections; AICHA, Discussion
1598/1242 short-/long-range connections). In addition, anatomi- In the present study, we use human twin and pedigree models to
cally within-system (i.e., short-range) and between-system (i.e., reveal, for the first time, the patterns of heritability and genetic
long-range) connections were adopted as additional criteria correlations of the homologous interregional WM connectivities
for categorizing connections (BNA, 704/1331 within-/between- of the 2 hemispheres. Our results demonstrate that the heritabil-
system connections; AICHA, 1112/1728 within-/between-system ity of WM connectivities was quite similar and coupled between
connections). Across the 3 short-/long-range criteria, long- the 2 hemispheres and that both complete overlap and complete
range connections consistently had significantly higher h2 nonoverlap in the genetic factors underlying homologous left
and rg values than were found for short-range connections and right WM connectivities are common across the human
(Fig. 4A and B, h2 : all P < = 1.61 × 10−79 ; Fig. 4C and D, rg : all brain. The degree of heritability was significantly higher and
P < = 0.005, degree of freedom: 2033 for BNA, 2838 for AICHA). the chance of interhemispheric complete overlap in genetic
In line with these rg value-related results, the proportions factors was higher in subcortical WM connections than in cor-
of connections statistically stratified as rg ≈ 1, 0 < rg < 1, and tical WM connections. In particular, there were length effects
rg ≈ 0 were significantly different between long- and short- on the genetics of homologous left and right WM connectivity,
range connections (χ 2 test: all P ≤ 3.41 × 10−60 ), with long- with heritability higher and interhemispheric genetic correla-
range connections having a higher proportion of connections tions stronger for long-range connections than for short-range
statistically stratified as rg ≈ 1 and a lower proportion of connections.
connections statistically stratified as rg ≈ 0. Moreover, we Importantly, the present study used 2 distinct atlases that
compared the longest 500 connections with the shortest 500 were derived using WM connectivity (BNA) and resting-state
connections and found the same significant results (data not functional connectivity profiles (AICHA), respectively. While the
shown). Notably, the effect size of the observed length effect BNA is theoretically more suitable than AICHA for our study, the
was remarkably large for heritability but relatively small for results from both atlases are highly reproducible, indicating the
genetic correlations (Fig. 4). robustness and generalizability of our findings.
It is possible that these length effects are relevant to or
simply responsible for the above-observed higher h2 values and
Genetic Relationships between Homologous Left
the proportion of connections statistically stratified as rg ≈ 1
and Right WM Connectivities
of subcortical nuclei. To evaluate this possibility, we compared
these measures between connections originating from subcor- Many previous studies have shown that there is no difference
tical nuclei (referred to as subcortical connections) and con- in heritability between the 2 hemispheres (Wright et al. 2002;
nections between cortical regions (referred to as within-cortical Eyler et al. 2011a; Eyler et al. 2014; Wen et al. 2016; Liu et al.
connections) after controlling for connectional length. Higher 2019; Zhao et al. 2019a), whereas a few others have contrast-
h2 remained significantly higher for subcortical connections ingly reported finding hemispheric differences in heritability84 Cerebral Cortex, 2021, Vol. 31, No. 1
Downloaded from https://academic.oup.com/cercor/article/31/1/77/5892625 by Max-Planck-Institute for Psycholinguistics user on 02 February 2021
Figure 4. The difference in heritability (h2 ) and interhemispheric genetic correlations (rg ) between short- and long-range connections. (A) The mean h2 of homologous
left and right WM connectivities for short- and long-range connections of the BNA. (B) The mean h2 of homologous left and right WM connectivities for short- and
long-range connections of the AICHA. (C) The rg for short- and long-range connections of the BNA. (D) The rg for short- and long-range connections of the AICHA. The
3 columns represent the categorization of short- and long-range connections based on streamline length, Euclidean distance, and anatomical system, respectively.
(Thompson et al. 2001; Geschwind et al. 2002; Yoon et al. 2010). previous studies, which have mostly explored GM phenotypes,
Notably, the reported hemispheric differences in heritability thus providing joint support for general bilateral similarities in
were found in studies with very small sample sizes or a lack of heritability for human brain structural phenotypes.
statistical tests to identify such a difference, as summarized by In addition to the paired homologous WM connections of
Eyler and colleagues (Eyler et al. 2014). Our observed result of the 2 hemispheres, we estimated the heritability of connections
indistinguishable heritability for any pair of homologous left and that exist only in one hemisphere. These connections manifest
right WM connections is complementary to those presented in comparable heritability with the homologous WM connectionGenetic Relation between Hemispheric Connectivity Zhong et al. 85
pairs, and reflect certain degree phenotypic laterality of WM subcortical system: 1) Subcortical nuclei are evolutionarily more
connectivity. Intriguingly, we observed higher heritability of ancient and conserved (Satizabal et al. 2019) and 2) Neurogenesis
cross-hemispheric connections, relative to within-hemispheric and development occur earlier in subcortical nuclei than in the
connections (see Supplementary Materials). The genetics cerebral neocortex (Van Essen et al. 2018). Regarding genetic cor-
underlying the nonpaired WM connections warrants further relation, Wen and colleagues recently found that GM structures
investigation. within the cortical or subcortical systems are genetically clus-
Notably, similar bilateral heritability does not necessarily tered together, supporting that distinct genetic factors underlie
Downloaded from https://academic.oup.com/cercor/article/31/1/77/5892625 by Max-Planck-Institute for Psycholinguistics user on 02 February 2021
mean that similar genetic factors underlie homologous left and the development of these 2 cerebral systems (Wen et al. 2016).
right WM connectivities. To quantify the degree to which genetic As a further step, we observed that the chance of interhemi-
factors overlap between 2 phenotypes, one could estimate spheric complete overlap in genetic factors (i.e., rg = 1) was
the genetic correlation (Carey 1988). In previous studies that higher for subcortical WM connections, indicating that genetic
measured the genetic correlations in various GM phenotypes coupling is stronger for the bilateral subcortical systems of the
between regions, the homologous regions in the 2 hemispheres 2 hemispheres than for bilateral cortical systems. Notably, this
have always shown very strong genetic correlations (Eyler et al. observation is based on the proportion of connections that is
2011b; Chen et al. 2012; Chen et al. 2013; Eyler et al. 2014; stratified using the statistical significance of genetic correlation,
Wen et al. 2016; Liu et al. 2019), suggesting that the genetic and direct comparison on genetic correlation did not show a
factors underlying individual differences in one hemisphere significant difference.
overlap with those that influence the other hemisphere. In line Given the extensively described evolutionary and functional
with these findings related to GM phenotypes, we observed differences between the primary/limbic/paralimbic and asso-
that >50% of pairs of left and right WM connections were ciation cortices (Sousa et al. 2017; Van Essen et al. 2018), it
statistically indistinguishable from a genetic correlation = 1, is plausible to expect that there would be genetic differences
which indicates that identical genetic factors underlie the between these cortical systems. Our results, however, do not
development of the homologous left and right connections. This show such a difference in either heritability or interhemispheric
overlap in genetic factors underlying homologous left and right genetic correlations. This might be related to the small effect
WM connections likely contributes to the bilateral abnormalities size of these genetic measures between these cortical subsys-
in hemispheric WM connections observed in patients with tems. Alternatively, it is also possible that WM connectivity is
congenital genetic deficits (Ganou and Grouios 2008; Zhao et al. simply unaffected by genetic differences between these cortical
2019b). In addition, the synchronized growth or degeneration of subsystems.
WM in the 2 hemispheres might partially be attributed to this
genetic overlap.
Length Effects on the Genetics of Homologous Left
However, a substantial proportion of connection pairs
and Right WM Connectivity
were significantly different from a genetic correlation = 1,
suggesting that substantially unique or different genetic factors Length is an important characteristic of WM connections (Kaiser
influence the development of homologous left and right WM 2017). WM connections with different lengths are nonrandomly
connectivities. In fact, previous GM-related studies have also distributed across the entire brain, and connectivity strength
shown that the left–right genetic correlations of particular has an exponentially negative relationship with length (Erc-
regions are significantly different from 1 (Guadalupe et al. 2016; sey-Ravasz et al. 2013). In contrast to short-range connections,
Kong et al. 2018). Unexpectedly, the majority of these pairs of long-range connections are costly in terms of the consump-
WM connections between the 2 hemispheres are statistically tion of physical space and energy (Bullmore and Sporns 2012).
indistinguishable from a genetic correlation = 0, indicating However, it has been proposed that long-range connections are
a complete lack of overlap in underlying genetic factors necessary within brain networks to increase communicating
and a strong genetic asymmetry. For trait pairs, there is no efficiency because they reduce the number of processing paths
predictable relation between genetic correlation and phenotypic between areas (Sporns and Zwi 2004; Kaiser and Hilgetag 2006)
correlation, for example, a stronger genetic correlation does not or enhance the diversity of inputs and outputs of brain areas,
necessarily indicate a stronger phenotypic correlation, and vice thereby supporting complex brain dynamics (Betzel and Bassett
versa. Empirically, however, our data revealed a significantly 2018). The differences observed in this study in the heritability
positive correlation between genetic correlation and phenotypic and interhemispheric genetic correlations between short- and
correlation across homologous connectivity pairs (r = 0.53). This long-range WM connections provide strong genetic support for
observation deserves exclusive investigation in the future. the proposed system-level functional distinction between them.
Specifically, long-range WM connections showed a stronger
degree of genetic control and more overlap in genetic factors
Genetic Differences between Subcortical
between the 2 hemispheres. This pattern is compatible with the
and Cortical WM Connectivity
putative role of long-range connections as the predetermined
In terms of heritability and interhemispheric genetic correla- backbones of brain networks (Kaiser 2017). Accordingly, environ-
tions, we show that WM connections belonging to the subcorti- mental and experience-related factors can be inferred to have
cal and cortical systems are genetically different, a finding that stronger impacts on short-range connections, implying that
cannot simply be attributed to the observed length effect. The these connections have more developmental plasticity. Compat-
higher heritability of subcortical WM connectivity is consistent ibly with this, development of fiber myelination was reported
with the previously reported higher heritability of subcortical later for short-range tracts (Giedd et al., 1999; Ouyang et al.,
GM volume relative to cortical GM volume (Blokland et al. 2012; 2017), and later-developing brain structures are putatively more
van der Lee et al. 2017), and these findings jointly imply that environmentally influenced (Lohmann et al., 1999; Brun et al.,
there is stronger genetic control of subcortical system. Notably, 2009). This heritability difference may also relate to distinct
this observation is compatible with classical notions of the abnormalities of long and short connections in brain diseases86 Cerebral Cortex, 2021, Vol. 31, No. 1
(e.g., autism and schizophrenia) (Nazeri et al. 2013; Ameis and Central Universities. C.F. was funded by the Max Planck Society
Catani 2015). (Germany).
Finally, the findings presented in our present study provide
general insight into the origin of interhemispheric differences
and coupling between left and right WM connectivities. For Notes
instance, if there is a strong interhemispheric genetic correla-
Data were provided by the Human Connectome Project, WU-
tion for a particular phenotype, it suggests low heritability for
Minn Consortium (Principal Investigators: David Van Essen and
Downloaded from https://academic.oup.com/cercor/article/31/1/77/5892625 by Max-Planck-Institute for Psycholinguistics user on 02 February 2021
asymmetry (Eyler et al. 2014). Accordingly, those WM connec-
Kamil Ugurbil; 1U54MH091657) funded by the 16 National Insti-
tions with strong interhemispheric genetic correlations should
tutes of Health and Centers that support the National Insti-
have a low degree of heritability for asymmetries, in agreement
tutes of Health Blueprint for Neuroscience Research and by
with repeated reports showing zero-to-modest heritability val-
the McDonnell Center for Systems Neuroscience at Washington
ues for various brain asymmetries (Francks 2015). Specifically,
University. Conflict of Interest: None declared.
given the higher genetic correlations of subcortical WM connec-
tions or long-range WM connections, asymmetries in these con-
nections should therefore be statistically less heritable, implying
environmental factors and postnatal experiences play a domi-
References
nant role in the asymmetries of these connections. In addition, Almasy L, Dyer TD, Blangero J. 1997. Bivariate quantitative
the genetic contribution to observed phenotypic correlations for trait linkage analysis: pleiotropy versus co-incident linkages.
any 2 phenotypes is the product of their genetic correlation and Genet Epidemiol. 14:953–958.
both of their degrees of heritability; hence, phenotypic inter- Almasy L, Blangero J. 1998. Multipoint quantitative-trait linkage
hemispheric correlations/couplings in subcortical WM connec- analysis in general pedigrees. Am J Hum Genet. 62:1198–1211.
tions or long-range WM connections that are observed across Ameis SH, Catani M. 2015. Altered white matter connectivity as
individuals should be largely attributed to underlying genetic a neural substrate for social impairment in autism Spectrum
factors, given that these connections have both higher heri- disorder. Cortex. 62:158–181.
tability and strong genetic correlations. These implications are Andescavage NN, du Plessis A, McCarter R, Serag A, Evangelou I,
informative for interpreting results regarding the asymmetries Vezina G, Robertson R, Limperopoulos C. 2016. Complex tra-
or covariation of WM connectivities in both healthy and disease jectories of brain development in the healthy human fetus.
states, and could inspire new investigations along this line. Cereb Cortex. 27:5274–5283.
Betzel RF, Bassett DS. 2018. Specificity and robustness of long-
distance connections in weighted, interareal connectomes.
Limitations Proc Natl Acad Sci U S A. 115:E4880–E4889.
There are several caveats to the present study. First, our cur- Bishop DV. 2013. Cerebral asymmetry and language develop-
rent analyses are confined to WM connectivity, and the analy- ment: cause, correlate, or consequence? Science. 340:1230531.
sis framework can be directly applied to reveal the interhemi- Blokland GA, de Zubicaray GI, McMahon KL, Wright MJ. 2012.
spheric genetic relation of functional connectivity in the future. Genetic and environmental influences on neuroimaging
Particularly, our observed interhemispheric genetic relations phenotypes: a meta-analytical perspective on twin imaging
represent system-level patterns across the entire hemisphere, studies. Twin Res Hum Genet. 15:351–371.
and they should not be simply generalized to individual WM Brun CC, Leporé N, Pennec X, Lee AD, Barysheva M, Mad-
connections (e.g., one cannot conclude that all long/subcortical sen SK, Avedissian C, Chou YY, de Zubicaray GI, McMahon
connections have strong heritability and genetic correlations). KL, et al. 2009. Mapping the regional influence of genetics
Next, our findings are based on data of the young adult HCP on brain structure variability–a tensor-based morphometry
cohort, in which the actual sample size of twins is moderate. Our study. Neuroimage. 48:37–49.
results therefore need to be further verified using a completely Bullmore E, Sporns O. 2012. The economy of brain network
independent data set with a larger number of twins. Given organization. Nat Rev Neurosci. 13:336–349.
the previously reported age dependence of the heritability of Carey G. 1988. Inference about genetic correlations. Behav Genet.
various brain phenotypes (Blokland et al. 2012; Schmitt et al. 18:329–338.
2014; Jansen et al. 2015), caution should also be exercised when Chen C-H, Gutierrez ED, Thompson W, Panizzon MS, Jernigan
extrapolating our findings across the lifespan. Finally, consider- TL, Eyler LT, Fennema-Notestine C, Jak AJ, Neale MC, Franz
ing the inability of our diffusion tractography to accommodate CE, et al. 2012. Hierarchical genetic organization of human
for strong geometric complexity within voxels, the tractography- cortical surface area. Science. 335:1634–1636.
based connectivity metrics decline especially within the voxels Chen C-H, Fiecas M, Gutiérrez ED, Panizzon MS, Eyler LT,
near the cortex. Thus, these connectivity measures, especially Vuoksimaa E, Thompson WK, Fennema-Notestine C, Hagler
near the cortex, should be viewed with degree of uncertainty. DJ Jr, Jernigan TL, et al. 2013. Genetic topography of brain
morphology. Proc Natl Acad Sci U S A. 110:17089–17094.
Chiang M-C, McMahon KL, de Zubicaray GI, Martin NG, Hickie I,
Supplementary Material Toga AW, Wright MJ, Thompson PM. 2011. Genetics of white
Supplementary material is available at Cerebral Cortex online. matter development: a DTI study of 705 twins and their
siblings aged 12 to 29. Neuroimage. 54:2308–2317.
Dhollander T, Raffelt D, Connelly A. 2016. Unsupervised 3-tissue
Funding response function estimation from single-shell or multi-shell
National Science Foundation of China (81671772, 91732101 to diffusion MR data without a co-registered T1 image. In: Pro-
G.G., 81701783 to S.Z.), the Research Fund of PLA of China ceedings of ISMRM Workshop on Breaking the Barriers of Diffusion
(AWS17J011, G.G.), and the Fundamental Research Funds for the MRI. Lisbon, Portugal, p. 5.Genetic Relation between Hemispheric Connectivity Zhong et al. 87
Donahue CJ, Sotiropoulos SN, Jbabdi S, Hernandez-Fernandez M, Herve PY, Zago L, Petit L, Mazoyer B, Tzourio-Mazoyer N.
Behrens TE, Dyrby TB, Coalson T, Kennedy H, Knoblauch K, 2013. Revisiting human hemispheric specialization with neu-
Van Essen DC, et al. 2016. Using diffusion tractography to roimaging. Trends Cogn Sci. 17:69–80.
predict cortical connection strength and distance: a quan- Jansen AG, Mous SE, White T, Posthuma D, Polderman TJ. 2015.
titative comparison with tracers in the monkey. J Neurosci. What twin studies tell us about the heritability of brain devel-
36:6758–6770. opment, morphology, and function: a review. Neuropsychol
Ercsey-Ravasz M, Markov Nikola T, Lamy C, Van Essen David Rev. 25:27–46.
Downloaded from https://academic.oup.com/cercor/article/31/1/77/5892625 by Max-Planck-Institute for Psycholinguistics user on 02 February 2021
C, Knoblauch K, Toroczkai Z, Kennedy H. 2013. A predictive Jeurissen B, Tournier J-D, Dhollander T, Connelly A, Sijbers J.
network model of cerebral cortical connectivity based on a 2014. Multi-tissue constrained spherical deconvolution for
distance rule. Neuron. 80:184–197. improved analysis of multi-shell diffusion MRI data. Neuroim-
Eyler LT, Prom-Wormley E, Panizzon MS, Kaup AR, Fennema- age. 103:411–426.
Notestine C, Neale MC, Jernigan TL, Fischl B, Franz CE, Joliot M, Jobard G, Naveau M, Delcroix N, Petit L, Zago L, Crivello
Lyons MJ. 2011a. Genetic and environmental contribu- F, Mellet E, Mazoyer B, Tzourio-Mazoyer N. 2015. AICHA: an
tions to regional cortical surface area in humans: a mag- atlas of intrinsic connectivity of homotopic areas. J Neurosci
netic resonance imaging twin study. Cereb Cortex. 21: Methods. 254:46–59.
2313–2321. Kaiser M, Hilgetag CC. 2006. Non-optimal component placement,
Eyler LT, Prom-Wormley E, Fennema-Notestine C, Panizzon MS, but short processing paths, due to long-distance projections
Neale MC, Jernigan TL, Fischl B, Franz CE, Lyons MJ, Stevens A. in neural systems. PLoS Comput Biol. 12:e95.
2011b. Genetic patterns of correlation among subcortical vol- Kaiser M. 2017. Mechanisms of connectome development. Trends
umes in humans: results from a magnetic resonance imaging Cogn Sci. 21:703–717.
twin study. Hum Brain Mapp. 32:641–653. Kochunov P, Jahanshad N, Sprooten E, Nichols TE, Mandl RC,
Eyler LT, Vuoksimaa E, Panizzon MS, Fennema-Notestine C, Almasy L, Booth T, Brouwer RM, Curran JE, de Zubicaray GI,
Neale MC, Chen C-H, Jak A, Franz CE, Lyons MJ, Thomp- et al. 2014. Multi-site study of additive genetic effects on frac-
son WK. 2014. Conceptual and data-based investigation tional anisotropy of cerebral white matter: comparing meta
of genetic influences and brain asymmetry: a twin study and megaanalytical approaches for data pooling. Neuroimage.
of multiple structural phenotypes. J Cogn Neurosci. 26: 95:136–150.
1100–1117. Kochunov P, Jahanshad N, Marcus D, Winkler A, Sprooten E,
Fan L, Li H, Zhuo J, Zhang Y, Wang J, Chen L, Yang Z, Chu C, Xie Nichols TE, Wright SN, Hong LE, Patel B, Behrens T, et al. 2015.
S, Laird AR, et al. 2016. The human Brainnetome atlas: a new Heritability of fractional anisotropy in human white matter: a
brain atlas based on connectional architecture. Cereb Cortex. comparison of Human Connectome Project and ENIGMA-DTI
26:3508–3526. data. Neuroimage. 111:300–311.
Francks C. 2015. Exploring human brain lateralization with Kong XZ, Mathias SR, Guadalupe T, ELW G, Glahn DC, Franke B,
molecular genetics and genomics. Ann N Y Acad Sci. Crivello F, Tzourio-Mazoyer N, Fisher SE, Thompson PM, et al.
1359:1–13. 2018. Mapping cortical brain asymmetry in 17,141 healthy
Ganou M, Grouios G. 2008. Cerebral laterality in turner syn- individuals worldwide via the ENIGMA consortium. Proc Natl
drome: a critical review of the literature. Child Neuropsychol. Acad Sci U S A. 115:E5154–E5163.
14:135–147. Kremen WS, Prom-Wormley E, Panizzon MS, Eyler LT, Fischl B,
Geschwind DH, Miller BL, DeCarli C, Carmelli D. 2002. Heritability Neale MC, Franz CE, Lyons MJ, Pacheco J, Perry ME. 2010.
of lobar brain volumes in twins supports genetic models of Genetic and environmental influences on the size of specific
cerebral laterality and handedness. Proc Natl Acad Sci U S A. brain regions in midlife: the VETSA MRI study. Neuroimage.
99:3176–3181. 49:1213–1223.
Giedd JN, Blumenthal J, Jeffries NO, Castellanos FX, Liu H, Zijden- Le Guen Y, Auzias G, Leroy F, Noulhiane M, Dehaene-Lambertz
bos A, Paus T, Evans AC, Rapoport JL. 1999. Brain development G, Duchesnay E, Mangin J, Coulon O, Frouin V. 2018. Genetic
during childhood and adolescence: a longitudinal MRI study. influence on the sulcal pits: on the origin of the first cortical
Nat Neurosci. 2:861–863. folds. Cereb Cortex. 28:1922–1933.
Glasser MF, Sotiropoulos SN, Wilson JA, Coalson TS, Fischl B, Lee SJ, Steiner RJ, Luo S, Neale MC, Styner M, Zhu H, Gilmore
Andersson JL, Xu J, Jbabdi S, Webster M, Polimeni JR, et al. JH. 2015. Quantitative tract-based white matter heritability
2013. The minimal preprocessing pipelines for the Human in twin neonates. Neuroimage. 111:123–135.
Connectome Project. Neuroimage. 80:105–124. Liu S, Li A, Zhu M, Li J, Liu B. 2019. Genetic influences on cortical
Gong G, He Y, Concha L, Lebel C, Gross DW, Evans AC, Beaulieu myelination in the human brain. Genes Brain Behav. 18:e12537.
C. 2009. Mapping anatomical connectivity patterns of human Lohmann G, von Cramon DY, Steinmetz H. 1999. Sulcal variabil-
cerebral cortex using in vivo diffusion tensor imaging trac- ity of twins. Cereb Cortex. 9:754–763.
tography. Cereb Cortex. 19:524–536. Mesulam MM. 1998. From sensation to cognition. Brain.
Guadalupe T, Mathias SR, vanErp TG, Whelan CD, Zwiers MP, Abe 121:1013–1052.
Y, Abramovic L, Agartz I, Andreassen OA, Arias-Vasquez A, Nazeri A, Chakravarty MM, Felsky D, Lobaugh NJ, Rajji TK,
et al. 2016. Human subcortical brain asymmetries in 15,847 Mulsant BH, Voineskos AN. 2013. Alterations of superficial
people worldwide reveal effects of age and sex. Brain Imaging white matter in schizophrenia and relationship to cognitive
Behav. 11:1497–1514. performance. Neuropsychopharmacology. 38:1954–1962.
Hänggi J, Fövenyi L, Liem F, Meyer M, Jäncke L. 2014. The hypoth- Neale MC, Cardon LR. 1992. Methodology for genetic studies of twins
esis of neuronal interconnectivity as a function of brain size- and families. Dordrecht (Netherlands): Kluwer Academic.
a general organization principle of the human connectome. Neale MC, Miller MB. 1997. The use of likelihood-based confi-
Front Hum Neurosci. 8:915. dence intervals in genetic models. Behav Genet. 27:113–120.You can also read