When Growth Destroys Value - Edion Hysi - Empire Financial Research
←
→
Page content transcription
If your browser does not render page correctly, please read the page content below
When Growth
  Destroys Value
            Edion Hysi
edion@wharton.upenn.edu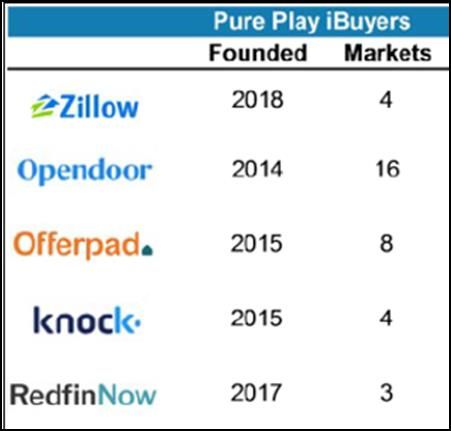
Zillow Group Overview

               • Portfolio of real estate and home-related brands on
                 mobile and web focusing on all stages of the home
                 lifecycle
                   o   $1.3bn total revenue in 2018
                   o   157 million average monthly unique users
                   o   Over 7 billion visits on platform
Ticker:
                   o   110 million homes in database
ZG
               • Reportable segments
Stock Price:       o Internet, Media & Technology (IMT)
$36                o Mortgages
Market Cap:        o Homes

~$7.4bn        • New CEO change: Richard Barton replaces Spencer
                 Rascoff
EV:                o Co-founded Zillow in 2005
~$6.7bn            o CEO from 2005 – 2010

                                                                       2
The Rise of “iBuying”
• “iBuying” is similar to trading in your car at the dealer
o Paying fair prices to motivated sellers who want the security of getting
cash now vs. traditional listing and waiting
o Few quick touch-up repairs/renovations to ready the home for listing
on the market
o Put house back on the market
o Make a small profit due to price appreciation
o Favors homogenous markets
o Quick turnover important
• Home flipping is buying a distressed property at a discount
o Invest significantly to improve the home
o Longer timeframe and potentially larger profits
o Profit is made on basis of home improvement and price appreciation
Books,
Furniture,
Clothes, Homes
Cars
Food
$ $$ $$$Homes Timeline Overview
• April 2018 Zillow launches “iBuying”
o Provides homeowners in certain metropolitan areas to receive
offers to purchase their home from Zillow
• Began buying homes through Zillow Offers in April 2018
and selling in July 2018
• Currently operating in 7 markets
o Phoenix, Las Vegas, Atlanta, Denver, Houston, Charlotte,
Raleigh
o 7 additional markets to be added in 2019Why is Zillow Buying Homes?
• Growth in core IMT business slowing down
o Has not shown a GAAP profit – despite now being a $1.3B business
• Competition from start-ups starting to heat up in the home
buying space
• Creates a new market to go after which Zillow knows well
o $1.8T TAM vs. $17B TAM for IMT segment
• Zillow believes it can re-invent itself into a growth story stockManagement Projections: 3-5 years • Homes Segment o Buying 60,000 homes annualized o $20 billion revenue stream o Adjusted EBITDA margin ~2-3% • IMT Segment o $2 billion in annual run-rate revenue (almost doubling) o Adjusted EBITDA margin ~30% o Current EBITDA margin 2%
Thesis 1: Home Price Appreciation

• In 2018, Zillow averaged a $2,500 net profit from every home they
  sold
• Roughly $6,400 of that profit was due to home price appreciation in
  the hottest markets in the U.S.
• As ZG expands to newer markets, these will be less attractive and
  decrease profitability
• Small decline in home appreciation price can quickly wipe out any
  profits from homes sold

                                Zillow offer bridge
                                Home acquistion cost            266,345
                                 Average Zillow fee                  7%
                                Market value at purchase       $286,392
                                 (+) Price appreciation           6,356
                                 (+) Return on renovation         1,769
                                 (+) Cost benefit                 1,330
                                Selling price                  $295,847
Thesis 2: Agent Commission Fees
• Competitors have better business model – can bypass agent
commission fees
o Better unit economics
o Better positioned to dominate the market
• Zillow uses real estate agents on both sides of the transaction and
pays them normal commissions
• Competitors can compete better on price for higher quality homes,
leaving Zillow winning bids on lower quality/slower moving homes
• ZG can’t cut out agents – their core IMT business depends on them
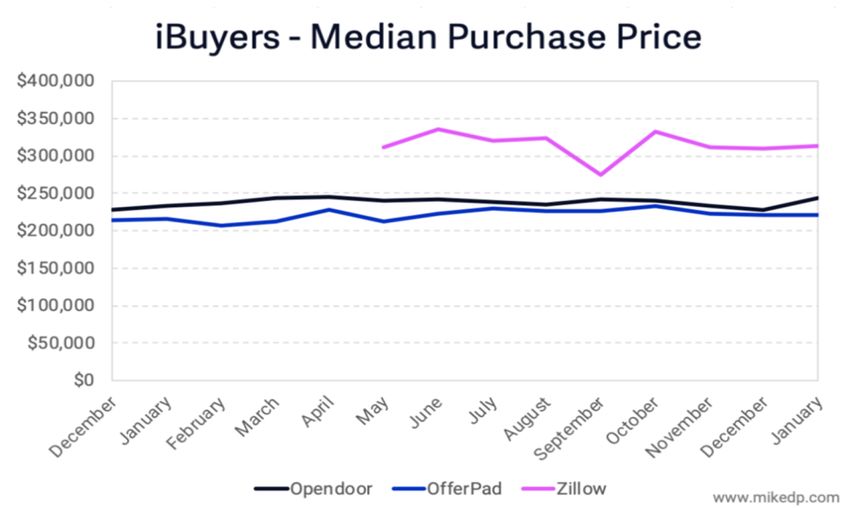
Getting priced out of the iBuying “sweet
spot” market of $200,000 – $250,000
home price rangeThesis 3: Compression of Fees • Sellers are very price sensitive and will compare offers from the different platforms – ultimately choosing highest offer o $5,000 difference in price goes straight to the seller’s pocket o Customers are not sticky o Uber vs. Lyft prices • Currently, all iBuyers are in overlapping markets with each other • Competition between platforms will ultimately lead to reduction in fees for Zillow
Thesis 4: Capital Intensive Business

• Contrary to Zillow’s core advertising business, home buying is
  capital intensive
• Requires operational expertise and discipline to keep turnover
  high – operational risk is greatly underappreciated by the
  street
• As Zillow grows into new markets - inventory risk compounds
• Stale inventory will lead to higher holding costs and higher
  interest expense
Thesis 5: Ancillary Revenue Dream

• Bulls claim that the Holy Grail of the iBuying business is seller
  leads that manifest from ZG bidding on homes
• A smaller additional stream of revenue comes from cross-
  selling mortgages to buyers from Zillow Offers inventory
• Currently the street models “pie in the sky” scenarios
• Even the best-case scenario for seller leads won’t be enough
  to offset losses from Homes segment
Catalysts and Risks

Catalysts                          Risks
• Economic slowdown                • Operational execution
    o Lower existing home sales    • Home prices continue to
    o Deceleration in home price     increase
      appreciation
                                   • Consolidation in industry
• Interest rate increase
• Decline in IMT segment
Summary • Both management and sell-side believe the Homes business can be profitable on its own • My differentiated view and short thesis hinges on the unit economics of the Homes segment which is not well understood and modeled by the street • I believe that ZG will have a net loss of $8,900 on every home they sell • Short ZG with a 2020 price target of $23, representing a 24% IRR to current stock price.
Appendix - Valuation and Returns
Sum of Parts Valuation
                         Dec-19    Dec-20    Dec-21
Core IMT Segment
Forward revenue           1,654     1,927     2,258
 (x) Multiple               3.5x      3.5x      3.5x
Enterprise value          5,791     6,744     7,904

Homes Segment
NTM Adj. EBITDA           (61.5)    (91.5)   (172.9)
 (x) Multiple               9.0x      9.0x      9.0x
Enterprise value           (554)     (823)   (1,556)
Exit Returns
                         Dec-19    Dec-20    Dec-21
Total enterprise value    5,237     5,921     6,348
(-) Debt                 (1,279)   (2,183)   (3,276)
(+) Cash                  1,614     1,583     1,518
Equity value              5,571     5,320     4,590
  Diluted shares             223       230       238
Share price                $25.0     $23.1     $19.3

IRR                       -47%       -25%     -22%
Appendix - Homes Segment Unit Economics
Unit Economics - Return on Homes Sold
2018A 2019E 2020E 2021E 2022E
Revenue per home 295,847 309,161 323,832 332,830 338,819
Operating costs:
Home acquistion cost 266,345 282,326 297,079 306,977 314,121
Renovation cost 8,847 8,443 8,884 9,180 9,393
Holding costs 2,520 2,713 2,913 3,120 3,182
Selling costs 13,260 14,116 14,854 15,349 15,706
Operating income 4,875 1,563 102 (1,796) (3,584)
% margin 1.6% 0.5% 0.0% -0.5% -1.1%
Interest expense 2,389 3,946 4,509 5,043 5,314
Net income per home $2,486 -$2,383 -$4,408 -$6,838 -$8,897
% margin 0.8% -0.8% -1.4% -2.1% -2.6%Appendix - Homes Segment Projections Homes Segment Income Statement ($ million) 2018A 2019E 2020E 2021E 2022E Homes sold 177 2,555 8,633 22,497 41,146 Revenue 52 790 2,796 7,488 13,941 Cost of goods (49) (743) (2,641) (7,113) (13,311) Gross profit 3 47 154 375 630 % margin 5.9% 5.9% 5.5% 5.0% 4.5% Sales & Marketing (19) (57) (161) (394) (718) Technology & Dev. (21) (29) (39) (51) (63) General and Admin. (23) (29) (35) (39) (43) Operating income (60) (69) (80) (109) (194) % margin -114.9% -8.7% -2.9% -1.5% -1.4% Interest expense (2) (18) (58) (126) (237) Net loss (62) (87) (138) (236) (431) % margin -119% -11% -5% -3.1% -3.1% Adj. EBITDA (45) (51) (62) (91) (173) % margin -86.2% -6.4% -2.2% -1.2% -1.2% FCF (121) (279) (411) (762) FCF/share -$0.54 -$1.21 -$1.73 -$3.13
Appendix - IMT “Bull Case” Segment Projections

IMT Segment Income Statement
($ million)                         2018A   2019E   2020E   2021E   2022E
Total revenue (inc. seller leads)   1,281   1,471   1,654   1,927   2,258
 % growth                                     15%     12%     16%     17%
Adj. EBITDA                          246     316     381     491     632
 % margin                            19%     22%     23%     26%     28%
FCF                                          184     248     346     476
FCF/share                                   $0.83   $1.08   $1.46   $1.96
You can also read