MONTHLY STATISTICS PACKAGE - JANUARY 2020
←
→
Page content transcription
If your browser does not render page correctly, please read the page content below
MONTHLY
STATISTICS
PACKAGE
JANUARY 2020
Media Release
FOR IMMEDIATE RELEASE
February 3, 2020
Lack of Supply and Guideline B-20 Continue to Dampen Sales
NANAIMO, BC – Sales of single-family homes in January dropped by 16 per cent from one year ago
and were 26 per cent lower than in December.
Last month, 174 single-family homes sold on the Multiple Listing Service® (MLS®) System compared
to 235 in December and 208 one year ago. Apartment sales in January decreased by three per cent
year over year, while the number of townhouses sold dropped by 18 per cent from one year ago.
Inventory of single-family homes last month rose slightly from one year ago (981 to 992) and
increased by six per cent from December 2019. Active listings of apartments rose by three per cent
(299 to 309) year over year, while townhouse inventory dropped by 24 per cent (165 to 125).
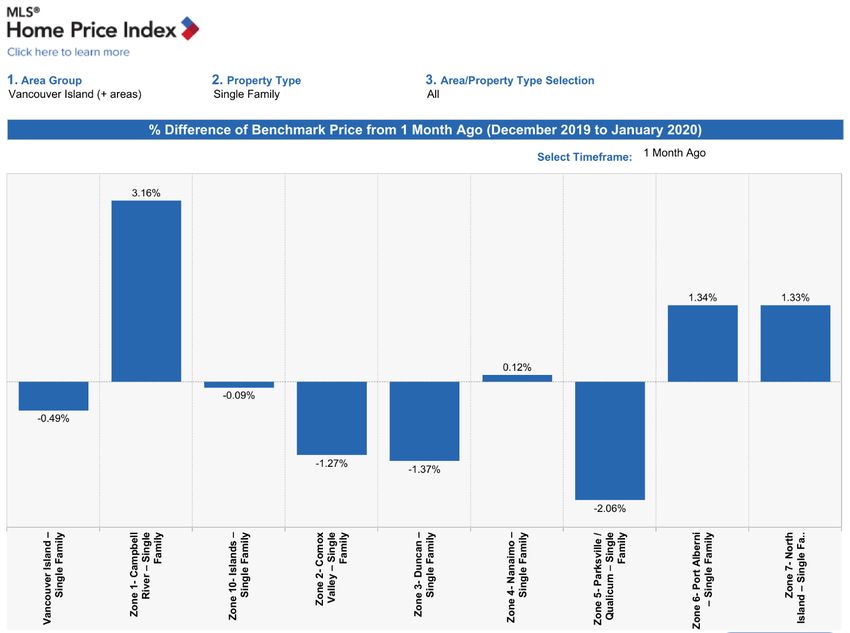
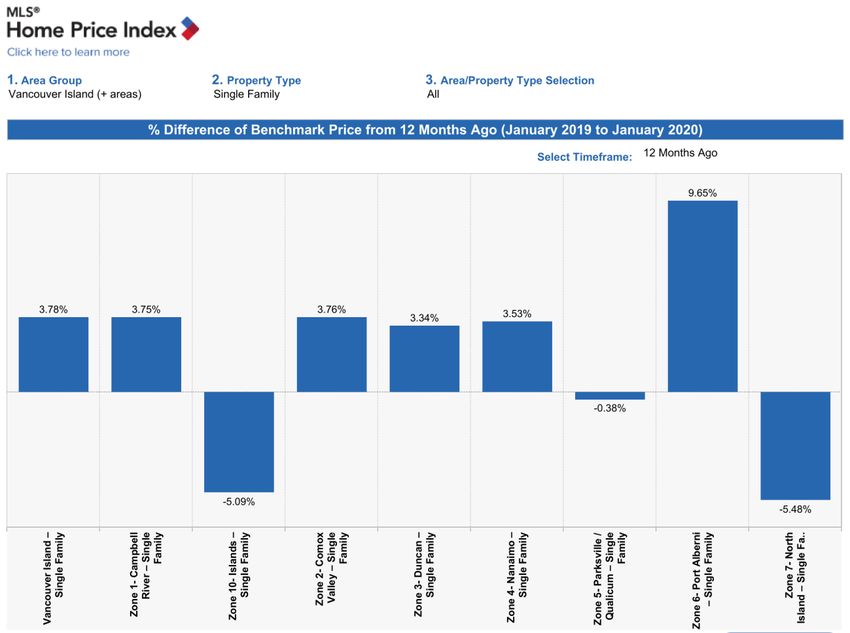
The benchmark price of a single-family home board-wide was $515,400 in January, a four per cent
increase from one year ago and marginally lower than in December. (Benchmark pricing tracks the
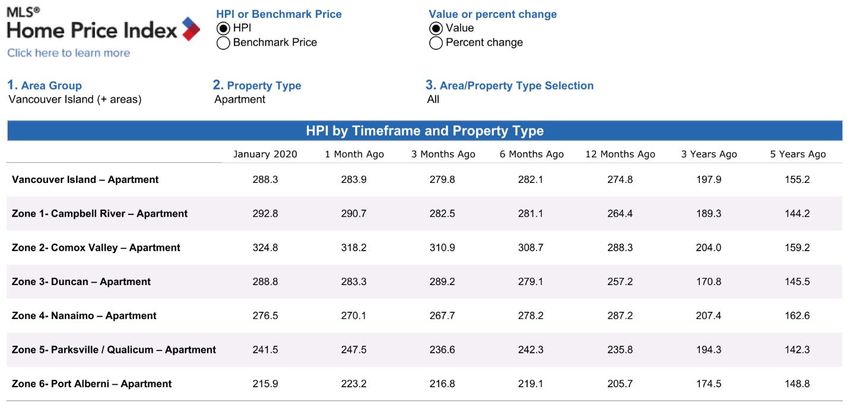
value of a typical home in the reported area.) In the apartment category, the year-over-year
benchmark price rose by five per cent, hitting $309,300, which is two per cent higher than in
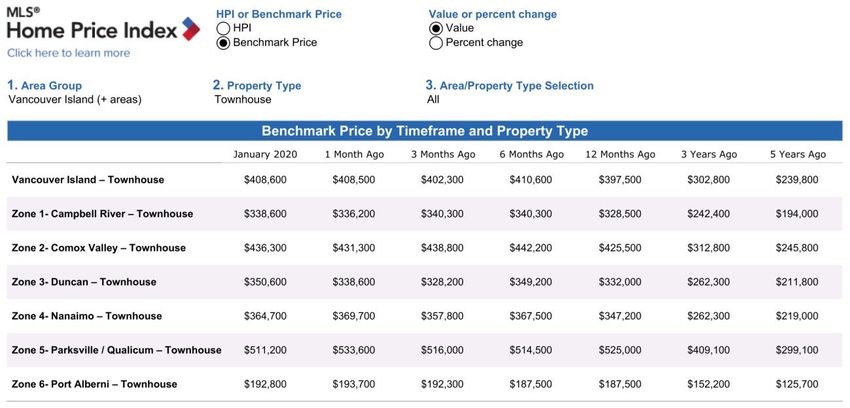
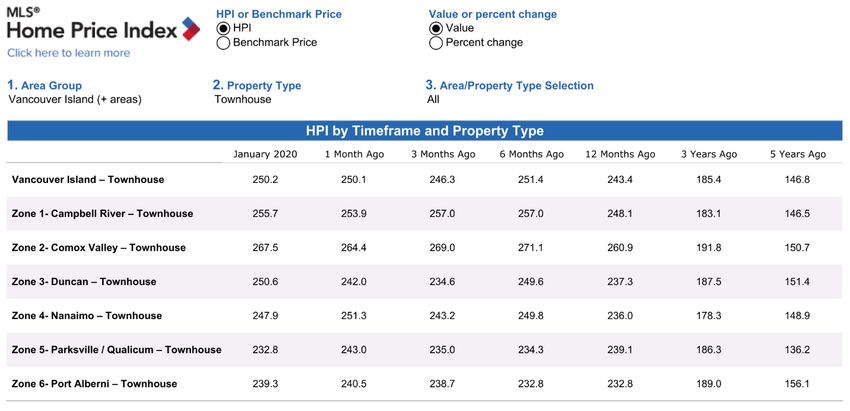
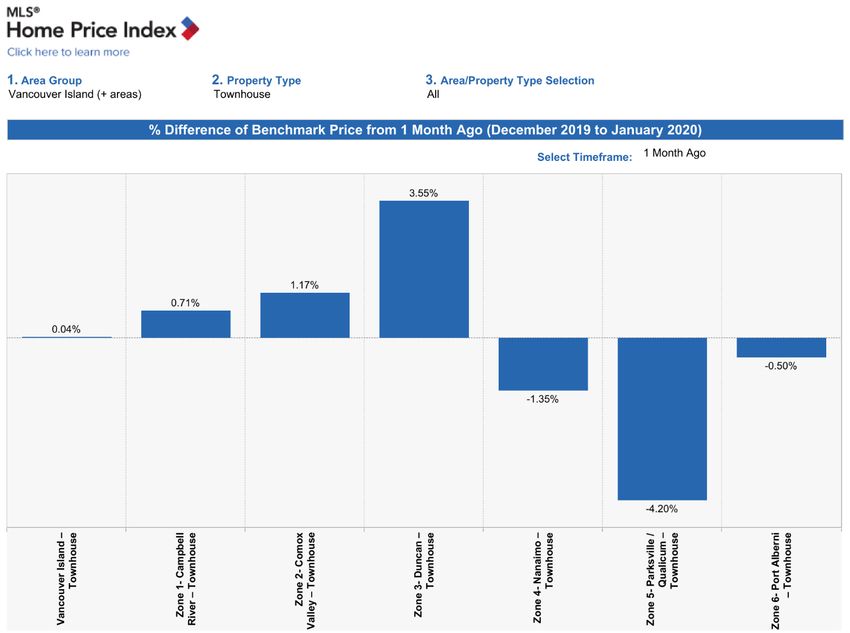
December. The benchmark price of a townhouse last month rose by three per cent year over year,
climbing to $408,600, and was virtually the same as in December.
Regionally, the benchmark price of a single-family home in the Campbell River area last month was
$437,300, an increase of four per cent over last year. In the Comox Valley, the benchmark price
reached $521,900, up by four per cent from one year ago. Duncan reported a benchmark price of
$478,000, an increase of three per cent from January 2019. Nanaimo’s benchmark price rose by four
per cent to $562,700 in January, while the Parksville-Qualicum area saw its benchmark price drop
slightly to $571,400. The cost of a benchmark single-family home in Port Alberni reached $328,900 in
January, a 10 per cent increase from one year ago.
Trend wise, inventory is tightening again, which is one of the factors behind weaker sales. REALTORS®
are reporting that there is keen interest among buyers. However, reduced purchasing power due to
Guideline B-20 and limited supply in their price range are pushing them to the sidelines.
“The stress test is compressing more demand into our mid- and lower-priced property market. Lack
of inventory in that price range is certainly curtailing some buyers from moving ahead with their
home purchase,” says Broens. “Unfortunately, without new construction, this gridlock may just be
the new normal.”
Broens also adds that the recent release of home assessments tends to create confusion for
consumers, who are not always aware that the assessed figure is based on data that is several
months old and may not reflect current market value.
“Whether you’re a buyer or seller, a REALTOR® can help you cut through the fog of confusion around
home prices,” says Broens. “We have access to tools and market analytics that will help us determine
an optimal selling price for your home and find a property that fits your budget.”
- 30 -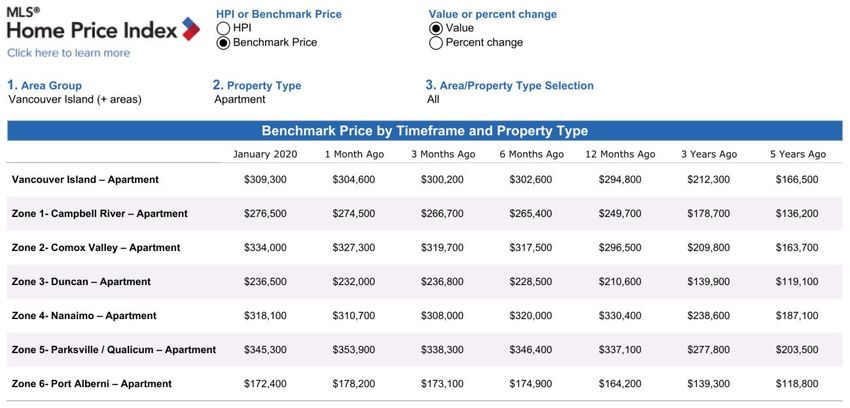
ABOUT VIREB
VIREB represents over 1,000 REALTOR® members in nearly 90 member offices on Vancouver Island (north of
Victoria).

VIREB cautions that average price information can be useful in establishing trends over time, but does not indicate
the actual prices in centres comprised of widely divergent neighbourhoods or account for price differential
between geographic areas.

Trademarks are owned or controlled by The Canadian Real Estate Association (CREA) and identify real estate
professionals who are members of CREA (REALTOR®) and/or the quality of services they provide (MLS®).

Visit our website for updated information at www.vireb.com.

HPI Note: Areas with insufficient data do not generate statistics and are not included in the HPI graphs.

Contact:
Kevin Reid, President: 250.334.3124
Ian Mackay, President-Elect: 250.248.4321
Kaye Broens, Past President: 833.817.6506
Darrell Paysen, Manager, Member Services: 250.390.4212

Or, for further localized comments, please contact:

Campbell River
Ashley Stawski: 250.286.1187
Comox Valley
Kevin Reid: 250.334.3124
Cowichan Valley
Shae Webber: 250.746.8123
Nanaimo
Kaye Broens: 833.817.6506
Kelly O’Dwyer: 833.817.6506
Parksville-Qualicum
Erica Kavanaugh: 250.248.4321
Port Alberni-West Coast
Judy Gray: 250.726.2228

MLS® HPI Media Contact
Communications Department
Vancouver Island Real Estate Board
communications@vireb.com
250.390.4212
Backgrounder
About the MLS® Home Price Index
On November 1st, VIREB adopted the MLS® Home Price Index (MLS® HPI) as a new method of reporting
price trends in the market. The MLS® HPI determines the value for a typical “benchmark” home, which is
a notional dwelling that shares a specific set of qualitative and quantitative attributes. Benchmark prices
tend to be slightly lower than corresponding medians and averages

The MLS® HPI, based on the information entered into the MLS® System at the time of sale, is the best
and purest way of determining price trends in the housing market. It was pioneered by six founding
partners: the real estate boards of Calgary, Fraser Valley, Montreal, Toronto, and Vancouver, and the
Canadian Real Estate Association. In 2009, the partners contracted with Altus Group to develop the
MLS® HPI, which subsequently launched in January 2012. Others have since joined the program, with 10
partners and growing.

Why an MLS® Home Price Index?
The MLS® HPI captures and analyzes Canadian home prices based on both quantitative and qualitative
housing features.

Quantitative features captured by the index are, for example, number of rooms and bathrooms, living
area above ground and the age of the home. Qualitative features include finished basement, if the home
is new or resale, and the home’s proximity to shopping, schools, transportation, hospitals and so on.

The MLS® HPI gauges Vancouver Island prices relative to January 2005, and tracks price trends for
benchmark housing types:
    • Single-family homes
          o One-storey
          o Two-storey
    • Townhouses
    • Condominium apartments
    • The complete methodology is available at http://homepriceindex.ca/hpi_resources_en.html

Why Does It Matter?
Average and median home prices are often misinterpreted, are affected by change in the mix of homes
sold, and can swing dramatically from month to month (based on the types and prices of properties that
sold in a given month). The MLS® HPI overcomes these shortcomings.
Compared to all other Canadian home price measures, the MLS® HPI identifies turning points sooner, is
the most current, and is the most detailed and accurate gauge for Canadian home prices.

How to Read the Tables
Benchmark Price: Estimated sale price of a benchmark property. Benchmarks represent a typical
property in each market.

Price Index: Index numbers estimate the percentage change in price on typical and constant quality
properties over time. All figures are based on past sales. In January 2005, all indices are set to 100

Month/Year change %: Percentage change of index over a period of (x) month(s) year.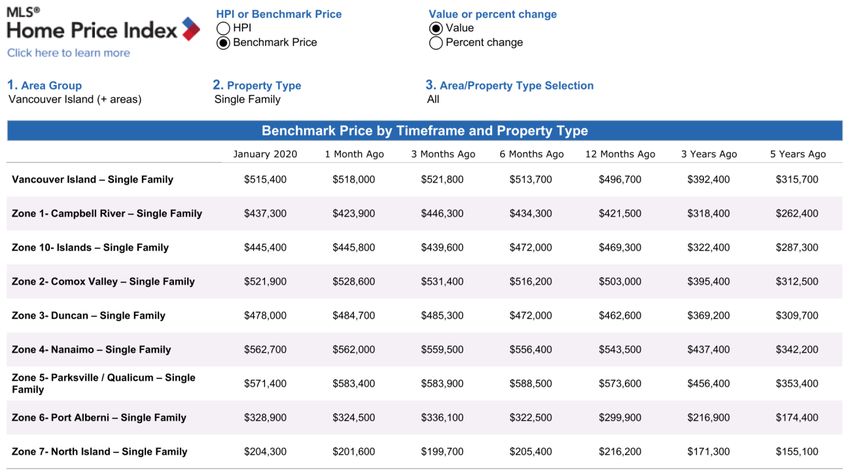
Single-Family Home Benchmark Price
Apartment Benchmark Price
Townhouse Benchmark Price
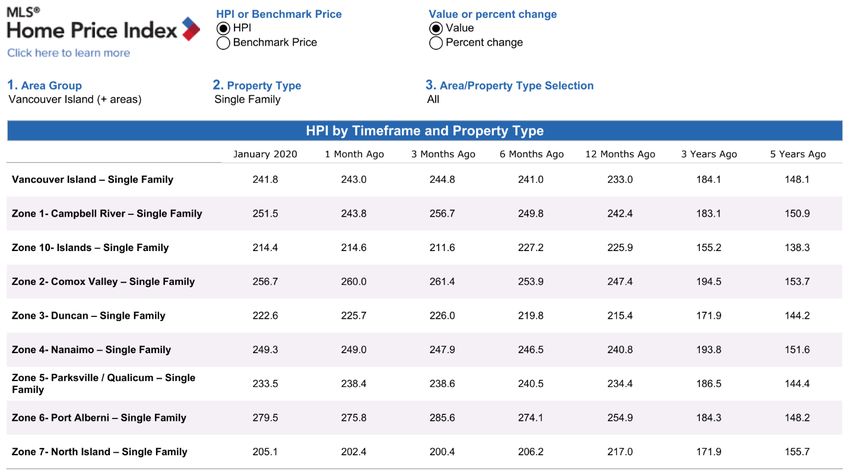
HPI Data
MLS® Sales Summary

Copies of archived Statistics are available at our website. Go to www.vireb.com and under
Resources in the top menu, choose Market Statistics. You are encouraged to contact any of
the Directors of the Vancouver Island Real Estate Board to obtain local comments.
Average, Median, and Benchmark Price (HPI) Comparisons

                                      VIREB Board Area MLS® Sales
                           Single Family - Average, Median and Home Price Index
                                Average Sale Price         Median             HPI
    $600,000
    $550,000
    $500,000
    $450,000
    $400,000
    $350,000
    $300,000

                 Nov-19
                 Nov-18
                 Feb-18

                 Sep-18

                 Feb-19

                 Sep-19
                 May-19
                 May-18

                 Aug-18

                 Aug-19

                 Oct-19
                 Oct-18
                  Jun-18

                 Mar-19
                 Apr-19
                 Mar-18
                 Apr-18

                   Jul-18

                  Jun-19
                   Jul-19

                 Dec-19
                 Dec-18
                  Jan-18

                  Jan-19

                  Jan-20
   Copyri ght© 2020 VIREB

                                     VIREB Board Area MLS® Sales
                           Condo (Apt) Average, Median and Home Price Index
                                 Average Sale Price        Median           HPI
   $350,000
   $300,000
   $250,000
   $200,000
   $150,000
   $100,000
               Nov-18

               Nov-19
               Feb-18

               Sep-18

               Sep-19
               May-18

               Feb-19

               May-19
               Oct-18

               Oct-19
               Aug-18

               Aug-19
                Jun-18
                 Jul-18

                Jun-19
                 Jul-19
               Apr-18

               Apr-19
               Mar-18

               Dec-18

               Mar-19

               Dec-19
                Jan-18

                Jan-20
                Jan-19

   Copyri ght© 2020 VIREB

                                     VIREB Board Area MLS® Sales
                      Condo (Twnhse) - Average, Median and Home Price Index
                                Average Sale Price            Median                HPI
    $500,000
    $400,000
    $300,000
    $200,000
    $100,000
                Nov-18

                Nov-19
                Sep-18

                Sep-19
                Feb-18

                Feb-19
                May-18

                May-19
                Oct-18

                Oct-19
                Aug-18

                Aug-19
                 Jun-18

                 Jun-19
                  Jul-19
                  Jul-18
                Apr-18

                Mar-19
                Apr-19
                Mar-18

                Dec-18

                Dec-19
                 Jan-18

                 Jan-19

                 Jan-20

  Copyri ght© 2020 VIREB
1000
1500
2000
0
500
1000
0
200
800
400
600
Jan-18 Jan-18
Feb-18 Feb-18
Mar-18 Mar-18
Copyri ght© 2020 VIREB
Apr-18 Apr-18
Copyri ght© 2020 VIREB
May-18 May-18
Jun-18 Jun-18
Jul-18 Jul-18
Aug-18 Aug-18
Sep-18 Sep-18
Oct-18 Oct-18
Nov-18 Nov-18
Listed
Dec-18 Dec-18
Jan-19 Jan-19
Active
Feb-19 Feb-19
Mar-19 Mar-19
Single-Family
Apr-19 Apr-19
May-19 Sold May-19
Jun-19 Jun-19
Jul-19 Jul-19
Aug-19 Aug-19
Active Listings / Listings and Sales
Sep-19 Sep-19
VIREB Board Area - Single Family Active MLS® Listings
Oct-19 Oct-19
VIREB Board Area - Single Family New MLS® Listings and Sales
Nov-19 Nov-19
Dec-19 Dec-19
Jan-20 Jan-20You can also read