MONTHLY STATISTICS PACKAGE - AUGUST 2020
←
→
Page content transcription
If your browser does not render page correctly, please read the page content below
MONTHLY
STATISTICS
PACKAGE
AUGUST 2020
MEDIARELEASE
Please note: The Vancouver Island Real Estate Board (VIREB) transitioned to a new MLS® System on July 28 and now
uses a significantly different data model, which has affected our categories and terminology. For the board-supplied
graphs, single-family is now referred to as single-family detached, apartment as condo apartment, and townhouse
as row/townhouse, which now includes patio homes. However, when reporting HPI numbers, VIREB still refers to
single-family, apartment, and townhouse in the media release. Further, a new sub-category called Malahat and Area
has been added to some of our HPI graphs.
SEPTEMBER 1, 2020
STRONG POST-COVID RECOVERY CONTINUES
NANAIMO, BC – The Vancouver Island Real Estate Board (VIREB) recorded 1,101 unit sales (all categories)
last month, a 39 per cent increase from August 2019.
A total of 547 single-family detached properties (excluding acreage and waterfront) sold in August, a
year-over-year increase of 35 per cent. Sales of condo apartments rose by 43 per cent year over year
while row/townhouse sales increased by 19 per cent.
“Our housing market rebounded from the COVID-19 downturn far more quickly than expected,” says
VIREB president Kevin Reid. “Pent-up demand, low interest rates, and persistent supply shortages are
fueling the recovery.”
Active listings of single-family detached properties (excluding acreage and waterfront) totalled 1,081 in
August, while there were 427 condo apartments and 221 row/townhouses for sale last month.
Reid acknowledges there is still uncertainty around the Canadian economy and U.S. election, but he is
optimistic, a sentiment echoed by the British Columbia Real Estate Association (BCREA).
“The outlook for the B.C. housing market is much brighter following a surprisingly strong recovery,” said
Brendon Ogmundson, BCREA Chief Economist. “We expect home sales will sustain this momentum into
2021, aided by record-low mortgage rates and a recovering economy.”
BCREA expects unit sales on Vancouver Island to hit 8,300 in 2021, a 15 per cent increase over the 7,200
sales projected this year.
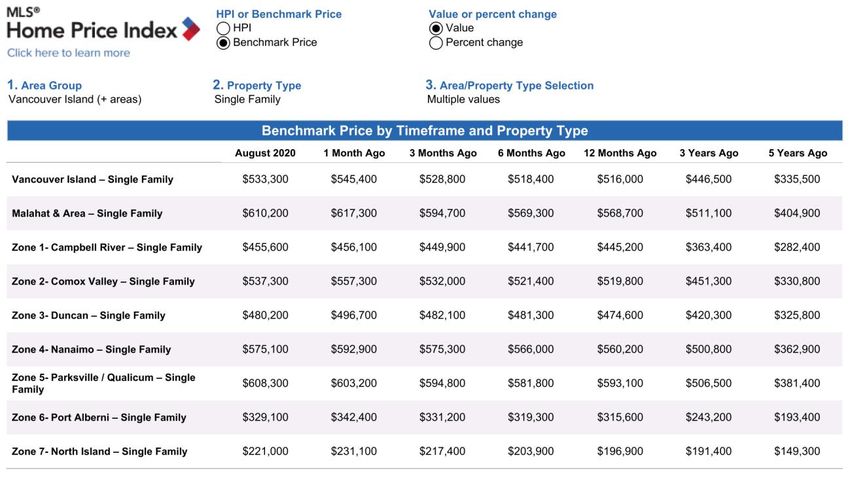
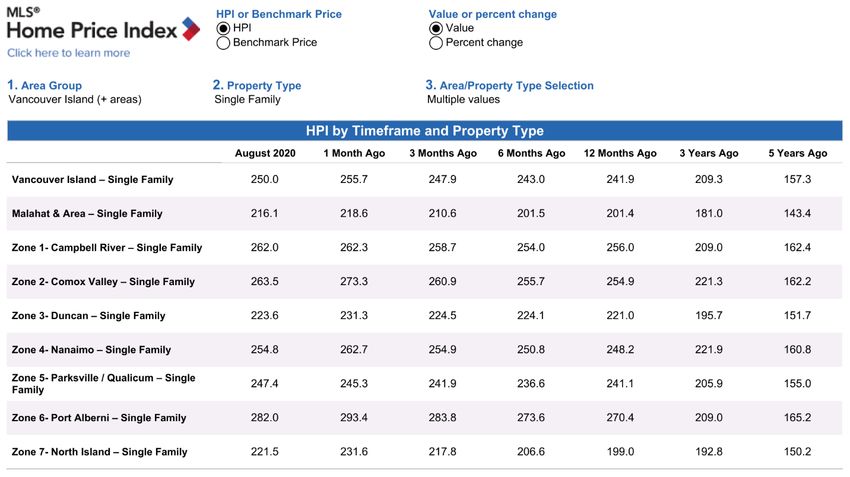
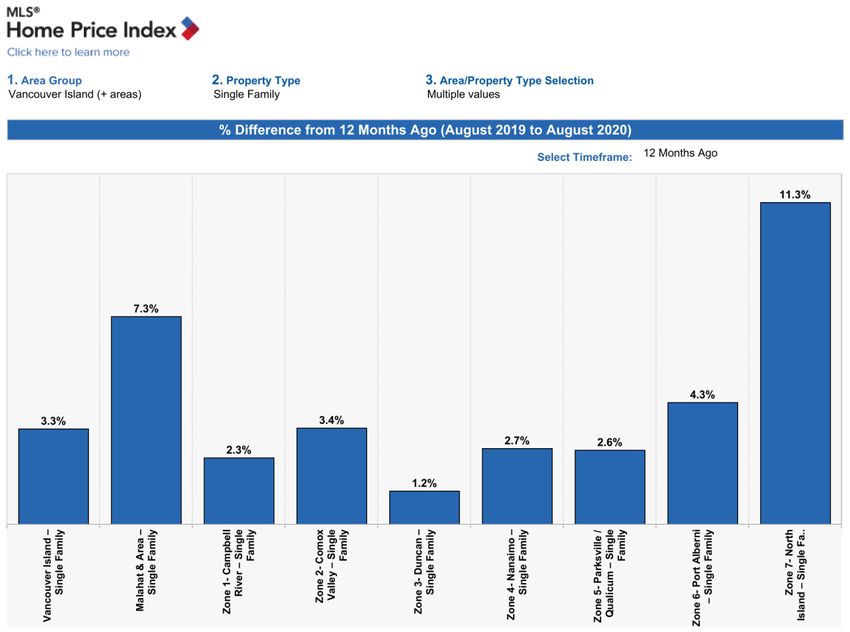
The benchmark price of a single-family home hit $533,300 in August, an increase of three per cent from
the previous year but two per cent lower than in July. (Benchmark pricing tracks the value of a typical
home in the reported area.) The year-over-year benchmark price of an apartment rose by five percent,
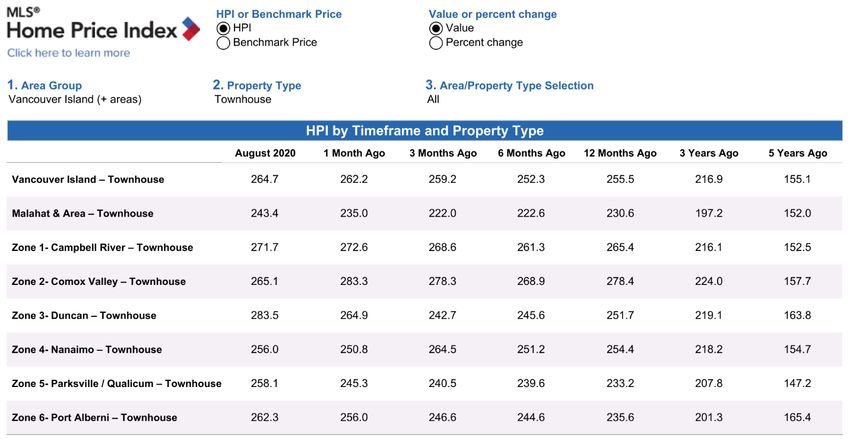
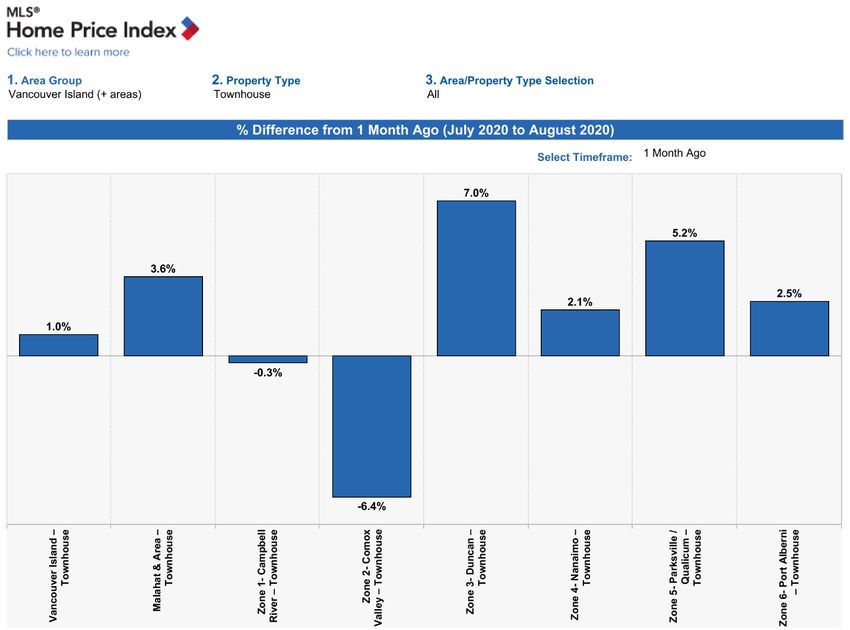
hitting $312,000 but down marginally from July. The benchmark price of a townhouse rose by four
percent year over year, climbing to $432,300 and up by one percent from July.
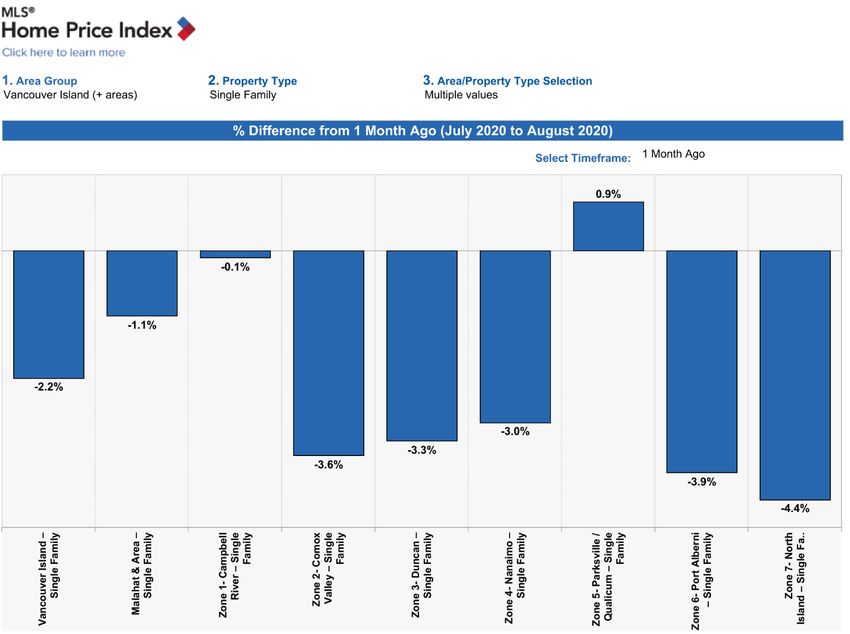
For the Malahat and area, the benchmark price of a single-family home last month was $610,200, a seven
per cent increase from August 2019. In Campbell River, the benchmark price hit $455,600, up two per cent
over last year. In the Comox Valley, the benchmark price reached $537,300, up by three per cent from one
year ago. Duncan reported a benchmark price of $480,200, an increase of one per cent from August 2019.
Nanaimo’s benchmark price rose by three per cent to $575,100, while the Parksville-Qualicum area saw
its benchmark price increase by three per cent to $608,300. The cost of a benchmark single-family home
in Port Alberni reached $329,100, a four per cent increase from one year ago. For the North Island, the
benchmark price was $221,000, an 11 per cent increase over last year.
- 30 -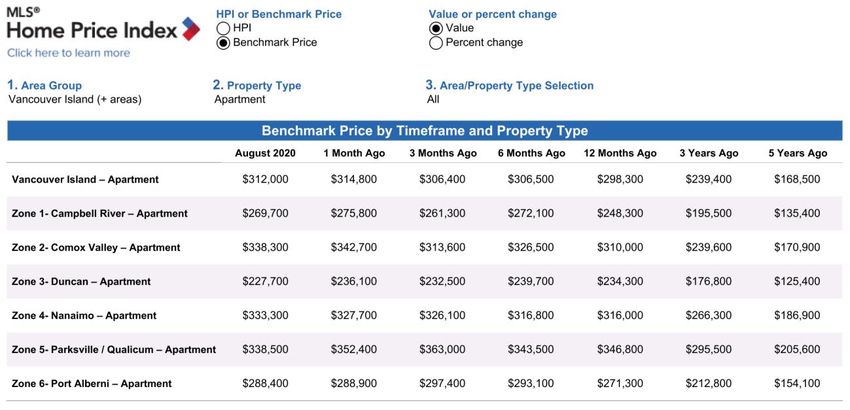
ABOUT VIREB

VIREB represents over 1,000 REALTORS® in nearly 90 member offices on Vancouver Island, from the
Malahat in the south to the northern tip.

VIREB cautions that average price information can be useful in establishing trends over time but does
not indicate the actual prices in centres comprised of widely divergent neighbourhoods or account for
price differential between geographic areas.

Trademarks are owned or controlled by The Canadian Real Estate Association (CREA) and identify real
estate professionals who are members of CREA (REALTOR®) and/or the quality of services they provide
(MLS®).

Visit our website for updated information at www.vireb.com.

HPI Note: Areas with insufficient data do not generate statistics and are not included in the HPI graphs.

CONTACTS

Kevin Reid, President: 250.334.3124
Ian Mackay, President-Elect: 250.248.4321
Kaye Broens, Past President: 833.817.6506
Darrell Paysen, Manager, Member Services: 250.390.4212

For localized commentary, please contact:

Campbell River                                         Directors-at-Large
Ashley Stawski: 250.286.1187                           Janet Scotland: 250.923.2111
Comox Valley                                           David Procter: 250.339.2021
Kevin Reid: 250.334.3124                               Ian Mackay: 250.248.4321
Cowichan Valley
Susan Perrey: 250.245.2252                             MLS® HPI Media Contact
Nanaimo                                                Communications Department
Kaye Broens: 833.817.6506                              Vancouver Island Real Estate Board
Kelly O’Dwyer: 833.817.6506                            communications@vireb.com
Parksville-Qualicum                                    250.390.4212
Erica Kavanaugh: 250.248.4321
Port Alberni-West Coast
Judy Gray: 250.726.2228

6374 Metral Drive | Nanaimo, BC | V9T 2L8 | 250.390.4212 T | 250.390.9565 F | www.vireb.com | www.openhousesvi.com | www.realtor.ca
Backgrounder
About the MLS® Home Price Index
On November 1st, VIREB adopted the MLS® Home Price Index (MLS® HPI) as a new method of reporting
price trends in the market. The MLS® HPI determines the value for a typical “benchmark” home, which is
a notional dwelling that shares a specific set of qualitative and quantitative attributes. Benchmark prices
tend to be slightly lower than corresponding medians and averages
The MLS® HPI, based on the information entered into the MLS® System at the time of sale, is the best
and purest way of determining price trends in the housing market. It was pioneered by six founding
partners: the real estate boards of Calgary, Fraser Valley, Montreal, Toronto, and Vancouver, and the
Canadian Real Estate Association. In 2009, the partners contracted with Altus Group to develop the
MLS® HPI, which subsequently launched in January 2012. Others have since joined the program, with 10
partners and growing.
Why an MLS® Home Price Index?
The MLS® HPI captures and analyzes Canadian home prices based on both quantitative and qualitative
housing features.
Quantitative features captured by the index are, for example, number of rooms and bathrooms, living
area above ground and the age of the home. Qualitative features include finished basement, if the home
is new or resale, and the home’s proximity to shopping, schools, transportation, hospitals and so on.
The MLS® HPI gauges Vancouver Island prices relative to January 2005, and tracks price trends for
benchmark housing types:
• Single-family homes
o One-storey
o Two-storey
• Townhouses
• Condominium apartments
• The complete methodology is available at http://homepriceindex.ca/hpi_resources_en.html
Why Does It Matter?
Average and median home prices are often misinterpreted, are affected by change in the mix of homes
sold, and can swing dramatically from month to month (based on the types and prices of properties that
sold in a given month). The MLS® HPI overcomes these shortcomings.
Compared to all other Canadian home price measures, the MLS® HPI identifies turning points sooner, is
the most current, and is the most detailed and accurate gauge for Canadian home prices.
How to Read the Tables
Benchmark Price: Estimated sale price of a benchmark property. Benchmarks represent a typical
property in each market.
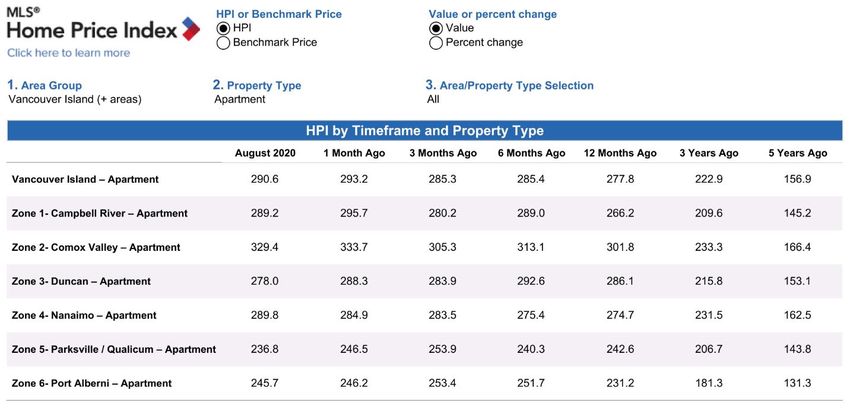
Price Index: Index numbers estimate the percentage change in price on typical and constant quality
properties over time. All figures are based on past sales. In January 2005, all indices are set to 100
Month/Year change %: Percentage change of index over a period of (x) month(s) year.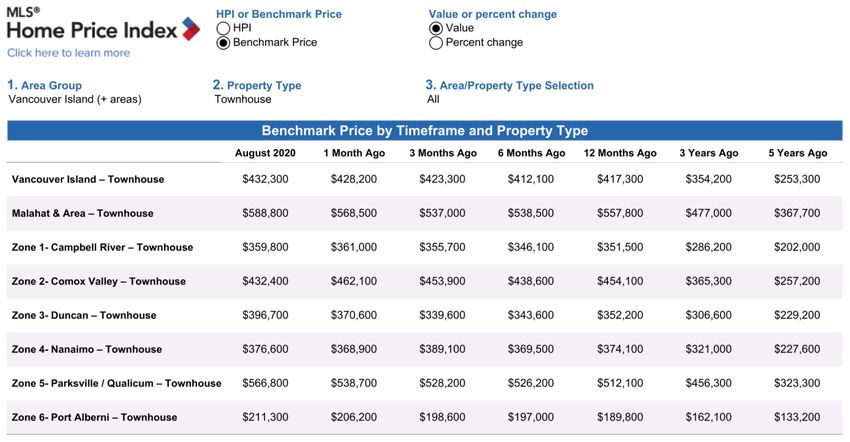
Benchmark Price – Single-Family
Benchmark Price – Apartment
Benchmark Price – Townhouse
HPI Data
Average, Median, and Benchmark Price (HPI) Comparisons

                                  VIREB Board Area MLS® Sales
                   RES-Row/Townhouse- Average, Median and Home Price Index
                           Average Sale Price          Median                HPI
   $450,000
   $400,000
   $350,000
   $300,000
   $250,000
   $200,000
   $150,000
   $100,000

                Apr-19
                Dec-18

                Dec-19
                May-19

                Apr-20
                May-20
                Sep-18
                Oct-18

                Jun-19

                Oct-19

                Jun-20
                Aug-18

                Nov-18

                 Jan-19

                Mar-19

                Aug-19

                Nov-19

                 Jan-20

                Mar-20

                Aug-20
                Feb-19

                  Jul-19

                Sep-19

                Feb-20

                  Jul-20
  Copyright© 2020 VIREB

                                  VIREB Board Area MLS® Sales
                      RES-Condo Apt - Average, Median and Home Price Index
                             Average Sale Price       Median           HPI
  $350,000
  $300,000
  $250,000
  $200,000
  $150,000
  $100,000
              Apr-19

              Apr-20
              Dec-18

              May-19

              Dec-19
               Jan-20

              May-20
              Aug-18

              Mar-19

              Aug-19

              Mar-20

              Aug-20
              Oct-18

              Jun-19

              Oct-19

              Jun-20
              Nov-18

               Jan-19

              Nov-19
              Sep-18

              Feb-19

                Jul-19

              Sep-19

              Feb-20

                Jul-20
  Copyright© 2020 VIREB

                                  VIREB Board Area MLS® Sales
                   RES-Row/Townhouse- Average, Median and Home Price Index
                           Average Sale Price          Median                HPI
   $450,000
   $400,000
   $350,000
   $300,000
   $250,000
   $200,000
   $150,000
   $100,000
                Apr-19

                Apr-20
                Dec-18

                Dec-19
                Aug-18

                Mar-19

                May-19
                Sep-18
                Oct-18

                Aug-19

                Oct-19

                Mar-20

                May-20

                Aug-20
                Nov-18

                 Jan-19

                Jun-19

                Jun-20
                Nov-19

                 Jan-20
                Feb-19

                  Jul-19

                Sep-19

                Feb-20

                  Jul-20

  Copyright© 2020 VIREB
0
1000
1500
2000
500
0
1000
200
400
600
800
Aug-18 Aug-18
Sep-18 Sep-18
Oct-18 Oct-18
Copyright© 2020 VIREB
Copyright© 2020 VIREB
Nov-18 Nov-18
Dec-18 Dec-18
Jan-19 Jan-19
Feb-19 Feb-19
Mar-19 Mar-19
Apr-19 Apr-19
May-19 May-19
Jun-19 Jun-19
Listed
Jul-19 Jul-19
Aug-19 Aug-19
Active
Sep-19 Sep-19
Oct-19 Oct-19
Nov-19 Nov-19
Dec-19 Sold Dec-19
Jan-20 Jan-20
Feb-20 Feb-20
Mar-20 Mar-20
Active Listings / Listings and Sales
Apr-20 Apr-20
Residential – Single Family Detached
VIREB Board Area - RES-SF Detached Active MLS® Listings
May-20 May-20
Jun-20 Jun-20
VIREB Board Area - RES-SF Detached New MLS® Listings and Sales
Jul-20 Jul-20
Aug-20 Aug-20You can also read