Ray Russell's 2020-2021 Fearless Forecast
←
→
Page content transcription
If your browser does not render page correctly, please read the page content below
Author: Dr. Ray Russell
                                                                                  Founder and President
                                                                                    of RaysWeather.Com
                                                                                  Date: October 15, 2020

Ray Russell’s 2020-2021 Fearless Forecast
Summary of the Fearless Forecast for Winter 2020-2021
You may want to read the rationale that follows, but we’ll give you the “answer” first.
   • Snow totals 20% less than long-term.
   • Temperatures 1-2 degrees warmer than average.
   • While we will have snow and cold periods, it will be difficult to lock in cold for long periods of
       time.

Below are forecast totals for many locations in the Southern Appalachians. (Note: The forecast snowfall
total includes snow/ice falling between October 2019 and May 2020.)

Table 1: Specific 2020-21 Snowfall Forecasts for Selected Locations

 Location                            Expected Total Snow/Ice for
                                     Winter 2020-2021
 Asheville, NC                       10"
 Banner Elk, NC                      34"
 Beech Mountain, NC                  70"
 Boone, NC                           29"
 Galax, VA                           16"
 Hendersonville, NC                  8"
 Hickory, NC                         4"
 Independence, VA                    16"
 Jefferson and West Jefferson        18"
 Lenoir, NC                          5"
 Morganton, NC                       5"
 Mt. Airy, NC                        8"
 Old Fort, NC                        5"
 Sparta, NC                          16"
 Spruce Pine, NC                     17"
 Sugar Mountain, NC                  70"
 Waynesville, NC                     13"
 Wilkesboro and N. Wilkesboro        6"
 Wytheville, VA                      19"

Happy Skiing and Snowboarding! We’ll keep you informed with the most reliable day-to-day forecasts
for the Southern Appalachians and Foothills all winter.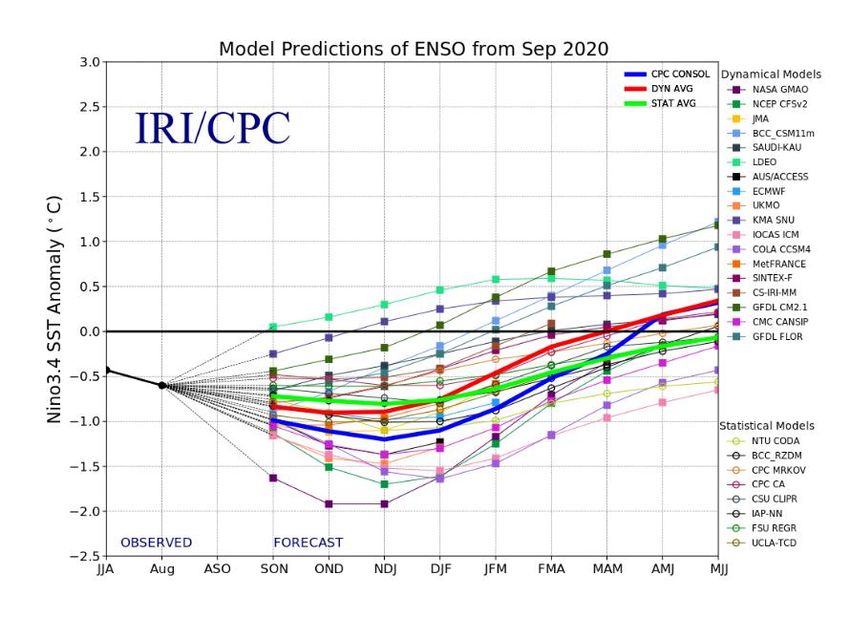
Producing a winter forecast in October always a risky endeavor; however, we have some long-range
signals that are clearer than usual. Continue reading if you want the scientific rationale.

Background and Assessment of Last Year’s Forecast
RaysWeather.Com has produced a long-range winter forecast for 18 years. Last year, we forecast less
than average snow, about average temperatures, and an early end to winter. The winter brought MUCH
less than average snow, warmer than average temperatures, and what little winter we had ended early.
Last winter had the second lowest snowfall total on record for many locations (only 2001-02 had less).

Table 2: Last Year’s RWC Fearless Winter Snowfall Forecast
 Location                          Forecast Actual      Actual - Forecast
 Asheville, NC                     12"      3”          -9”
 Banner Elk, NC                    39"      22”         -17”
 Beech Mountain, NC                78"      45”         -33”
 Boone, NC                         33"      9”          -24”
 Galax, VA                         18"      4”          -14”
 Hendersonville, NC                9"       3”          -6”
 Hickory, NC                       5"       1”          -4”
 Independence, VA                  18"      8”          -10”
 Jefferson and West Jefferson      19"      2”          -17”
 Lenoir, NC                        6"       0”          -6”
 Morganton, NC                     6"       1”          -5”
 Mt. Airy, NC                      9"       1”          -8”
 Old Fort, NC                      6"       2”          -4”
 Sparta, NC                        18"      4”          -14”
 Spruce Pine, NC                   19"      7”          -12”
 Sugar Mountain, NC                78"      66”         -12”
 Waynesville, NC                   14"      4”          -10”
 Wilkesboro and N. Wilkesboro      7"       0”          -7”
 Wytheville, VA                    20"      6”          -14”

Fearless Forecast Rationale
ENSO Analysis
The first consideration in a Winter forecast is always the current state and forecast for the El
Niño/Southern Oscillation (ENSO). ENSO is a measure of large-scale weather conditions in the Equatorial
Pacific. It fluctuates between El Niño (associated with warmer than average sea surface temperatures in
the Equatorial Pacific) and La Niña (associated with colder than average sea surface temperatures in the
Equatorial Pacific).
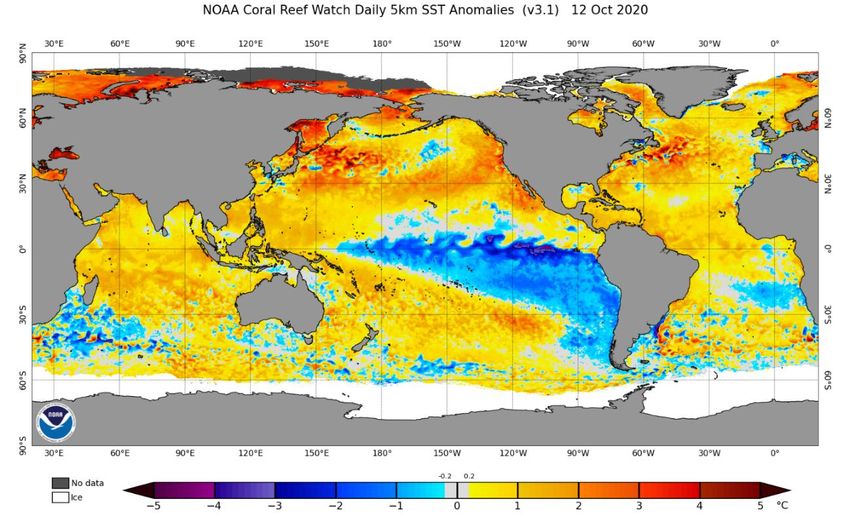
Currently, the ENSO is classified as La Niña. See the October 12 Sea Surface Temperature Anomaly
graphic (Figure 1) below. Note the blue shades stretching from the west coast of South America to
almost Papua New Guinea. That’s a clear signal of La Niña, and La Niña is expected to strengthen this
winter and continue until at least Spring 2021. Figure 2 shows current ENSO model forecasts showing a
strengthening La Niña. Some models show a strong La Niña by the heart of winter; however, for the
purposes of this winter forecast, we’ll favor the average showing that forecast a moderate La Niña.

                 Figure 1: Sea Surface Temperature Anomaly 10/12/2020
         (https://www.ospo.noaa.gov/Products/ocean/sst/anomaly/index.html)

                   Figure 2: Forecast for ENSO (from https://iri.columbia.edu/our-
                expertise/climate/forecasts/enso/current/?enso_tab=enso-sst_table)

Figure 3 (next page) shows snow data from Boone, NC. You see seasonal snow data for 61 years
classified by ENSO type (Strong El Niño through Strong La Niña). The graph also shows the long-term
average and a 10-year moving average. Note that moderate La Niña conditions generally have slightly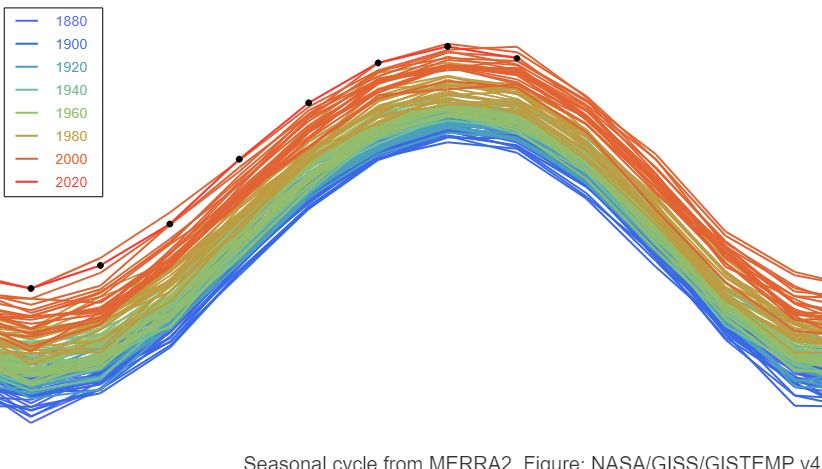
less than average snow and strong La Niña conditions have much less snow. Our snowfall forecast will
be in the middle of that range, but adjusted by other factors described below.

      Figure 3: Total Winter Snowfall in Boone, NC, Classified by ENSO (ENSO classifications derived from
             www.cpc.ncep.noaa.gov/products/analysis_monitoring/ensostuff/ensoyears.shtml)

Based on predicted ENSO conditions for this winter, we chose 7 Best Fit Winters with moderate to
strong La Niña conditions. These Best Fit Winters are: 1970-71, 1974-75, 1984-85, 1995-96, 2005-06,
2011-12, and 2017-18. Average total snowfall in the Best Fit Winters in Boone, NC, is 41", about the
same as the long-term average.

Figure 4 (next page) compares: Best Fit Winter Snowfall with La Nina Winters, and All Winters month by
month. There’s not much difference between the three; however, the coming winter might have a slight
lean toward a late start to winter.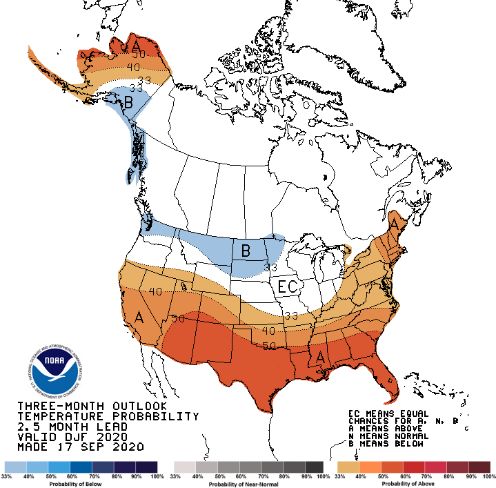
Figure 4: Snow totals from our Best-Fit Winters (1970-71, 1974-75, 1984-85, 1995-96, 2005-06, 2011-12, and
2017-18) compared with Moderate La Nina Winters and All Winters.
Snow totals shown are from Boone, NC.
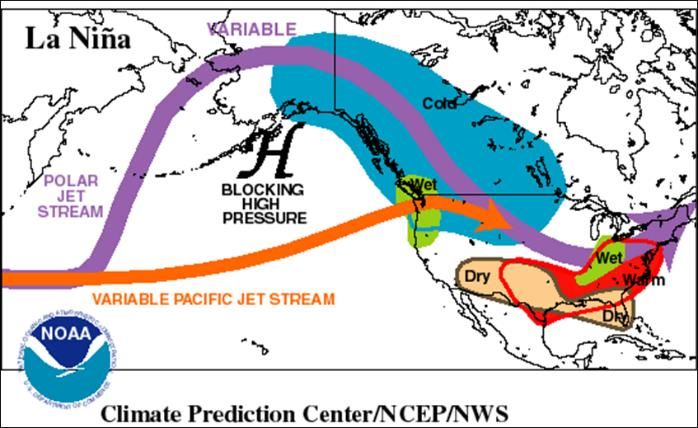
The winter pattern associated with La Nina
Winters is shown in Figure 5 to the right. On
average, La Nina winters feature a dominate jet
stream flow through Alaska, Western Canada, and
into the Great Plains. Lows tend to track through
the Ohio Valley leaving us in the warm sector.
However, once in a while, the storm track will be
farther south giving us a few snowfalls. NW flow
upslope snowfalls are also likely.
Figure 6 shows the latest NOAA Climate
Figure 5: Typical La Nina Weather Pattern
Prediction Center seasonal model forecast for (from https://www.weather.gov/iwx/la_nina)
December through February. It reflects almost
exactly the La Nina pattern described in Figure 5.
Figure 6 Latest NOAA Winter Forecast Probabilities
(from www.cpc.ncep.noaa.gov/products/predictions/long_range/seasonal.php?lead=3)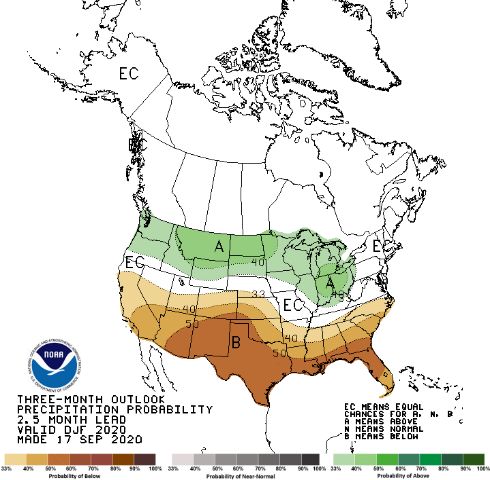
The main takeaways from the analysis of ENSO forecast for the coming winter are:
    1. About average snow primarily from an occasionally suppressed storm track and NW flow snow
       events at the end of rain events.
    2. Temperatures slightly warmer than average. We’ll have some cold snaps but sustained cold will
       be difficult to come by.
    3. A somewhat stronger La Nina (forecast by some models) would mean less snow. Given that
       possibility, our forecast will lean in that direction.
    4. The seasonal forecast from the European model is consistent with a warmer/drier than average
       winter.

Climate Change
Climate change is real. If you are interested in a good source of scientific data and analysis on the
subject, see http://climate.nasa.gov/evidence/. Figures 7 and 8 show broad measures of climate change
effects. Figure 7 shows the extent of Artic Ice. At the time this forecast is being written, the Artic Sea ice
is equal to the least ever recorded at this time of year. Figure 8 shows month-by-month average
temperature in North America year over year. Every month in 2020 has been in the top three warmest
ever recorded in North America.

                                                             Figure 8: Average Temperature in North America
      Figure 7: Extent of Arctic Ice (from
                                                                     Month-by-Month, Year over Year
         nsidc.org/arcticseaicenews/)
However, the effects of climate change are not linear or uniform in either time or from region to region.
Warming, that has been experienced across most of the world, has not evidenced itself as strongly in
the Southeast U. S. as in some parts of the world.

Figure 9 shows a 10-year sliding average of seasonal snowfall for Boone NC. 2009-10 was an
impressively snowy winter. In the current 10-year average 2009 was replaced by 2019-20 (the second
lowest snow total in recorded history). While it’s difficult to detect warming average temperatures in
NW NC, it’s easy to see from Figure 9 that the trend for average snowfall is downward. The current 10-
year average now, is roughly half the average in 1966-67.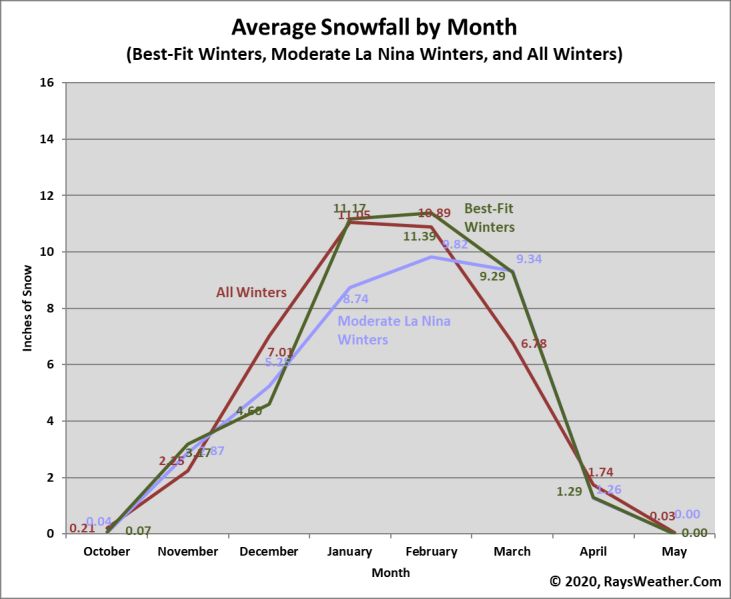
Figure 9: 10-Year Average Seasonal Snow in Boone, NC

Takeaway: Any prudent seasonal forecast must lean toward warmer and less snow compared to long-
term averages because of climate change.

The North Atlantic Oscillation and Arctic Oscillation Wildcards
Every year, the North Atlantic Oscillation (NAO) and the Arctic Oscillation (AO) are the biggest wildcards
for long-range winter forecasts in the Eastern U. S. The NAO index is based on the pressure difference
between the Icelandic low and Azores high. The Arctic Oscillation describes the state of atmospheric
circulation over the Arctic. (See climate.ncsu.edu/climate/patterns/nao for details.) These indicators
tend to move together and have an enormous impact on winter weather. Both a negative NAO and
negative AO generally correlate to cold and snow in the Eastern U. S.

We do have limited modelling for a 6-week NAO/AO forecast. The European Model for the next 45 days
suggests that once we get past cooler temperatures coming the 3 rd weekend of October, we may wait
for another significant cold snap until late November when the NAO and AO might turn negative.

However, two factors give us caution regarding climate change and the NAO/AO:
   1. Some evidence exists that warmer than average sea surface temperatures in the Gulf of Alaska
      and just off the NE U. S. Coast (as exists currently) tend to promote negative AO and negative
      NAO.
   2. Evidence also exists that warming at the poles has actually increased the likelihood for a
      negative NAO and negative AO during the winter.

Summary
Every year, I caution readers to NOT put too much stock in this or any other long-range forecast; pure
luck and the AO/NAO will have their say before winter ends. Furthermore, always discard any long-
range forecast that lacks a scientific rationale. With all the prudent disclaimers… here's what we think:
    • Snow totals about 20% less than the long-term average and closer to the 10-year average.
    • Overall temperatures 1-2 degrees warmer than average.
    • While we will have snow and cold periods, it will be difficult to lock in cold for long periods of
        time.
You can also read