Supplement of The unidentified eruption of 1809: a climatic cold case
←
→
Page content transcription
If your browser does not render page correctly, please read the page content below
Supplement of Clim. Past, 17, 1455–1482, 2021
https://doi.org/10.5194/cp-17-1455-2021-supplement
© Author(s) 2021. CC BY 4.0 License.

Supplement of
The unidentified eruption of 1809: a climatic cold case
Claudia Timmreck et al.

Correspondence to: Claudia Timmreck (claudia.timmreck@mpimet.mpg.de)

The copyright of individual parts of the supplement might differ from the article licence.
1   Circulation Indices

     We consider four climate indices, namely the Pacific/North American pattern (PNA) index, the North Atlantic Oscillation
     (NAO) index, and the North Pacific Index (NPI) to describe NH (winter) variability and the Southern Oscillation Index (SOI),
     to describe tropospheric variability. Definitions and indices are the same as described in Zanchettin et al. (2015):
                                                                                                  ∗                         ∗
5        – The PNA index is applied to 500 hPa geopotential height (Z500) data. It is defined as Z[15˘25◦ N ;180˘220◦ E] - Z[40˘50◦ N ;180˘220◦ E]
               ∗                        ∗                               ∗
           + Z[45˘60◦ N ;235˘255◦ E] - Z[25˘35◦ N ;270˘290◦ E] , where Z denotes monthly mean and spatial averaged Z500 anomalies
           from the respective climatological value, with the suffix [x] for the region x.
         – The NAO index is calculated based on the latitude–longitude two-box method from Stephenson et al. (2006) applied
           on Z500 data, i.e., as the pressure difference between spatial averages over 20–55◦ N; 90◦ W–60◦ E and 55–90◦ N;
10         90◦ W–60◦ E.
         – The NPI is calculated using the definition from Trenberth and Hurrell (1994) applied to sea level pressure (SLP) data.
           The index is computed as spatial SLP averaged over 30–65◦ N; 160–220◦ E, so that positive phases of the index indicate
           a weaker-than-normal Aleutian low and the opposite holds for the negative phases.
         – The SOI is defined as the difference between the average SLP over the domains 20–15◦ S; 147–152◦ W and 15–10◦ S;
15         128.5–133.5◦ E.
     All indices are calculated on a monthly basis. For each simulation, indices are standardized based on the average and standard
     deviation calculated for the period 1800-1808. If not mentioned otherwise, anomalies in the volcanically-forced ensembles are
     defined as deviations with respect to the corresponding 1800-1808 average.
        Post-eruption anomalies of select large-scale atmospheric circulation indices from the simulations are shown in Fig.S1. We
20   consider changes in a mode of large-scale atmospheric circulation to be significant when the ensemble distribution of the
     associated index excludes the zero value within the interquartile range. Accordingly, for the NAO there is no significant change
     from the pre-eruption state for both winter 1809/1810 and summer 1810, with the exception of the High ensemble in summer
     which has a tendency toward a more negative state of the NAO (Fig. S1 a)). The NAO reconstruction by Ortega et al. (2015)
     indicates a weakly positive anomaly in winter 1809/1810 (not shown). A similar lack of significant post-eruption anomalies is
25   detected for the PNA, for which only negative winter anomalies from the nNHP ensemble and negative summer anomalies for
     the High ensemble occur (Fig. S1 b)). Uncertainties affecting currently available PNA reconstructions (Zanchettin et al., 2015;
     Franke et al., 2017) prevent deeper insights on the potential role of the PNA for the post-1809 climate anomalies. We therefore
     only highlight the overall low signal-to-noise ratio of PNA anomalies in 1810 in all our ensembles. The NPI is strongly inversely
     correlated with the PNA, hence there is a significant tendency towards positive post-eruption winter anomalies in nNHP (Fig.
30   S1 c)). Further, significant anomalies of opposite signs are detected in summer, negative for Best and positive for nNHP, the
     latter with a narrow distribution as shown by the tight whisker plot. Although the PNA is mostly active in NH winter and is
     therefore negligible for the NH summer circulation, the weakening of the summer Aleutian Low is expressed by the positive
     NPI index in nNHP which is compatible with the Western North American cooling in the reconstructed temperature pattern
     (Fig. 3 in the paper). The SOI shows significant post-eruption anomalies in the High ensemble in winter (negative) and in the
35   High and Best ensembles in summer, the latter with opposite signs (Fig. S1 d)). Overall, the results illustrate the substantial
     differences in the post-eruption evolution of continental and subcontinental climates that can be produced by internal climate
     variability and forcing structure through changes in the large-scale atmospheric circulation, as seen by the spread of responses
     within individual ensembles (often as large as the range of pre-eruption variability) and by the possibility of non-overlapping
     response distributions generated by different forcings (seen for, e.g., the NPI and SOI indices in summer 1810).

                                                                       1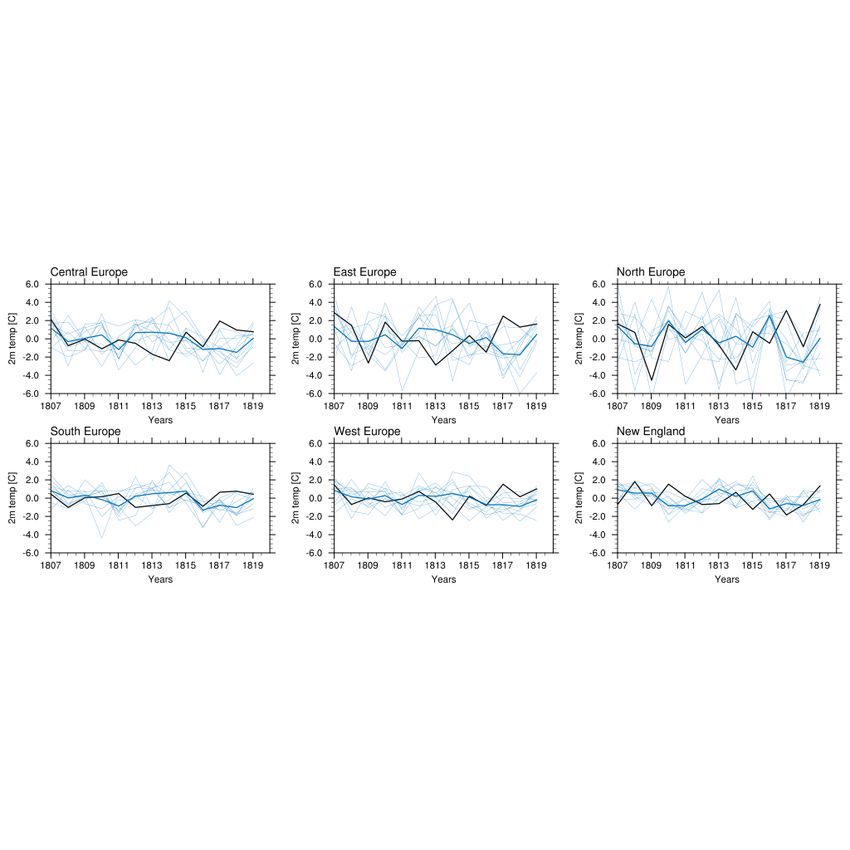
Figure S1. Atmospheric circulation indices. Box-Whisker plots (median, 25th-75th and 5th-95th percentile ranges) of seasonal anomalies
of circulation indices: a) North Atlantic Oscillation (NAO), b) Pacific/North American pattern (PNA), c) the North Pacific Index (NPI) and
d) the Southern Oscillation Index (SOI) from the model experiments for the first post-eruption winter (1809/1810, DJF) and second post-
eruption summer (1810, JJA) following the 1809 eruption. Pre-eruption (1800-1808) data, shown as grey Box-Whisker plots, are used to
standardize the indices (see Methods)

                                                                    2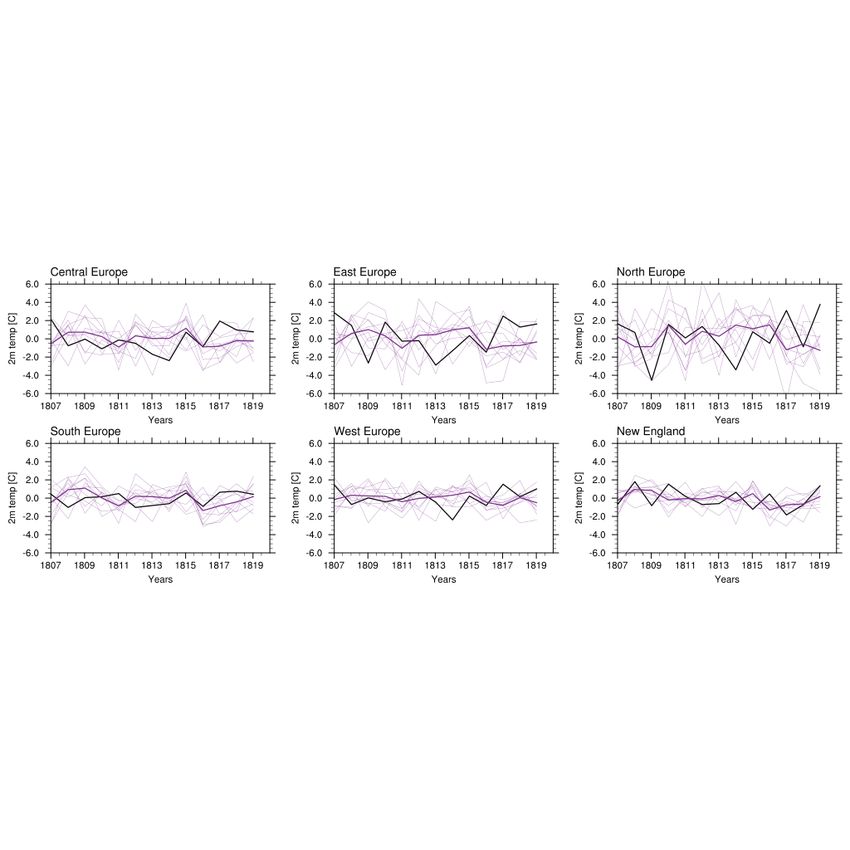
40   2   Supplementary figures

     Figure S2. Global stratospheric aerosol optical depth (SAOD) at 0.55µm as provided in CMIP6 (Luo, 2018) based on the Global Space-based
     Stratospheric Aerosol Climatology (GLOSSAC, Thomason et al., 2018).

     Figure S3. Mean surface temperature anomalies (◦ C) for boreal summers of 1815 in NH TR data N-TREND (S) (Anchukaitis et al., 2017).
     Anomalies are with respect to the 1800-1808 climatology.

                                                                       3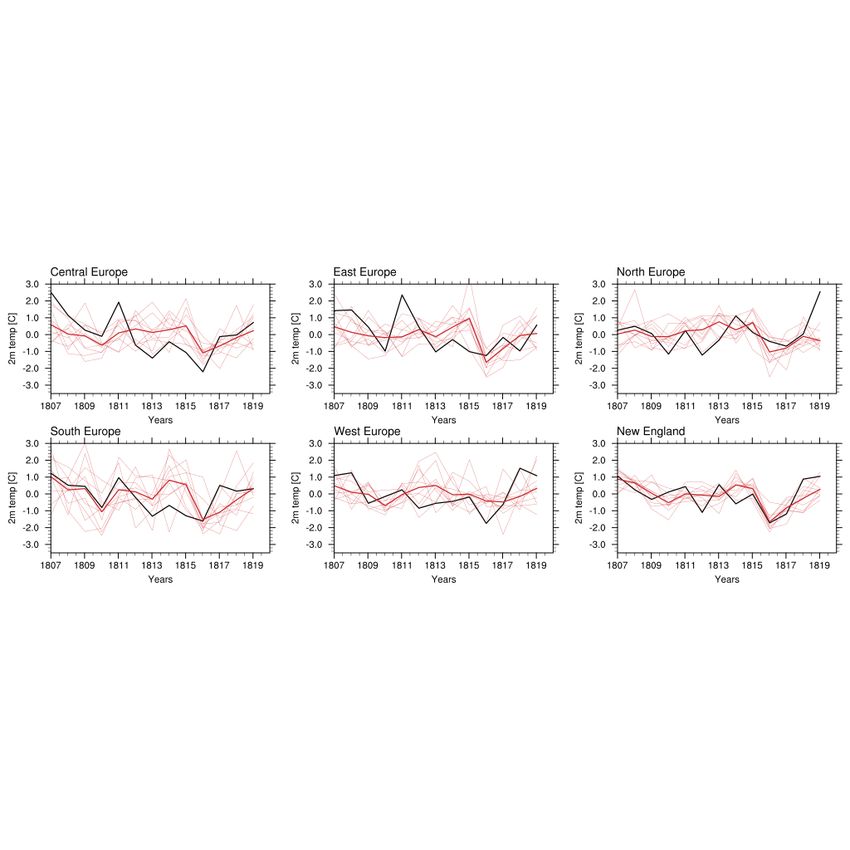
Figure S4. Simulated ensemble mean zonal mean near-surface air temperature anomalies (◦ C) for the Best, Low, High and nNHP scenarios.
Left panel: land right: ocean. Only those anomalies are shown which exceed one standard deviation of the control run. Anomalies are
calculated with respect to the 1800 to 1808 mean.

                                                                  4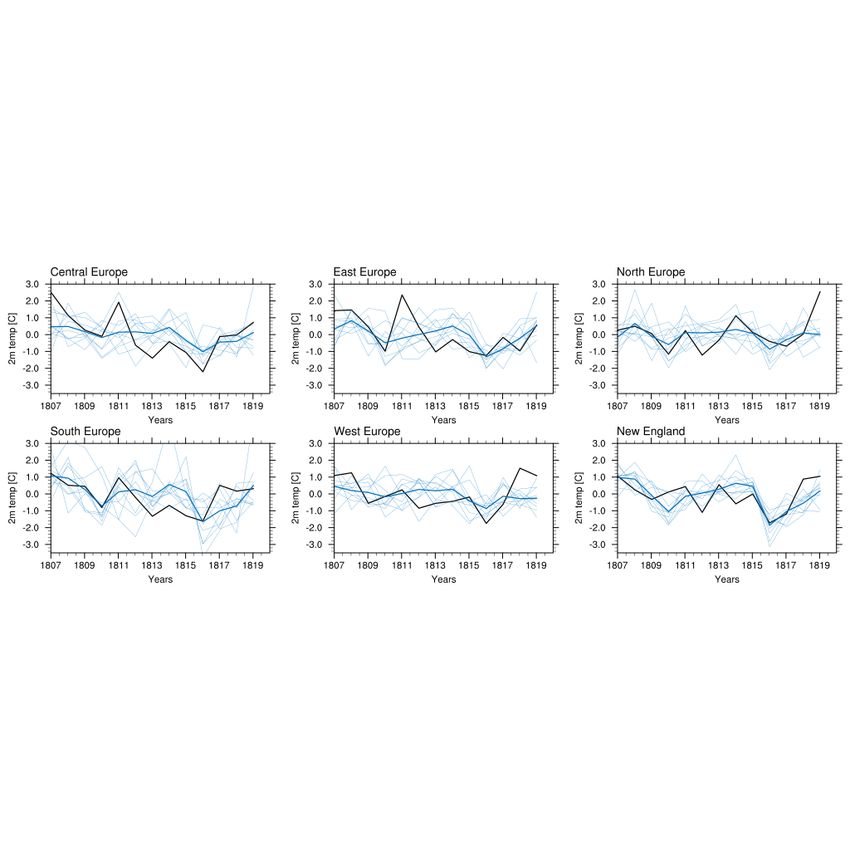
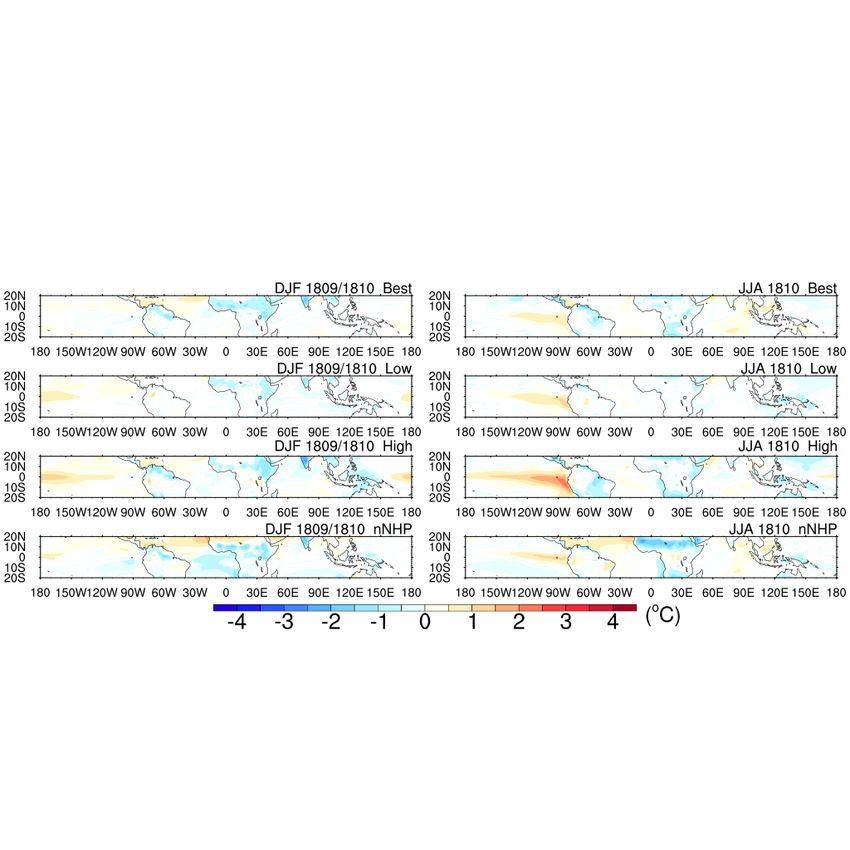
Figure S5. Seasonal mean relative sea surface temperature anomalies in the tropical regions. Simulated ensemble-mean relative sea surface
temperature anomalies for the 1st winter (1809/1810) and the second summer (1810) after the 1809 eruption for the four different MPI-ESM
simulations. Shaded regions are significant at the 95% confidence level according to a t-test. Anomalies are calculated with respect to the
period 1800-1808.

                                                                    5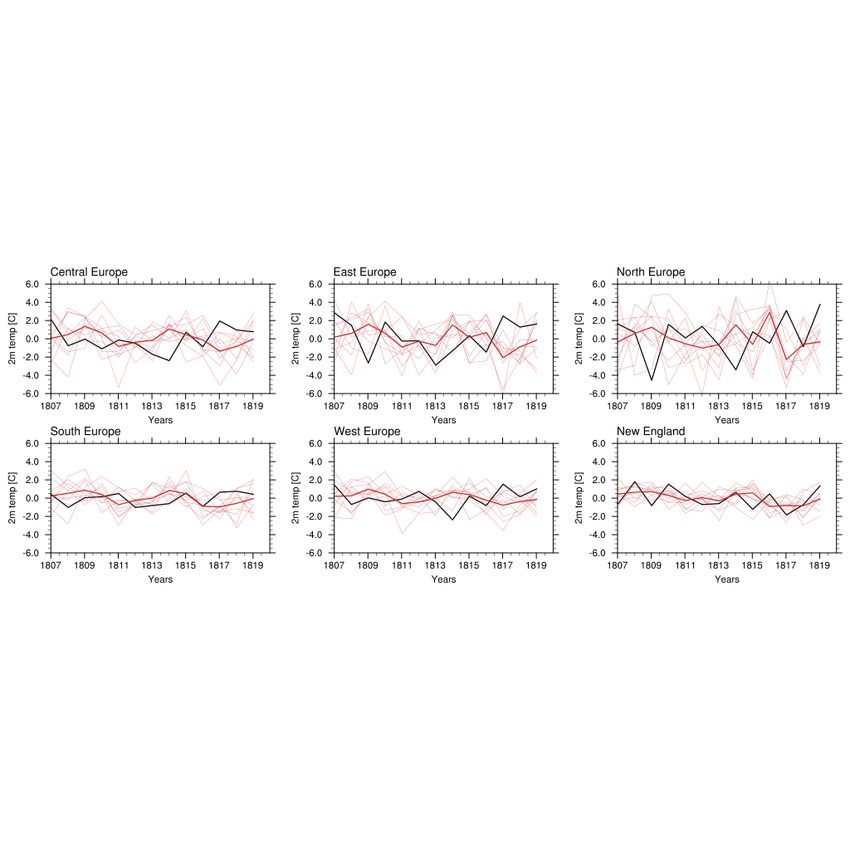
Figure S6. Impact of limited sampling on the average tropical surface air temperature (SAT) anomalies in the MPI-ESM simulations. (top),
EEIC and MPI-ESM tropical SAT anomalies, the solid colored lines show the overall simulated tropical (30◦ S-30◦ N) average values, while
the dashed lines show the average of model points corresponding to the EEIC measurements. (bottom). Difference between the model values
(Full sampling - EEIC sampling).

                                                                   6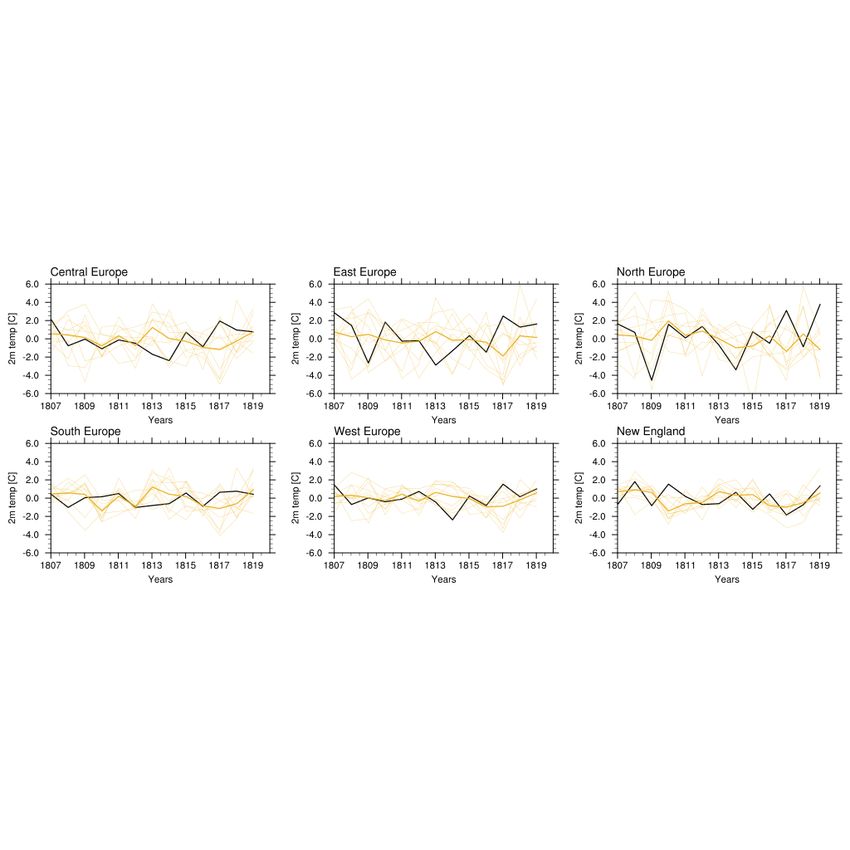
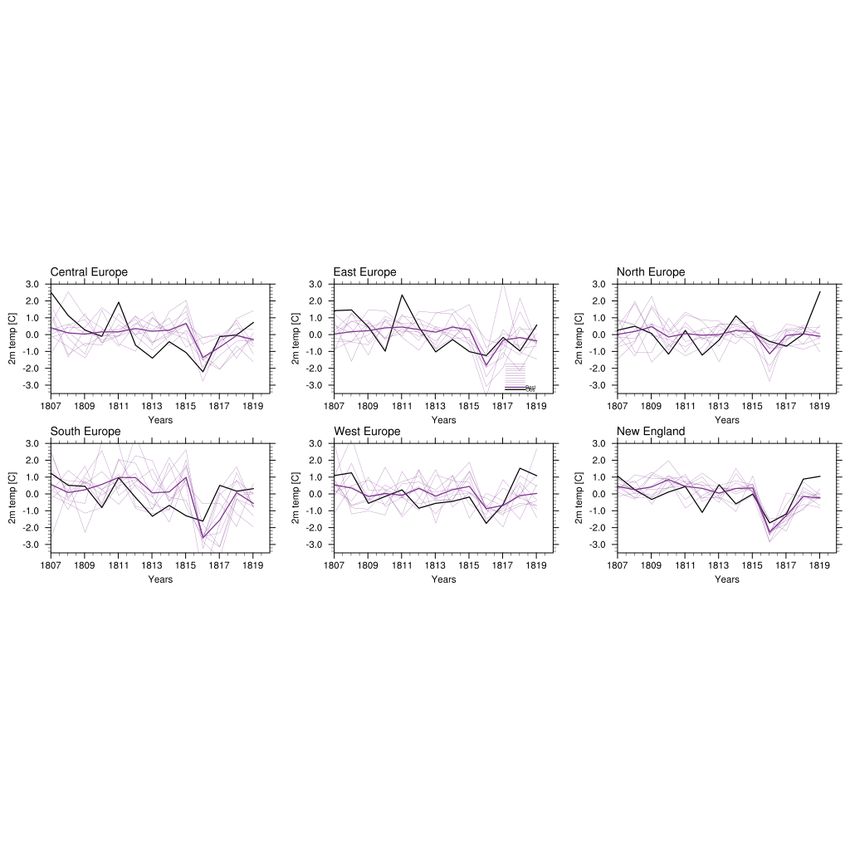
Figure S7. Monthly mean near-surface summer temperature anomalies (◦ C) over different European regions (Central Europe (46.1-52.5◦ N,
6-17.8◦ E), Eastern Europe (47-57◦ N, 18-32◦ E), Northern Europe (55-66◦ N, 10-31◦ E), Southern Europe (38- 46◦ N, 7°-13.5◦ E), Western
Europe (48.5-56◦ N, 6◦ W-6◦ O) and New England (41-44◦ N, 73-69◦ W). The black line represents observations, the thick colored line the
ensemble mean of the Best simulations, the thin lines the individual ensemble members. Anomalies for model and station data are with
respect to the seasonal mean between 1806 and 1820.

Figure S8. Same as Figure S7 but for Low.

                                                                  7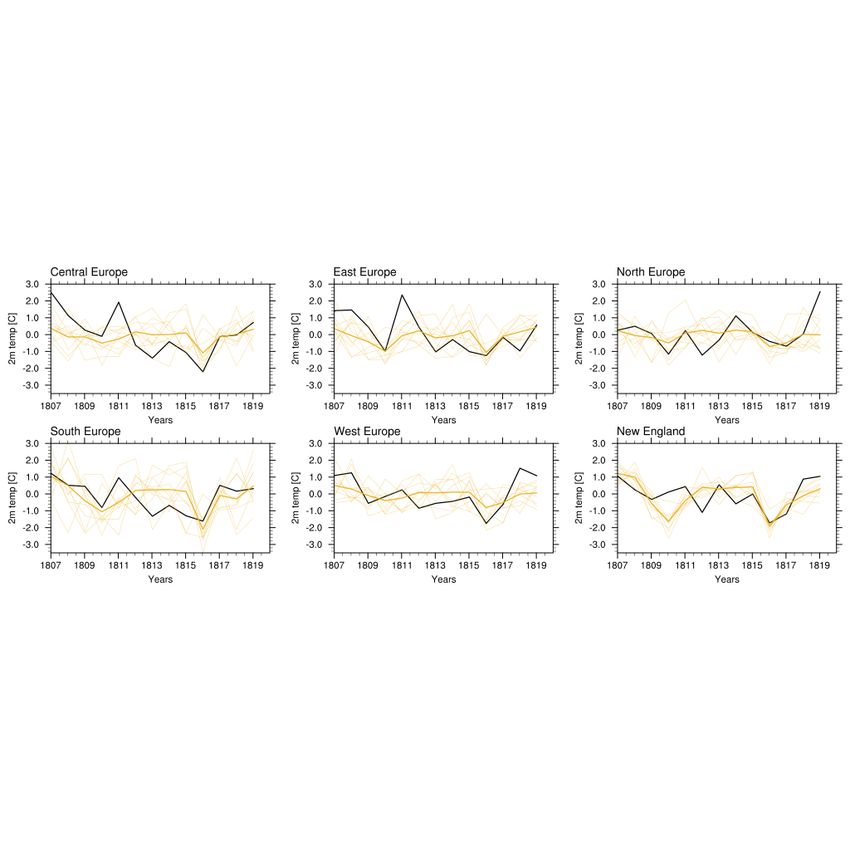
Figure S9. Same as Figure S7 but for High.

Figure S10. Same as Figure S7 but for nNHP.

                                              8
Figure S11. Same as Figure S7 but for seasonal mean near-surface NH winter temperature anomalies (◦ C). The year denotes the February
month
Figure S12. Same as Figure S8 but for seasonal mean near-surface NH winter temperature anomalies (◦ C). The year denotes the February
month.
9Figure S13. Same as Figure S9 but for seasonal mean near-surface NH winter temperature anomalies (◦ C). The year denotes the February
month.
Figure S14. Same as Figure S10 but for seasonal mean near-surface NH winter temperature anomalies (◦ C). The year denotes the February
month.
10References
Anchukaitis, K. J., Wilson, R., Briffa, K. R., Büntgen, U., Cook, E. R., D’Arrigo, R., Davi, N., Esper, J., Frank, D., Gunnarson, B. E.,
et al.: Last millennium Northern Hemisphere summer temperatures from tree rings: Part II, spatially resolved reconstructions, Quaternary
Science Reviews, 163, 1–22, 2017.
45 Franke, J., Brönnimann, S., Bhend, J., and Brugnara, Y.: A monthly global paleo-reanalysis of the atmosphere from 1600 to 2005 for studying
past climatic variations, Scientific data, 4, 170 076, 2017.
Luo, B.: Stratospheric aerosol data for use in CMIP6 models, ftp://iacftp.ethz.ch/pub_read/luo/CMIP6/Readme_Data_Description.pdf, (last
access: 12 August 2019), 2018.
Ortega, P., Lehner, F., Swingedouw, D., Masson-Delmotte, V., Raible, C. C., Casado, M., and Yiou, P.: A model-tested North Atlantic
50 Oscillation reconstruction for the past millennium, Nature, 523, 71–74, 2015.
Stephenson, D., Pavan, V., Collins, M., Junge, M., Quadrelli, R., et al.: North Atlantic Oscillation response to transient greenhouse gas
forcing and the impact on European winter climate: a CMIP2 multi-model assessment, Climate Dynamics, 27, 401–420, 2006.
Thomason, L. W., Ernest, N., Millán, L., Rieger, L., Bourassa, A., Vernier, J.-P., Manney, G., Luo, B., Arfeuille, F., and Peter, T.: A global
space-based stratospheric aerosol climatology: 1979-2016, Earth System Science Data, 10, 469–492, 2018.
55 Trenberth, K. E. and Hurrell, J. W.: Decadal atmosphere-ocean variations in the Pacific, Climate Dynamics, 9, 303–319, 1994.
Zanchettin, D., Bothe, O., Lehner, F., Ortega, P., Raible, C., and Swingedouw, D.: Reconciling reconstructed and simulated features of the
winter Pacific/North American pattern in the early 19th century, Climate of the Past, 11, 939–958, 2015.
11You can also read