How to detect hyporheic exchanges of water along a river? Thermal infrared remote sensing versus discrete hyporheic measurements - Graie
←
→
Page content transcription
If your browser does not render page correctly, please read the page content below

I.S.RIVERS 2018

               How to detect hyporheic exchanges of water along a
               river? Thermal infrared remote sensing versus
               discrete hyporheic measurements
               Comment détecter les échanges hyporhéiques le long
               d’un cours d’eau ? Imagerie thermique infra-rouge
               versus mesures hyporhéiques ponctuelles

               Dole-Olivier M.J.1, Wawrzyniak V.2 Creuzé des Châtelliers M.1 &
               Marmonier P.1
               1Universitéde Lyon, Université Lyon 1, UMR-CNRS 5023 LEHNA, 43
               Boulevard du 11 Novembre 1918, 69100 Villeurbanne.
               marie-Jose.olivier@univ-lyon1.fr, michel.deschatelliers@univ-lyon1.fr,
               pierre.marmonier@univ-lyon1.fr
               2Ecole Nationale des Mines de Saint Etienne, UMR-CNRS 5600 EVS, 158

               Cours Fauriel, 42023 Saint-Etienne. vincent.wawrzyniak@gmail.com

RÉSUMÉ
Les échanges d'eau à travers la zone hyporhéique sont cruciaux pour de nombreux processus
écologiques dans les cours d'eau. L’un des défis majeurs actuels est la mise au point d’une
méthodologie pour la localisation de ces échanges, utilisant une technique d'acquisition rapide de
données. Ce travail compare des données continues, acquises par imagerie Thermique Infrarouge
(TIR), avec des données discrètes, recueillies sur les zones d’échanges attendus (bancs de graviers).
Quarante bancs, répartis le long de la rivière d’Ain, ont été échantillonnés en amont et en aval (80
sites). Sur chaque site, 4 paramètres physico-chimiques ont été mesurés à 0, -20 et -50 cm sous la
surface des sédiments. La campagne de collecte d'images TIR a été menée de manière
concomitante. Les deux approches donnent des informations complémentaires. Dans les zones où
des images TIR et des mesures de terrain sont disponibles, le diagnostic est similaire à 85%.
Néanmoins, alors que la cartographie TIR fournit une image exhaustive des zones d’apport d’eau
souterraine, les mesures de terrain ne détectent pas certains sites d’apport d’eau souterraine
positionnés entre les bancs. Par contre, ces mesures ponctuelles de terrain repèrent très bien les
zones de downwelling (infiltration de l'eau de surface), qui ne sont pas détectées par les images TIR,
mais qui représentent pourtant des hotspots hyporhéiques pour les invertébrés benthiques.
ABSTRACT
Water exchanges through the hyporheic zone are crucial for many ecological processes in streams.
One important challenge is to find a methodology for the localization of these exchanges using
techniques of rapid data acquisition. This work compares continuous data, acquired by Thermal
InfraRed (TIR) technique, with discrete data collected at sites of expected water exchanges (gravel
bars). Forty gravel bars, distributed along the Ain River were sampled at upstream- and downstream-
bar positions (80 sites). At each site, 4 physico-chemical parameters were measured at 0, -20 and -50
cm beneath sediment surface. The campaign to collect TIR images was conducted concomitantly. The
two approaches give complementary information. In areas where infrared maps and field
measurements were available, the diagnostic was similar at 85%. The TIR images gave an exhaustive
picture of groundwater discharge areas, whereas field measurements, missed groundwater discharge
sites located between the bars. Nevertheless, discrete field measurements documented other
processes in downwelling areas (infiltration of surface water), which were not captured by TIR images,
but represent hyporheic hotspots for benthic invertebrates.
MOTS CLES
Ground water, sediment interstices, streams, large-scale remote sensing, physico-chemical

                                                  1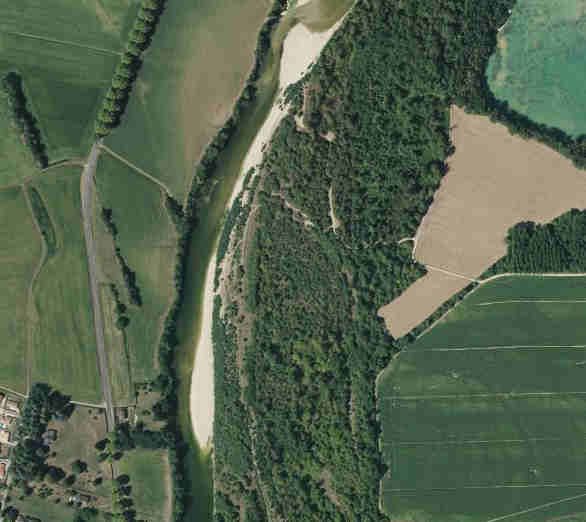
I.S.RIVERS 2018

1      INTRODUCTION
Water exchanges through the hyporheic zone are crucial for many ecological processes in streams.
One important challenge is to find a methodology for the localization of these exchanges at large scale
using techniques of rapid data acquisition.
Thermal infrared (TIR) remote sensing allows for scanning large geographic areas and is valuable for
the identification of thermal anomalies along rivers (Wawrzyniak et al., 2016). However, temperature
records are limited to the top millimeters of the water surface, missing the diffuse exchanges located
deeper.
The present study compares two different approaches: the Thermal InfraRed (TIR) remote sensing,
allowing spatially continuous acquisition of data at the water surface, and in situ Discrete Hyporheic
Measurements (DHM), allowing spatially discontinuous acquisition of data ( = from station to station)
collected directly on the river bottom and into the hyporheic zone.

2      MATERIAL AND METHODS
This study took place in the lowest 40 km reach of the Ain River (France), where we compared
continuous data, acquired by TIR technique, with discrete data collected at sites of expected water
exchanges (gravel bars). Forty gravel bars, distributed along the Ain River were sampled at upstream-
and downstream-bar positions (80 sites). At each site, four physico-chemical parameters
(temperature, electric conductivity, oxygen content and vertical hydraulic gradient) were measured at
0, -20 and -50 cm beneath sediment surface using mini-piezometers (1.5 cm diameter, Fig.1). Data
were acquired at low discharges and warm water in the stream in order to maximize thermal contrasts
between surface and ground water. The campaign to collect TIR images was conducted
concomitantly.

            A                                                                                         C

                 Measures in piezometers

                                                                 Sediment
            B                                                    surface                              D

     Figure 1. A: Hyporheic flowpaths in a gravel bar. B: location of sampling stations and sampling design. C-D:
    Example of aerial photo and corresponding TIR image in the studied sector of the Ain river (© IGN - 2012 - BD
       ORTHO® Ain). Black areas at the border of the channel (arrows) are points of groundwater upwellings.

3      RESULTS
In the DHM method, the use of temperature and specific conductance leads to distinguish different
hydrologic exchanges classified as strong / weak upwellings of ground water (groups 1-2, Fig.2), and
strong / weak downwellings of surface water (groups 3-4, Fig.2). The detection of cold-water patches
reveals the heterogeneous distribution of upwellings along the study reach. Similar longitudinal pattern
was observed when compared to cold-water patches obtained by TIR method (Fig.3), although the
number of cold-patches was higher with TIR due to the continuous nature of data acquisition with this
method. Only 15% of the cold patches detected by DHM were not observed by TIR. In addition to
upwellings, the DHM method also reveals the downwelling areas which are not captured by IR
imaging.

                                                         2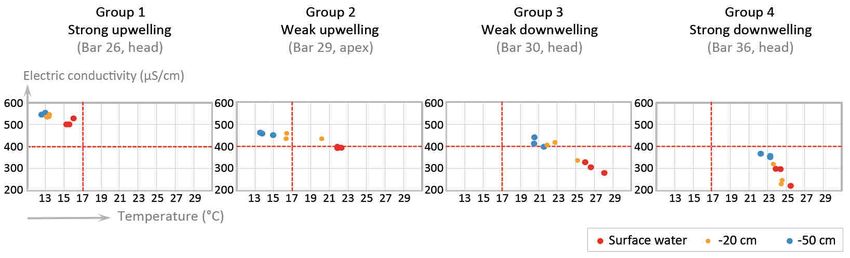
I.S.RIVERS 2018

    Figure 2. Classification of the stations according to the electric conductivity and the temperature of the surface
                                                  and hyporheic waters.
                                                                   Pont-d‛Ain                                                      Pont-d‛Ain
                                                                                0                                                               0
                                                  A                                              B

                                                              10                                                              10

                                                      20                                                     Chazey
                                                                                                                      20
                                             Chazey
                                             /Ain                                      Areas of              /Ain
                                                           Lower Ain                water exchanges                        Lower Ain
                                                             River                   weak upwelling                          River
                         Areas of
                                                                                     strong upwelling
                    cold-water patches
                                                                                     weak downwelling
                       2 - 950 m²
                       950 - 4200 m²                                                 strong downwelling
                                                                                     Prohibited
                      Prohibited
                                                                                     airspace of Bugey
                      airspace of Bugey
                                                                                     nuclear power plant        30
                      nuclear power plant        30

                                  Port-Galland                                                  Port-Galland
                                                                      N

                                        40                 0 1 2     4                                  40
                                                                         km

Figure 3: Cold-water patches observed using TIR remote sensing (A) and DHM method (B). The discretisation of
  patch surfaces for TIR method is based on the mean and the standard deviation. The size of circles for DHM
   method is based on temperature and electric conductivity profiles (see Fig.2). The background is a 50 cm
                           resolution aerial photo (© IGN - 2012 - BD ORTHO® Ain).

4      DISCUSSION-CONCLUSION
The TIR images gave an exhaustive picture of groundwater discharge areas, whereas field
measurements, missed sites located between the bars. Unlike TIR method, DHM detected also
downwelling areas and as such, documented other physical and biological processes (infiltration of
oxygen, dissolved and particulate organic matter, microbes, invertebrates, fish larvae… into the
hyporheic zone). These areas not captured by TIR images, however represent hyporheic hotspots for
benthic animals. Ecological studies and stream quality controls should take into account not only
groundwater upwellings but also surface water downwellings, and fully integrate them into their
management plans.

BIBLIOGRAPHIE
Wawrzyniak, V., Piégay, H. Allemand, P., Vaudor, L., Goma, R. and Grandjean, P. (2016). Effects of
  geomorphology and groundwater level on the spatio-temporal variability of riverine cold water patches
  assessed using thermal infrared (TIR) remote sensing. Remote Sensing of Environment 175, 337-348

                                                                                3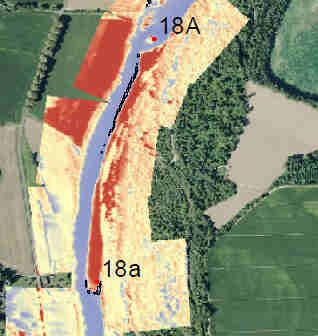
You can also read