Radon mapping in Piemonte (North-West Italy): a radio-geolithological approach - Arpa Piemonte, Italy
←
→
Page content transcription
If your browser does not render page correctly, please read the page content below
Radon mapping in Piemonte (North-West Italy): a
        radio-geolithological approach

        Mauro Magnoni, Enrico Chiaberto, Paolo Falletti

                    Arpa Piemonte, Italy

    EUROPEAN RADON WEEK, VIENNA 24-28 FEBRUARY 2020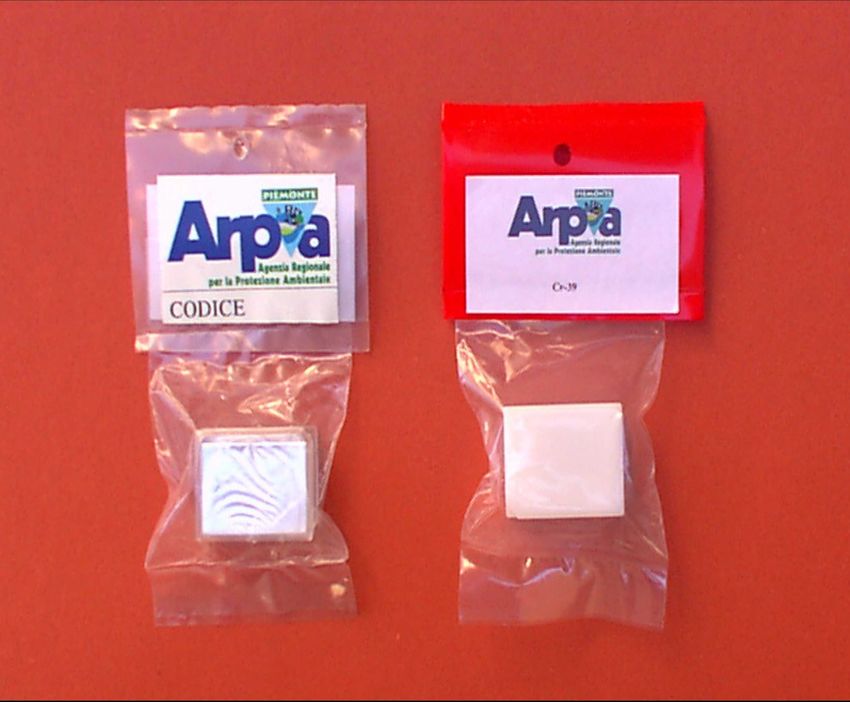
Radon mapping in Piemonte

• The first radon campaing in Piemonte
  (North-West Italy) dates back to the
  Nineties of the previous century: in 1990 a
  regional surveys involving about 450
  dwellings started as a part of the Italian
  National Radon Survey
• The National Radon Survey was principally
  aimed to give an estimate of the average
  exposure to radon of the Italian population
• Therefore, a stratified sampling scheme was
  used, considering all the towns above
  100,000 inhabitants (50) and 150
  towns/villages under 100,000 inhabitants
  randomly chosen, giving a total of 39 strata
• In each strata the dwellings were randomly
  sampled
• Obviously, following this approach, the
  survey was able to give only average values
  at regional level: local details were
  completely missed
• This was the
  general picture
  given by the
  First National
                        1991
  Survey: just        Piemonte
  regional         Annual Average:
                      69 Bq/m 3
  average annual
  levels, no local
  details
  available
                                     Italian Annual Average
                                             70 Bq/m3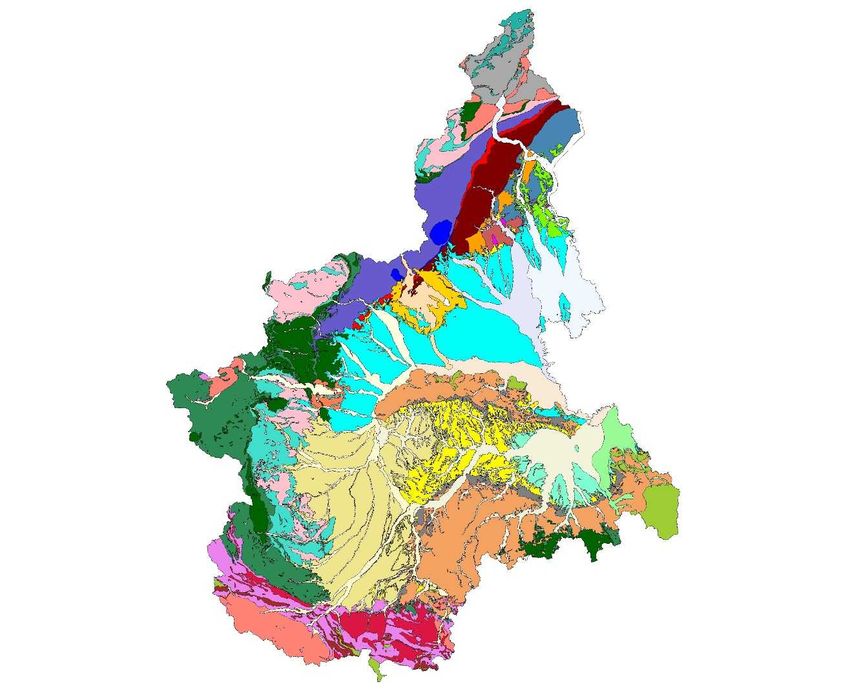
• The need of more detailed radon maps of
  the Italian territory is thus evident: the
  Regions (21 Regions/Autonome Provinces)
  were charged with this task, accordingly to
  the provisions established by the law
• However, no common rules were defined at
  national level: each Region developed its
  own approach, based on different
  assumptions and methodology
• Our approach was a
   combination of two
   very different methods:
- experimental method, i.e.
direct long term (1 year)
measurements of radon in
dwellings
- radio-geolithological
method, based on the
characteristics of the rocks,
including radioactivity
• The mapping methodology wasn’t developed
  following an a priori theoretical framework
  clearly established in advance: it was rather a
  process of adaption to the conditions that we
  were faced:

-   Regione Piemonte: 25,400 km2
-   About 4,500,000 inhabitants
-   About 1,200 municipalities
-   Average indoor radon concentration: 69 Bq/m3
Indoor radon distribution
                        Distribuzione Radon Piemonte

                   40
                   35
  Frequenza (% )

                   30
                   25
                   20
                   15
                   10
                    5
                    0

                                      Bq/m 3

• Estimation of the % of dwellings exceeding a
  given level:
> 400 Bq/m3       ≈ 0.5 %
> 200 Bq/m3       ≈ 2.9 %
• At the beginning of 2000, the knowledge of
  the radon distribution in Piemonte either in
  dwellings or workplaces was very poor: after
  the National Survey only a few indoor radon
  measurements were performed, involving in
  particular some little villages and towns
  where radon was supposed to be present in
  anomalous concentrations
• A new monitoring program was then set up
  in order to obtain a quite detailed map of the
  distribution of the radon indoor activity
  concentration through the Region
• In order to make a radon map, several
  technical approaches are possible. All of
  them can be grouped in two general broad
  categories:

a) Experimental approach: direct radon
   measurements of a representative sample
   of dwellings of the indoor radon activity
   concentration in the given sampling units
b) Calculation of “radon potential” from the
   geological characteristic of soils and rocks:
   geolithological approach
• However, before the choice of a mapping
  approach, another question needs to be
  addressed: the definition of the number and the
  size of the sampling units
• This issue is strictly related to another
  fundamental question to be answered: how much
  detailed should be a “good” regional radon map ?
• In principle a radon map should be able to
  describe with accuracy the radon levels in any
  single location
• A huge number of experimental data would be
  necessary
• Assuming as sampling unit the municipalities
  (about 1200), even with a small number only
  measurement points per sampling unit (5-6),
  the total number of experimental data
  needed to cover all the Region would
  exceed 6,000
• These would have required an effort that
  would have gone beyond our logistical and
  economic capabilities
• On the other hand, a substantial reduction of
  the number of sampling units would have
  brought to an unacceptable loss of details,
  leading to an almost useless map
• In the end, in spite of their high number, the
  municipalities were taken as basic sampling
  units
• This decision was driven also by some
  “political reasons”: the municipality is the
  smaller administrative unit in Italy, where
  prevention policies must be implemented
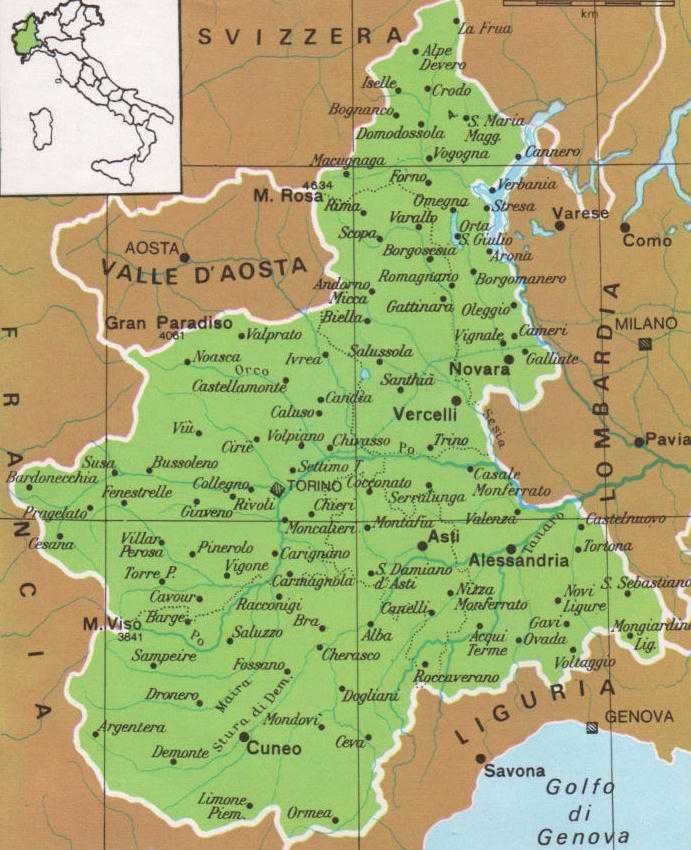
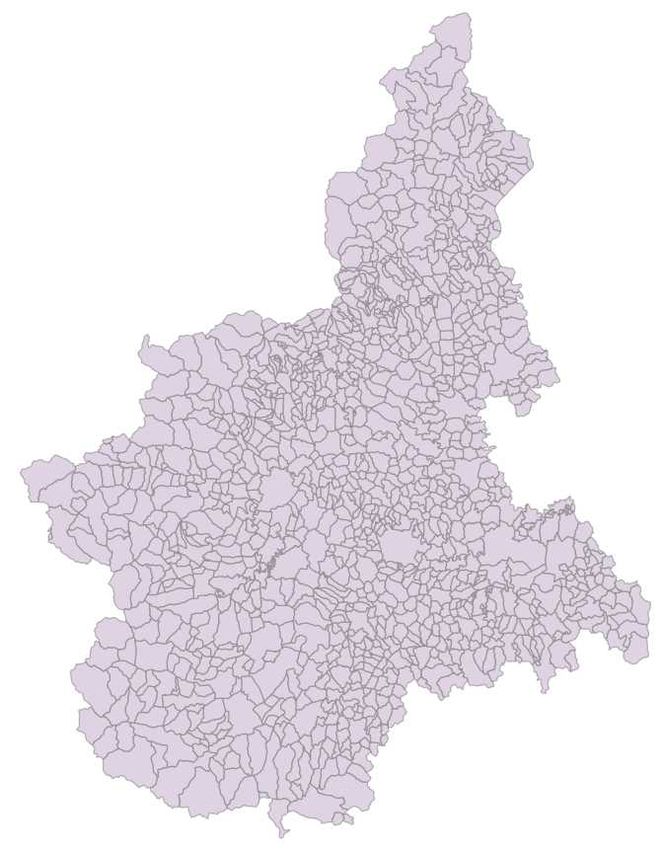
Administrative subdivision of
       Piemonte in 2020

• 1181 Municipalities
• Therefore, in order to reduce the number of the radon experimental measurements needed, a “mixed approach” was proposed: • i) experimental local survey in a limited number of selected municipalities (annual measurements) • ii) development of a radio-geolithological model, allowing the estimation of the radon concentration values in those municipalities where no experimental measurements are available or their number are insufficient
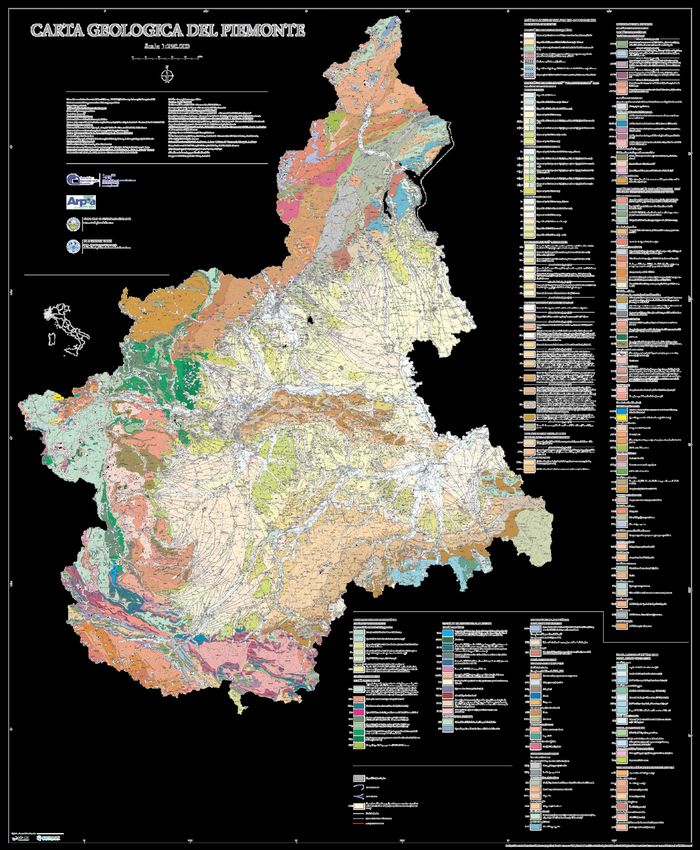
The radio-geolitologhical model
• The model is the core
  of our approach to
  radon mapping and is
  based on a new detailed
  geological map of
  Piemonte (1:250,000,
  more than 200 units),
• The ideas behind this
  model are quite simple
  and can be summarized
  in five steps
1. Selection from the database of all the available
   experimental indoor radon measurements of the data
   suitable for radon mapping
2. Normalization of the data and georeferencing
3. Subdivision of the Region in 36 radio-
   geolithological units
4. Calculation of a radio-geolithological average for
   each radio-geolithological unit using the geo-
   referenced experimental data
5. Calculation of the average indoor radon
   concentration in each municipality (sampling unit) as
   a weighted mean of the radio-geolithological
   averages of the units occurring in the municipality
1. Selection of the measurements
• A measurement was considered suitable to
  be used for radon mapping if:

a) is an annual average (usually obtained
   from two semestral measurements)
b) was performed by means of dosemeters
   equipped with nuclear track etch detectors
The ANPA/ARPA dosemeter
• It is the device used
  in most of our
  surveys
• It contains one or
  two CR-39 detectors
• The holder is made
  with conductively
  plastic
• The dosemeter is put
  in thin radon-
  permeable
  polyethylene bag
2. Normalization of the data and georeferencing

• The database used for the radon mapping consisted
  of 4,232 measurements performed in different
  types of buildings:

- 2,614 dwellings
- 1,298 schools
- 320 other workplaces

• All those points of measurements were chosen
  randomly within each sampling unit (Municipality)
• In order to reduce the heterogeneity of
  sample, the data were subjected to some
  normalization processes
• The most important normalization was the
  ground floor normalization: ground floor
  indoor radon concentration was taken as a
  good indicator for radon mapping purposes
  as its value is strongly correlated to soil
  radon flux
• As a quite high number of the measurements
  in our database, being randomly chosen, are
  referred to higher floor, they need to be
  normalized to ground floor
Ground floor normalization:
       supported by experimental data
• Typical variation                       CONCENTRAZIONE RADON PER PIANI

  with the floor of
                                450
  the indoor radon              400
  activity                      350

  concentration (*)             300

                                250
                       Bq/m 3
(*) Average values,             200

referred to a little            150

town in western Alps            100

                                50

                                 0
                                      S       ST    T       1°   2°   3°
                                                        PIANO
Ground floor normalization
• First assumption: a log-normal distribution applies for the
radon activity concentrations CX for any given X floor:
•
• Second assumption: a linear relationship holds between the
concentrations CX at any given X floor and the ground floor
concentrations CGF:
CX=kxCGF
• Third assumption: the kX proportional factor is given by the
ratio of the corresponding geometric mean :• In the end, the very reasonable assumption: • Operating in this way we obtained, for each sampling unit (Municipality) with enough experimental data a complete characterization of radon: not just a mean value but a log-normal distribution of the ground level activity concentration • Other normalization were done (not discussed here in detail), concerning the different building typology (school and dwellings), as it was experimentally observed an average shift of the concentrations:
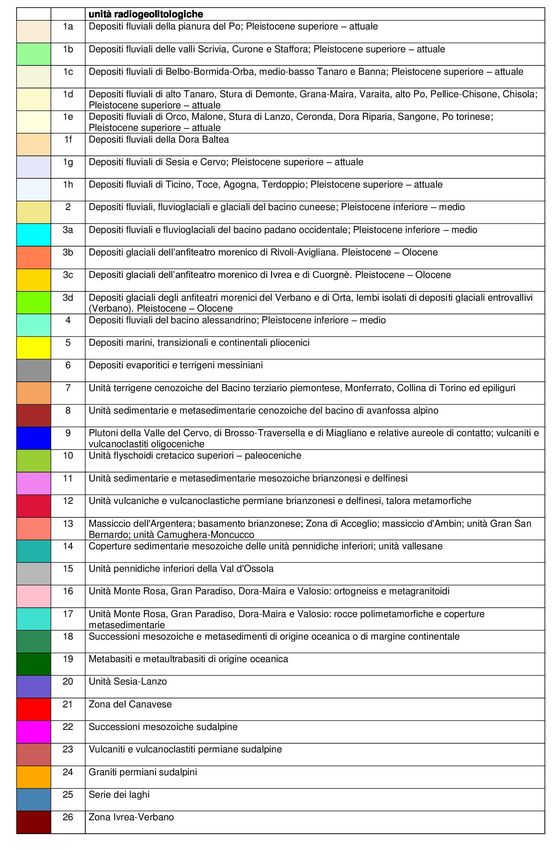
3. Subdivision of the Region in 36 radio-geolithological units • This was the most challenging issue • Starting from a geological map with more than 200 units we had to reduce the units number without loosing meaningfulness • The definition of the 36 units was done following geological consideration validated by HPGe spectrometry measurements performed on more the 440 rock and soil samples gathered all over Piemonte
The radio-geolithological map of Piemonte
4. Calculation of the radio-geolithological
                   averages
• All the georeferenced (normalized)
  experimental data were then superimposed to
  the radio-geolithological map
• It was thus possible to calculate for every generic k radio-geolithological unit its corresponding radio-geolithological mean, LMk and the parameter and of the log-normal distributions, as well
5. Calculation of the average indoor
radon concentration in each municipality
 • The average indoor radon concentration
   MCj in the generic j sampling unit
   (municipality) can be calculated
   straightforward as a weighted mean of the
   radio-geolitholgical averages of the units
   occuring in the municipality built area:

                            radio-geolithological means

              weights
•
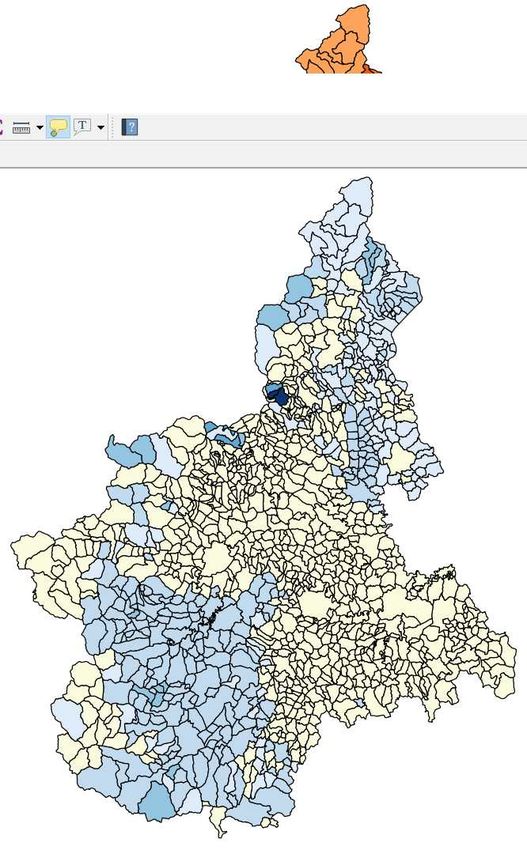
Results: validation and maps
• The model was validated by comparison
  with the available experimental results:
an average value of 0.94 was found for the
ratio predicted/experimental con (R2=0,53)
• The model seems to give a slight
  overestimation
• Let’s take a look to the maps
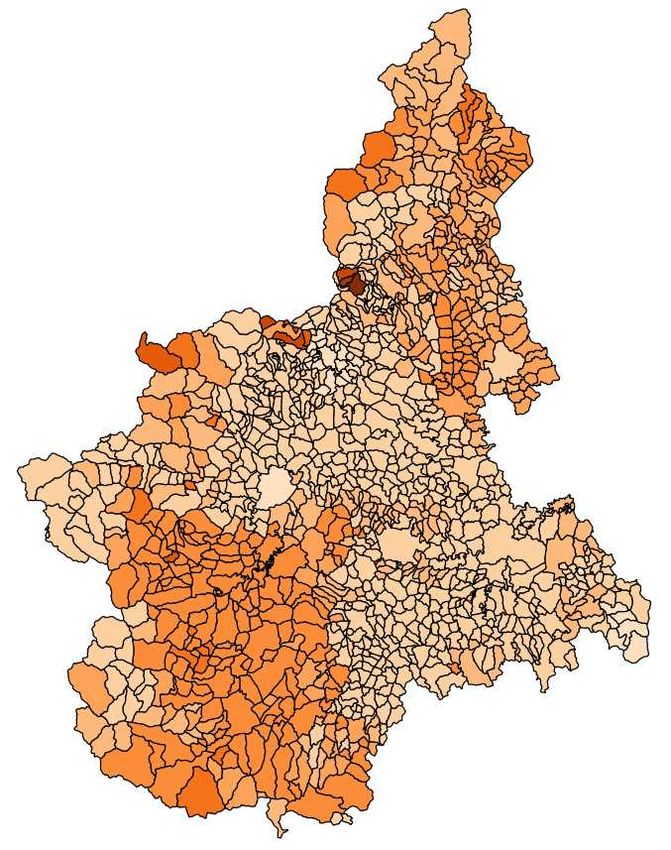
Ground Floor
Average Values
(built areas)
Global Average
Values
Regional Average
≈ 82 Bq/m3
substantially
greater than the
1991 Mean Value
Consequence of the energy
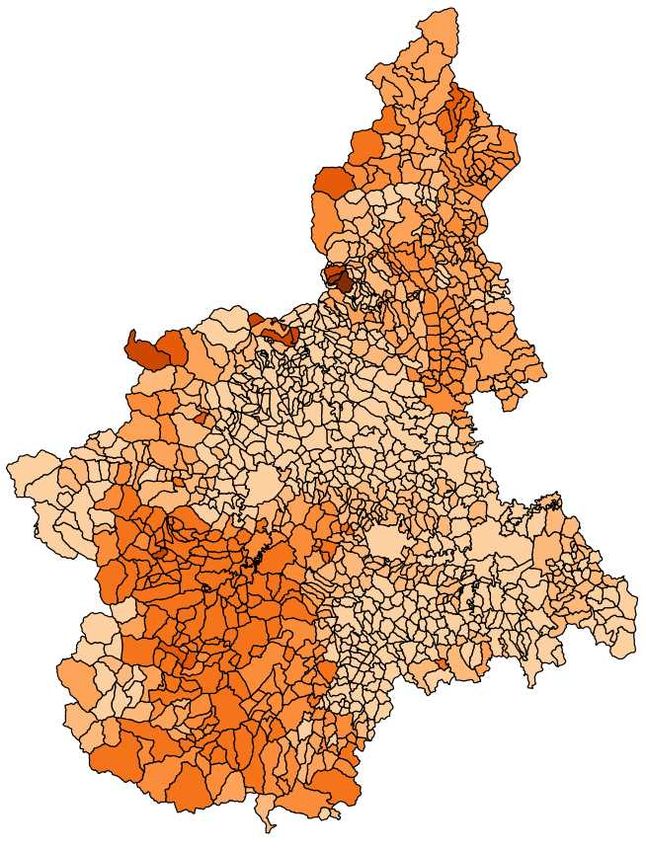
saving policies ??% of dwellings
exceeding EU
Reference Level
300 Bq/m3
in some limited
areas (two
municipalities)
this indicator is
above 70%
Radon prone areas in Italy
15 % > 300 Bq/m3Thank you !
You can also read