Basics of observations & data reduction: spectroscopy - Luca Sbordone - ESO Chile
←
→
Page content transcription
If your browser does not render page correctly, please read the page content below
Basics
of
observations
&
data
reduction:
spectroscopy
Luca
Sbordone
-‐
ESO
Chile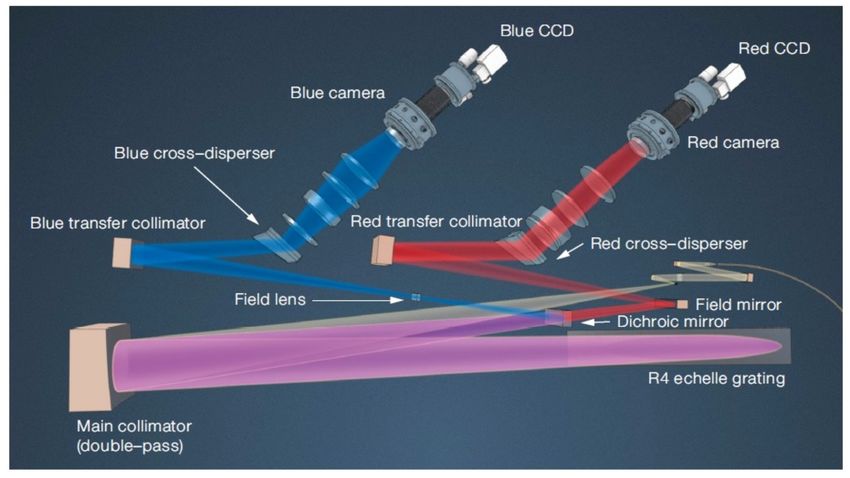
Spectrographs?

•   A
  spectrograph
  is
  a

    camera
  coupled
  with
  a
                        Collimator
                                                                                      G
                                                                                       ra
                                                                                            tin
    dispersing
  element
                                                                       g

                                                Slit
•   Images
  of
  the
  source
  at

    different
  wavelengths
  fall

    on
  different
  places
  in
  the
                              Ca
                                                                              m
    detector
                                                                 er
                                                                                  a

•   The
  amount
  of
  light

                                                       De
    emitted
  at
  each
                                 te
                                                               cto
                                                                   r
    wavelength
  can
  be

    measured:
  the
  spectrum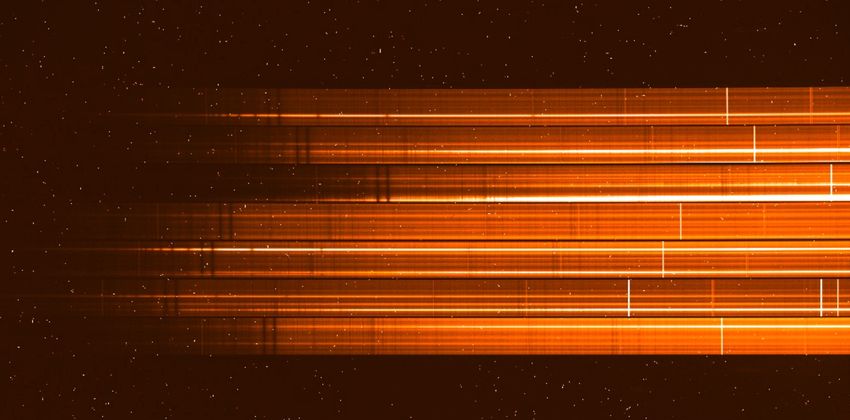
Tools of the trade: the humble prism

•   First dispersing element
    invented/discovered
•   Uses the fact that
    refraction is dependent
    on light wavelength (any
    refractive element is
    chromatic)
•   Longer wavelength,
    redder light is deviated
    less than bluer, shorter
    wavelength light.
•   In general prisms have
    low dispersion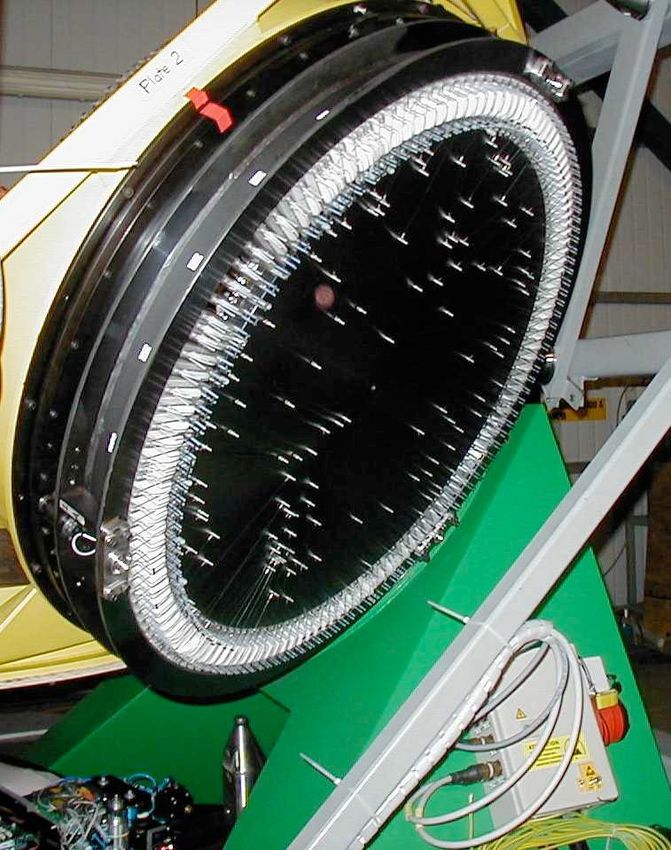
Tools of the trade: the humble prism

•   First dispersing element
    invented/discovered
•   Uses the fact that                           DISPERSION:
    refraction is dependent          The angular (or spatial, after focusing
    on light wavelength (any         by a camera on a focus plane /
                                     detector) separation between two
    refractive element is            wavelengths after passing through a
    chromatic)                       dispersing element:
•   Longer wavelength,
    redder light is deviated                                     1
                                               or        =
    less than bluer, shorter               ✓         x       ✓ fcam
    wavelength light.
                                     where fcam is the camera focal
•   In general prisms have           length.
    low dispersion                   Do not confuse it with resolution!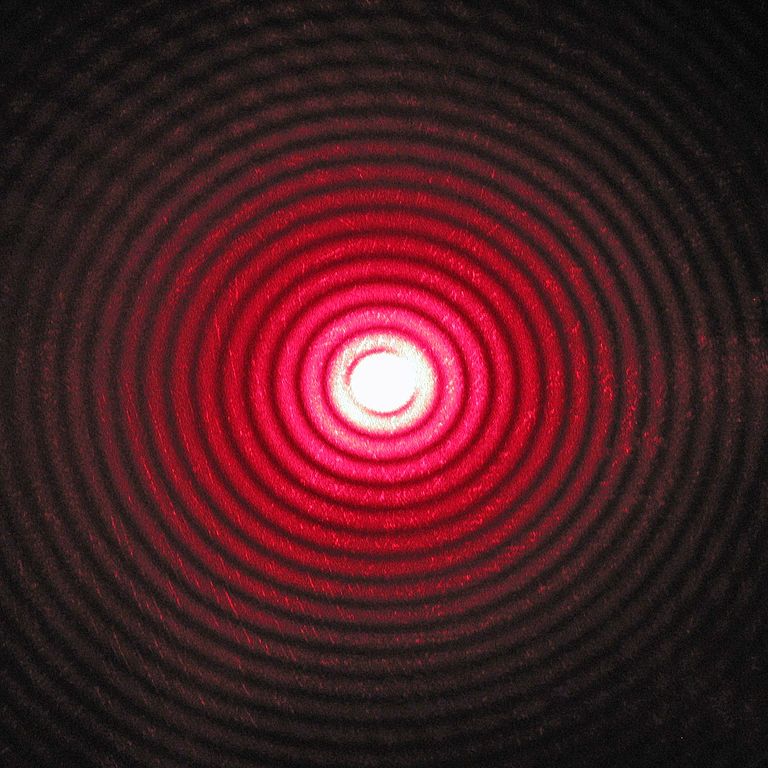
Tools of the trade: the humble prism
                       Refractive Index

                           c
                        n=
                           v              Light phase velocity
                                          in the medium

  n0 sin ✓0 = n1 sin ✓1

                          ) ( ) ⇡ [n ( )                         1] ↵
In prisms dispersion is due to the variation of n with the wavelength.
Usually then dispersion is not constant with wavelength
Tools of the trade: the diffraction grating

•   Diffraction gratings exploit the superposition of diffraction and
    interference, manifestation of the wave behavior of light.
•   Although the pattern is the same for each wavelength, spacing
    depends on wavelength, hence the dispersion.
•   Gratings generate multiple dispersion orders, of increasing
    dispersion: very high dispersions can be achieved at high orders.
•   Red light is dispersed more than blue.
Single slit diffraction

                                                             Laser through a single pinhole

                            !2
              ⇡b
I↵     sin         sin ↵
   =         ⇡b                        sin ✓ ⇡ 1.22
I0                sin ↵                                                    b
                                             Angle of 1st zero intensity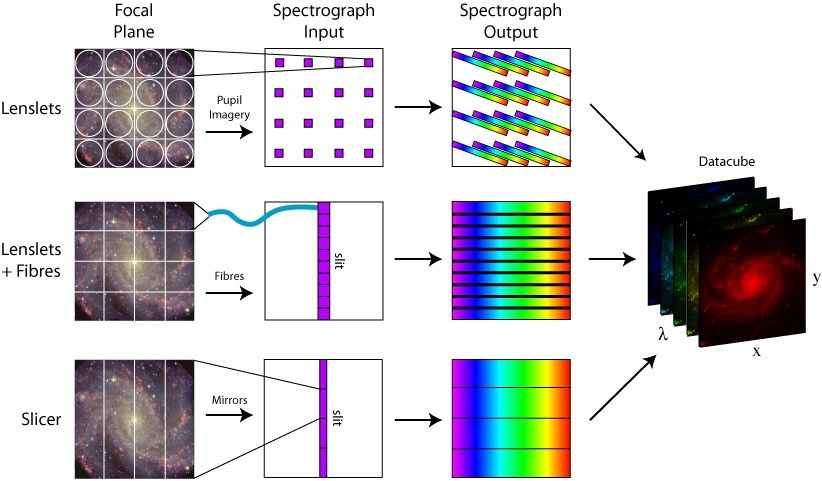
Multiple slits interference

                           β      α

                   g       dark       reflecting

                  b: slit width
                  g: period
                  α: diffraction angle
                  β: angle of incidence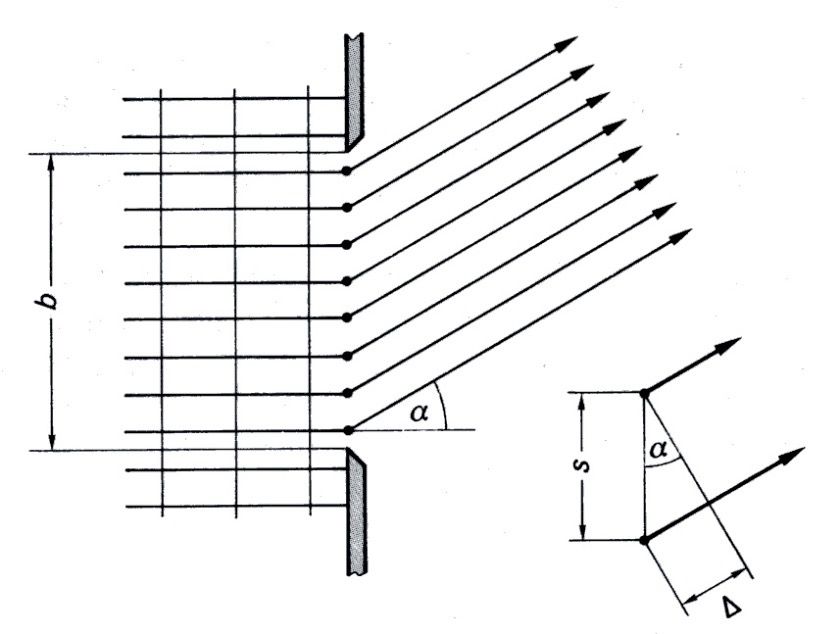
Tools of the trade: the diffraction grating

                                                      multiple slit interference pattern

     Single-slit diffraction envelope

      /b              2 /b                           /g 3 /g

                                                     !2                                               !2
                                        ⇡b                                            ⇡g
      I↵                   sin               sin ↵                  sin N sin ↵
         =                         ⇡b
                                                          ⇥              ⇡g
      I0                                 sin ↵                       sin    sin ↵

                                                                                               m is called
                      Interference maxima at:        sin ↵m = ±m                           interference order
                                                                                    g

/g 2 /g
The grating equation
• Deflection is higher for longer
wavelengths.
• Dispersion increases as order (m)
increases, and period (g) sin ↵m sin = ±m
decreases. g
• Per order, dispersion is ~linear d g cos ↵
=
• Dispersion does not depend on the d↵ m
size of a single grating “slit” (b)Adding the camera
Collimator
G
ra
tin
g
Slit
Ca
m
er
a
De
te
cto
r
d 1 d g cos ↵
= =
dx fcam d↵ mfcamFrom dispersion to resolution
!2 !2
⇡g N
sin N sin ↵
⇥ ⇡g
sin sin ↵
d g cos ↵
= N
d↵ m
• In the interference term of the
grating intensity formula, N is the
total number of rules in the N
spectrograph beam.
• The larger N, the narrower and
higher the interference maxima.
• m is the order: the larger m, the
larger the dispersion...From dispersion to resolution
!2 !2
⇡g N
sin N sin ↵
⇥ ⇡g
sin sin ↵ (SPECTRAL) RESOLUTION
Is the minimum wavelength
d g cos difference
↵ that the spectrograph can
= separateN reliably.
d↵ m Usually written as:
R= /
• In the interference term of the
grating intensity formula, N is the
total number of rules in the N
spectrograph beam.
• The larger N, the narrower and
higher the interference maxima.
• m is the order: the larger m, the
larger the dispersion...From dispersion to resolution
+
As per Rayleigh
criterion....
two wavelengths λ and λ+Δλ
are barely separable in order
m if the main intensity
maximum of λ+Δλ is located
at minimum of λ.
Since m determines the
dispersion and N the width R= =m⇥N
of intensity maxima:From dispersion to resolution
Flux vs. wavelegth
0.8
Res. Intens.
0.6
0.4
40,000 - high resolution - Δλ= 0.01 nm
10,000 - medium resolution - Δλ= 0.04 nm
5,000 - low resolution - Δλ= 0.08 nm
0.2
410.2 410.4 410.6 410.8 411.0 411.2
wavelength (nm)From dispersion to resolution
Flux vs. wavelegth
0.8
Res. Intens.
0.6
0.4
40,000 - high resolution - Δλ= 0.01 nm
10,000 - medium resolution - Δλ= 0.04 nm
5,000 - low resolution - Δλ= 0.08 nm
0.2
410.2 410.4 410.6 410.8 411.0 411.2
wavelength (nm)Enter the spectrograph slit…
Spectrograph slit
normal to
dispersion:
Stellar seeing
image
Wavelength!
parallel to
dispersion:
Stellar seeing image
A monochromatic convoluted with slit
image of the slit is transmission
(square func +
produced on the detector
diffraction)
at the position of every
wavelengthSlit and resolution
Collimator
G
ra
tin
g
Slit
Ca
m
er
a d g cos ↵
=
De
dx mfcam
te
cto
r
m fcoll
)R=
g cos ↵ s
Slit width on the sky (in arcsec.) is limited by the
need not to lose too much light, hence depends on
typical site seeing. The spectrograph has to be
designed accordingly, engineering constraints on
fcam/fcol permitting: the longer fcol, the larger the
grating, and the spectrograph.
VLT-UVES Slit viewerDetector and resolution
Undersampling:
Δλ/1=0.011 nm/pix Severe undersampling:
2Δλ=0.022 nm/pix
Slight oversampling: Nyquist criterion:
Δλ/3=0.0038 nm/pix to properly recover
line profile one needs
at least 2 samples (=pixels) per re-
solution element.
This has to be matched with available
detector (pixels ~15 µm, CCD size) and
R=40,000 optical/mechanical constraints (size of
Δλ=0.011nm
corrected camera field, fcam/fcol, full
instrument size...)Problems!!!
Diffraction modulation
sends most light to low
orders!
Resolution increases with
order number... 1
2 As order number increases,
longer wavelengths from
order m-1 overlap with
shorter from order m...
The free spectral range Σ
decreases with increasing
order
1 1
sin (m 1 /d) = sin [(m + 1) 2 /d] )⌃= 1 2 = 2 /mSolution: Blazed Grating
β α
Single-slit diffraction envelope for blazed grating
2
sin {(⇡b/ ) [sin (↵ + ) + sin ( + )]}
I( )=
(⇡b/ ) [sin (↵ + ) + sin ( + )]
I (α)
I (α)
α + β [deg] λ [Å]Solution: Blazed Grating
β α
Blazing the grating
moves the angle at which
the diffraction peak is
placed, leaving the
Single-slit diffraction envelope for blazed grating
interference pattern
2
sin {(⇡b/ ) [sin (↵ + ) + sin ( + )]}
I( )=
(⇡b/ ) [sin (↵ + ) + sin unaffected
( + )]
(sorry, Mr. Feynman...)
I (α)
I (α)
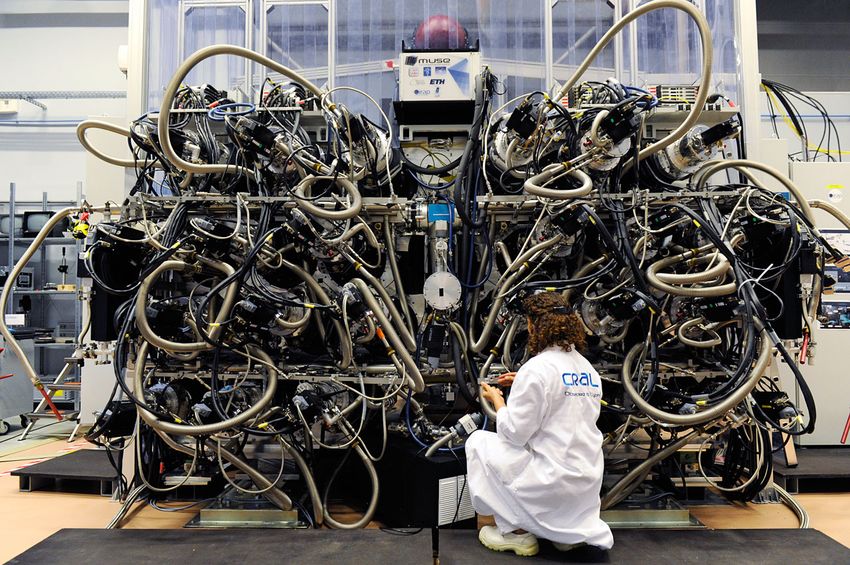
α + β [deg] λ [Å]The èchelle cross-dispersed spectrograph
• No shadowing, very high orders (100+),
high dispersion
• Order overlap avoided by cross-dispersion
Main Grating dispersion
Nth order
(N+1)th order
Cross-disperser dispersion
Nth order (N+1)th orderFlavors
of
spectrographs:
single
object
• “Long
slit”
low/mid
resolution:
EFOSC,
FORS.
RFlavors
of
spectrographs:
Multi-‐Object
• “On-‐Chip”
low/mid
resolution:
EFOSC,
FORS,
(VIMOS).
Same
as
long
slit,
but
multiple
“slitlets”
via
masks.
Field
<
10’,
10s-‐100s
objects.
• Positionable-‐fiber-‐fed:
FLAMES
MEDUSA,
(4MOST),
R=2k-‐20k,
100-‐1000
spectra,
25’
to
1
degree
field,
10-‐500
nm
range
(dep.
on
res.).
Complex
positioner
mechanics,
survey-‐
optimized,
“blind”
pointing,
no
spatial
resolutionFlavors
of
spectrographs:
Integral
Field
• FLAMES
ARGUS/IFU,
MUSE.
Cover
an
area
(up
to
~1’)
with
spctrograph
“pick-‐ups”
(fibers
/
slicers).
100
-‐
1000
spectra,
multi-‐spectrograph,
spectral
resol.
/
spatial
resol.
/
spectral
coverage
trade-‐offFlavors
of
spectrographs:
Integral
Field
• MUSE:
Field
of
view:
60”x60”;
“pixel”
size
0.2”;
1152
“slices”;
Resolution
~
2500;
480
nm
—>
930
nm,
24
spectrographs,
48
spectra
each.Getting
the
spectra
you
need
• Spectral
range:
must
contain
the
features
you
need
(+
redshift
/
radial
velocity)
or
enough
features
of
the
type
you
need
• Resolution:
sufficient
to
resolve
otherwise
blended
features
/
to
resolve
the
radial
velocity
you
need
• Slit
length:
is
the
source
extended?
Do
you
need
a
good
sky
subtraction?
(a.k.a.
spatial
resolution,
see
also
“number
of
spectra”)
• Signal-‐to-‐noise:
adequate
to
detect
/
measure
features
of
strength
X
with
Y
uncertainty
(may
correlate
w.
available
features
number)
• Number
of
targets/spectra:
how
many
do
you
need
for
the
science
goal?
Quality
vs.
quantity?
Is
multiplexing
viable?
Time
sampling
needed?
Spatial
sampling
needed
(see
also
“slit
length”)?Flux vs. wavelegth
421.552 38.01 0.17
421.618 26.00 0.53
421.755 26.00 0.70
421.936 26.00 0.44
422.034 26.00 0.87
1.2
1.0
0.8
Res. Intens.
0.6
0.4
S/N=25
0.2
0.0
421.5 421.6 421.7 421.8 421.9 422.0
1.2
1.0
0.8
Flux vs. wavelegth
wavelength (nm)
Res. Intens.
0.6
0.4
0.2
0.0
421.5 421.6 421.7 421.8 421.9 422.0
wavelength (nm)Flux vs. wavelegth
421.552 38.01 0.17
421.618 26.00 0.53
421.755 26.00 0.70
421.936 26.00 0.44
422.034 26.00 0.87
1.2
1.0
0.8
Res. Intens.
0.6
0.4
S/N=75
0.2
0.0
421.5 421.6 421.7 421.8 421.9 422.0
1.2
1.0
0.8
Flux vs. wavelegth
wavelength (nm)
Res. Intens.
0.6
0.4
0.2
0.0
421.5 421.6 421.7 421.8 421.9 422.0
wavelength (nm)Flux vs. wavelegth
421.552 38.01 0.17
421.618 26.00 0.53
421.755 26.00 0.70
421.936 26.00 0.44
422.034 26.00 0.87
1.2
1.0
0.8
Res. Intens.
0.6
0.4
S/N=150
0.2
0.0
421.5 421.6 421.7 421.8 421.9 422.0
1.2
1.0
0.8
Flux vs. wavelegth
wavelength (nm)
Res. Intens.
0.6
0.4
0.2
0.0
421.5 421.6 421.7 421.8 421.9 422.0
wavelength (nm)S/N
vs.
resolution
+
• S/n,
spectral
resolution,
and
sampling
are
the
three
main
parameters
defining
spectral
quality.
• They
set
the
uncertainty
with
which
features
can
be
measured:
lower
resolution
requires
higher
S/N
to
achieve
same
result.
• Optimal-‐
or
over-‐sampling
must
be
mantained.
Higher
sampling
decreases
S/
N
per
pixel
but
more
fitting
points
compensate
for
it.
• Same
for
S/N
and
resolution
(@optimal
sampling):
lower
R
—>
higher
S/N
but
just
enough
to
compensate
for
loss
of
line
strength.
• Be
careful
about
blending!!S/N
vs.
resolution
+
• S/n,
spectral
resolution,
and
sampling
are
the
three
main
parameters
defining
spectral
quality.
• They
set
the
uncertainty
with
which
features
can
be
measured:
lower
resolution
requires
higher
S/N
to
achieve
same
result.
• Optimal-‐
or
over-‐sampling
must
be
mantained.
Higher
sampling
decreases
S/
N
per
pixel
but
more
fitting
points
compensate
for
it.
• Same
for
S/N
and
resolution
(@optimal
sampling):
lower
R
—>
higher
S/N
but
just
enough
to
compensate
for
loss
of
line
strength.
• Be
careful
about
blending!!5750 K log g 4.0 [Fe/H]=0 [Fe/H]=-2 [Fe/H]=-3 [Fe/H]=-5 R=40000
5750 K
log g 4.0

 [Fe/H]=0
[Fe/H]=-2
[Fe/H]=-3
[Fe/H]=-5

R=40000
5750 K log g 4.0 [Fe/H]=0 [Fe/H]=-2 [Fe/H]=-3 [Fe/H]=-5 R=40000 S/N=80
Spectroscopy
  Choices
  Confusogram

               Detector


                Space
               Telescope


                 Time
Spectroscopy
Choices
Confusogram
ge Slit
Length
an
al
R Re
ctr so
pe lut
S io
Detector
n
Space
Telescope
Time
ise
No
l
to
gna
Si
Number
of
TargetsSpectroscopy
Choices
Confusogram
ge Slit
Length
an
al
R Re
ctr so
pe lut
S io
Detector
n
Space
Telescope
Time
Multiplex
ise
No
l
to
gna
Si
Number
of
TargetsSpectroscopy
Choices
Confusogram
ge Slit
Length
an
al
R Re
ctr so
pe lut
S io
Detector
n
Space
Telescope
Time
Multiplex
ise
No
l
to
gna
Si
Number
of
TargetsSpectroscopy
Choices
Confusogram
ge Slit
Length
an
al
R Re
ctr so
pe lut
S io
Detector
n
Space
Telescope
Time
Multiplex
ise
No
l
to
gna
Si
Number
of
TargetsSpectrograph
data
reduction
• Bias
subtraction:
detector
calibration
to
remove
readout
bias,
same
as
for
imaging.
• Order/slitlet
trace:
Position
of
orders/slits
centers
across
wavelength
on
the
detector
are
traced
and
stored.
• Flat-‐field
correction:
through-‐spectrograph
flat
field
used
to
correct
for
illumination
variations
(blaze,
vignetting)
and
pix-‐to-‐pix
inhomogeneity.
Per-‐order
(-‐slitlet).
• Wavelength
calibration:
(per-‐order)
wavelength
values
along
dispersion
direction
determined
via
known
emission-‐line
spectrum
(Th-‐Ar
lamp,
Fabry-‐Perot
etalon,
Laser
Frequency
Comb),
wavelength
solution
computed,
per
order/slitlet
and
at
different
points
along
slit
• Science
spectrum
extraction:
using
defined
spectrum
geometry
science
spectra
are
extracted,
rectified,
flat-‐fielded,
wavelength
calibrated
and
resampled.
If
echelle,
orders
are
merged.
Background
(“sky”)
is
subtracted
from
slit
edges
/
sly
fiber(s)
if
LSS,
EchelleSpectrograph
data
reduction
• Long
Slit
Flat
Field
frame
• Long
Slit
Wavelength
Calibration
(ThAr)
lamp
frame
• Long
Slit
Science
frameSpectrograph
data
reduction
• MXU
Flat
Field
frame
• MXU
Wavelength
Calibration
(ThAr)
lamp
frame
• MXU
Science
frameSpectrograph
data
reduction
Order trace Flat Field
Wavelength calibration • Echelle
spectra
require
order
tracing
because
orders
are
tilted,
and
often
curved.
FF
&
Wave
need
to
be
extracted
and
rectified
before
applying
to
science.
Inter-‐order
background
needs
to
be
fittedSpectrograph
data
reduction
Order trace Flat Field
Wavelength calibration
• Positionable
fiber-‐fed
(FLAMES)
Flat
Field
frame:
single-‐order
spectra,
flat
field,
from
the
131
fibresThank you!
You can also read