Coordinating data and approaches to conduct a Kemp's ridley sea turtle stock assessment
←
→
Page content transcription
If your browser does not render page correctly, please read the page content below
Recommendations to the Gulf of Mexico Fishery Management Council:
Coordinating data and approaches to conduct a
  Kemp’s ridley sea turtle stock assessment
                                                                                                    Tab A, No. 8(a)

                                                                                      Toni Torres

                        Benny J. Gallaway (PI) and Nathan F. Putman (Co‐PI)
                       LGL Ecological Research Associates Inc., Bryan, Texas
                                 Chris Sasso and Paul M. Richards
                 NOAA Fisheries, Southeast Fisheries Science Center, Miami, Florida
                                         Charles Caillouet
                           Independent Researcher, Montgomery, Texas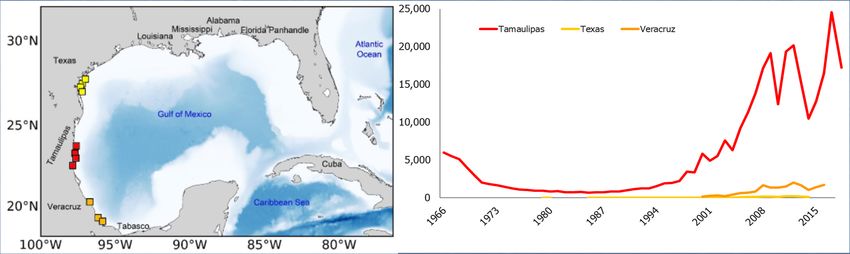
Outline
Introduction: Why we need a stock assessment
Key aspects of Kemp’s ridley biology
Elements of the Gallaway et al. (2016a) Kemp’s ridley stock
assessment
Other proxies, indices, and factors to include that may provide
information on Kemp’s ridley vital rates
Recommended stock assessment modeling approach
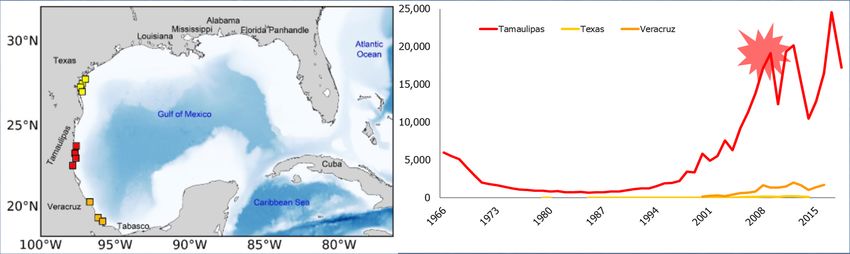
What is the Kemp’s ridley population doing?

             Kemp’s ridley nesting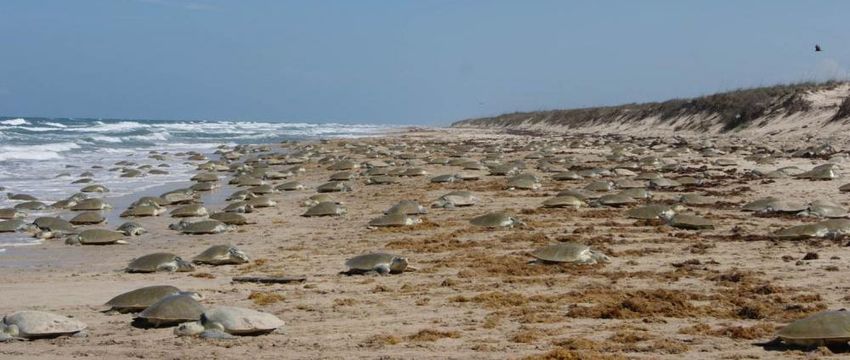
What is the Kemp’s ridley population doing?

             Kemp’s ridley nesting

                                         2010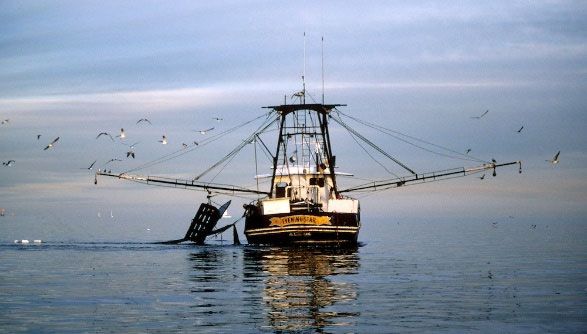
What happened to population growth? DWH oil spill? Shrimping? Density dependence?
What happened to population growth?
DWH oil spill?
Deepwater Horizon Natural Resource Damage Assessment Trustees
(DWH NRDA TRUSTEES). 2016. Deepwater Horizon oil spill: final
programmatic damage assessment and restoration plan and final
programmatic environmental impact statement.)
Shrimping?
Density dependence?
What happened to population growth?
DWH oil spill?
Deepwater Horizon Natural Resource Damage Assessment Trustees
(DWH NRDA TRUSTEES). 2016. Deepwater Horizon oil spill: final
programmatic damage assessment and restoration plan and final
programmatic environmental impact statement.)
Shrimping?
GALLAWAY, B.J., GAZEY, W.J., CAILLOUET, C.W., JR., PLOTKIN,
P.M., ABREU GROBOIS, F.A., AMOS, A.F., BURCHFIELD, P.M.,
CARTHY, R.R., et al. 2016. Development of a Kemp’s ridley sea
turtle stock assessment model. Gulf of Mexico Science 33:138–157.
Density dependence?What happened to population growth?
DWH oil spill?
Deepwater Horizon Natural Resource Damage Assessment Trustees
(DWH NRDA TRUSTEES). 2016. Deepwater Horizon oil spill: final
programmatic damage assessment and restoration plan and final
programmatic environmental impact statement.)
Shrimping?
GALLAWAY, B.J., GAZEY, W.J., CAILLOUET, C.W., JR., PLOTKIN,
P.M., ABREU GROBOIS, F.A., AMOS, A.F., BURCHFIELD, P.M.,
CARTHY, R.R., et al. 2016. Development of a Kemp’s ridley sea
turtle stock assessment model. Gulf of Mexico Science 33:138–157.
Density dependence?
CAILLOUET JR, C.W., RABORN, S.W., SHAVER, D.J., PUTMAN, N.F.,
GALLAWAY, B.J. AND MANSFIELD, K.L., 2018. Did Declining
Carrying Capacity for the Kemp's Ridley Sea Turtle Population
Within the Gulf of Mexico Contribute to the Nesting Setback in
2010− 2017?. Chelonian Conservation and Biology, 17(1), pp.123-
133.What is the Kemp’s ridley population doing?
Key aspects of Kemp’s ridley biology

                                                                  Continental Shelf
                                                                  Foraging Grounds

                                                   Post-reproductive
                                                      movement
                                                                                              Recruitment
                                                                       Homing

                                                    Nesting
                                                                                                     Oceanic Nursery
                                                     Beach              Dispersal                        Habitat
Collard & Ogren 1990, Bulletin of Marine Science

                                                                       Adapted from Harden Jones 1968, Fish Migration
Using the migration triangle in Kemp’s ridley to understand
mechanisms of spatiotemporal variation in abundance
~10 years
Do foraging conditions Does recruitment
predict future nesting? predict future nesting?
Swimming: Swimming + Drift:
Remigration interval, Ocean circulation, foraging
clutch frequency, conditions, anthropogenic
foraging conditions, mortality
anthropogenic mortality
Does hatchling production
predict future nesting?
~2 years
Drift:
Ocean circulation, predationKey aspects of Kemp’s 30,000 y = 6126.9ln(x) - 61359
ridley biology
R² = 0.6774
25,000
20,000
Nests
15,000
At a fundamental level, the status of a 10,000
5,000
population can be determined by
0
knowing: 0 200,000 400,000 600,000 800,000
Hatchling Production
reproductive output (+)
30,000
immigration (+) y = 221.53x + 3363.2
25,000 R² = 0.5658
natural mortality (‐)
20,000
anthropogenic mortality (‐)
Nests
15,000
emigration (‐)
10,000
5,000
0
0 20 40 60 80 100
Juvenile Strandings, FLForecasting Kemp’s ridley nesting
30000
25000
20000
Nest Counts
15000
10000
5000
0Forecasting Kemp’s ridley nesting:
Hatchling Production
30000
25000
20000
Nest Counts
15000
10000
5000 R2 = 0.67
P = 0.0000008
0
N=23Forecasting Kemp’s ridley nesting:
Recruitment to Florida (strandings)
30000
25000
20000
Nest Counts
15000
10000
R2 = 0.56
5000
P = 0.000022
N = 23
0Forecasting Kemp’s ridley nesting:
Production + Recruitment
30000
25000
20000
Nest Counts
15000
10000
R2 = 0.78
5000 Production, P = 0.00016
Recruitment, P = 0.0043
0 N = 23Elements of the Gallaway et
Annual number of nests: combined for 3 index beaches in Tamaulipas (1966‐2012)
Annual number of hatchlings: combined for 3 index beaches in Tamaulipas (1966‐2012),
al. (2016) Kemp’s Ridley separated by coral or in situ
Stock Assessment Shrimping effort: effort (days fished) across 4 spatial zones (approximately WFL, AL‐MS, LA,
TX) and 3 depth zones (0‐10 fm, 10‐30 fm, 30+ fm) in the Gulf of Mexico
Shrimp trawl mortality
Shrimp trawl catchability: partitioned into ages 2‐4 (0.2, SD = 0.04) and 5+ (0.155, SD = 0.014)
TED effect multiplier: starts in 1990 to influence catchability (0.233, SD = 0.069)
Mark‐recapture growth increment: Data from CMTTP ~223 records (1980‐2012)
Strandings length frequency: 5,953 records across the northern Gulf of Mexico (1980‐2012)
Observed proportion of strandings
Proportion of Mature females of age a
Number of nests per adult female in the population: quotient of annual number of nests per
adult female divided by the remigration interval
Proportion of coral hatchlings that are female
Proportion of in situ hatchlings that are female
Habitat weight: based on expert opinion, the relative importance of each shrimping zone to
mature females was determined.
Clutch frequency: numbers of nests laid per season
Remigration interval: years between nesting
Natural mortalityElements of the Gallaway et
Annual number of nests: combined for 3 index beaches in Tamaulipas (1966‐2012)
Annual number of hatchlings: combined for 3 index beaches in Tamaulipas (1966‐2012),
al. (2016) Kemp’s Ridley separated by coral or in situ
Stock Assessment Shrimping effort: effort (days fished) across 4 spatial zones (approximately WFL, AL‐MS, LA,
TX) and 3 depth zones (0‐10 fm, 10‐30 fm, 30+ fm) in the Gulf of Mexico
Shrimp trawl mortality
Shrimp trawl catchability: partitioned into ages 2‐4 (0.2, SD = 0.04) and 5+ (0.155, SD = 0.014)
TED effect multiplier: starts in 1990 to influence catchability (0.233, SD = 0.069)
Mark‐recapture growth increment: Data from CMTTP ~223 records (1980‐2012)
Strandings length frequency: 5,953 records across the northern Gulf of Mexico (1980‐2012)
Observed proportion of strandings
Proportion of Mature females of age a
Number of nests per adult female in the population: quotient of annual number of nests per
adult female divided by the remigration interval
Proportion of coral hatchlings that are female
Proportion of in situ hatchlings that are female
Habitat weight: based on expert opinion, the relative importance of each shrimping zone to
mature females was determined.
Clutch frequency: numbers of nests laid per season
Remigration interval: years between nesting
Natural mortalityOther proxies, indices, and factors to include that
may provide information on Kemp’s ridley vital rates
Spatiotemporal Variation in
Variation in Kemp’s Ridley
Kemp’s Ridley Demographic
Distribution ParametersSpatiotemporal Variation in Kemp’s Ridley Distribution Means (1996-2018) Trends (1996-2018)
Variation in Kemp’s Ridley Demographic Parameters

• Clutch frequency (number of nests laid by
  a turtle in a given year) and the
  remigration interval (number of years
  turtles take between nesting seasons)
  make a massive difference in assessing
  population size from nest counts.
• Consider whether turtles lay 1 or 2 nests
  in a season
    • population size differs by 50%!
• Consider whether turtles nest every 2
  years or every 3 years
    • population size differs by 33%!
• Such differences might conceivably
  account for all of the major peaks and
  troughs in nesting data.
Other proxies, indices, and factors to include that
may provide information on Kemp’s ridley vital rates
Anthropogenic mortality Clutch frequency
Fishing Effort in U.S. waters Changes in nest
and remigration
Bycatch / Catchability / Discard Mortality bycatch mortality, boat strikes; monitoring effort
entanglement in derelict gear, small interval
artificial reefs, and marine debris.
/ approaches
Kemp’s
ridley in Spatiotemporal Variation in
Atlantic Natural mortality Changes in
waters Variation in Harmful Algal Blooms (e.g.,
red tides) and cold stunning Kemp’s Ridley hatchling sex‐
ratios
Kemp’s Ridley Growth rates
Demographic
Kemp’s ridley in
Mexico’s waters Distribution Estimate age at maturity
and mortality rates
Parameters
Is this a major
information gap? Recruitment Avens et al. 2020, Ramirez Density
et al. 2020a, 2020b; dependence
dynamics Anthropogenic rescue
Prey availability Lamont & Johnson 2020
Variability in ocean and rehabilitation
indices of blue crab abundance,
circulation dynamics,
CPUE data by state relative to the
Sargassum distribution,
distribution of Kemp’s ridley
coastal recruitmentRecommended stock assessment modeling approach
We suggest that a series of range‐finding analyses be
conducted using the matrix model described in Kocmoud
et al. (2019).
The benefit of this is that sensitivity analyses can be performed on
each model parameter extremely quickly.
With this step, it will be possible to examine the sensitivity of the stock
assessment model to the newly included environmental and
demographic parameters (some of which may have wide confidence
intervals) as well as other vital rates.
After this initial assessment, the AD Model Builder
program applied by Gallaway et al. (2016a) could be used
to run the most pertinent scenarios given the identified
influences of habitat weighting (as discussed above to track
spatiotemporal variation in turtle distributions), prey
abundance, and factors influencing natural and
anthropogenic mortality.Acknowledgements
Funded by the Gulf Council Erin E. Seney Donna J. Shaver
under award number NA15NMF4410011 Katherine L. Wendy G. Teas
Mansfield Mandy C. Tumlin
Melissa Cook Eduardo Cuevas
Allen M. Foley Scott RabornYou can also read