Poor and Minority Impacts from Hurricane Ike
←
→
Page content transcription
If your browser does not render page correctly, please read the page content below

Poor and
Minority Impacts
from
Hurricane Ike
Shannon Van Zandt, Ph.D., AICP

Research supported by a grant from the National Science Foundation
(#0928926) entitled Developing A Living Laboratory for Examining
Community Recovery and Resilience After Disaster and from a series of
grants funded by NOAA, the TGLO and the CCC. The authors and not the
NSF, NOAA, TGLO, or the CCC are responsible for the any findings and
opinions expressed in this presentation or the paper upon which it is
based. The full paper can be found in Housing Policy Debate, 22:1, 29-55

Objectives and outline
• Introduce group to “living laboratory”
  research from 2008’s Hurricane Ike on
  Galveston Island (TX)
  – My focus on social vulnerability factors,
    particularly as they relate to the spatial
    distribution of housing
• Highlight related findings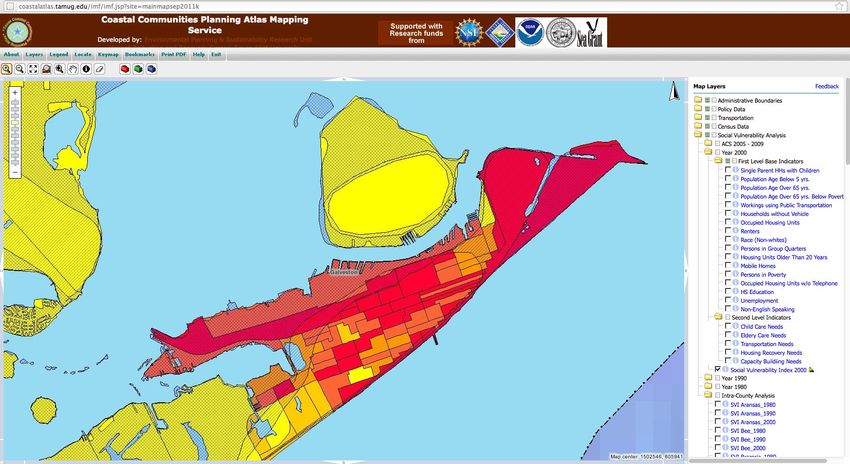
Geography of Opportunity
           • Sprawl, concentrated poverty,
             and segregation have shaped
             metropolitan areas in ways that
             exacerbate existing economic
             and social inequalities

           • The geography of opportunity is
             based on two main premises:
              – where one lives is critical for
                taking advantage of available
                opportunities;
              – households have unequal
                abilities to live in places with
                good opportunities
Inequalities may be due to:
• Discrimination in lending and real estate industries
• A lack of, and a poor distribution of housing
opportunities
Housing market segmentation
Uneven regional growth
Clustering of low-income housing
Consequences include:
Poorer access to opportunity
Greater exposure to hazards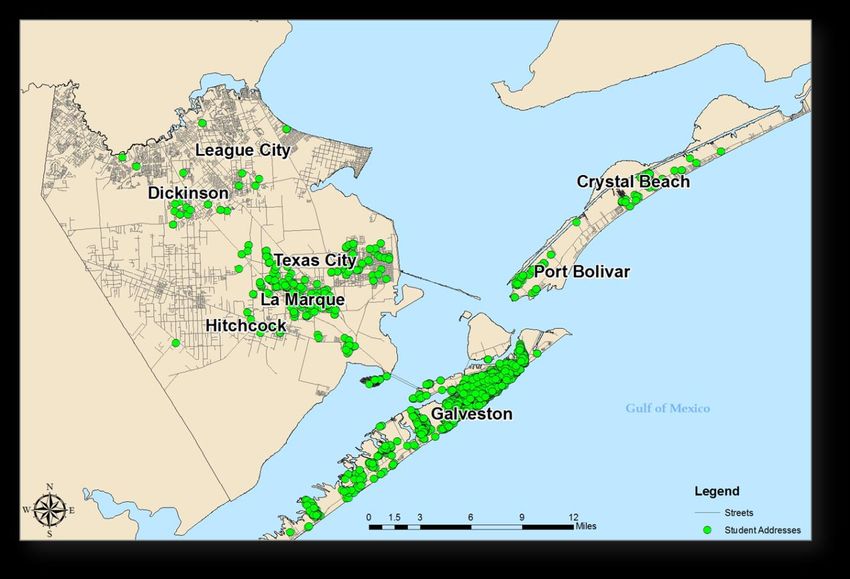
Housing inequalities determine the spatial
pattern of Social Vulnerability (SV)
Levels of Social Vulnerability Analysis

                                                                                             nd             rd
              Base Social Vulnerability Indicators (percentages)                            2 Order        3 Order
1. Single parent households with children/Total Households                                  Child care
2. Population 5 or below/Total Population                                                    Needs
3. Population 65 or above/Total Population                                                 Elder Care
4. Population 65 or above & below poverty/Pop. 65 or above                                   Needs
5. Workers using public transportation/Civilian pop. 16+ and employed                    Transportation
6. Occupied housing units without a vehicle/Occupied housing units (HUs)                     needs
7. Occupied Housing units/Total housing units
8. Persons in renter occupied housing units/Total occupied housing units                                    Socially
                                                                                           Temporary
9. Non-white population/Total population                                                   Shelter and     Vulnerable
10. Population in group quarters/Total population                                            housing        Hotspot

11. Housing units built 20 years ago/Total housing Units                                    recovery
                                                                                              needs
12. Mobile Homes/Total housing units
13. Persons in poverty/Total population
14. Occupied housing units without a telephone/Total occupied HU
15. Population above 25 with less than high school/Total pop above 25                     Civic Capacity
16. Population 16+ in labor force and unemployed/Pop in Labor force 16+                       needs
17. Population above 5 that speak English not well or not at all/Pop > 5
Source: Van Zandt, S., W.G. Peacock, *D. Henry, H. Grover, W. Highfield, and S. Brody. 2012. Mapping
Social Vulnerability to Enhance Housing and Neighborhood Resilience. Housing Policy Debate 22(1): 29-55.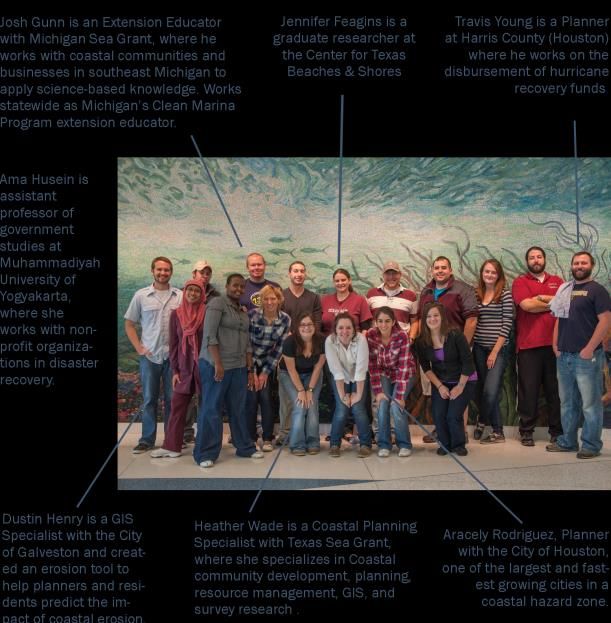
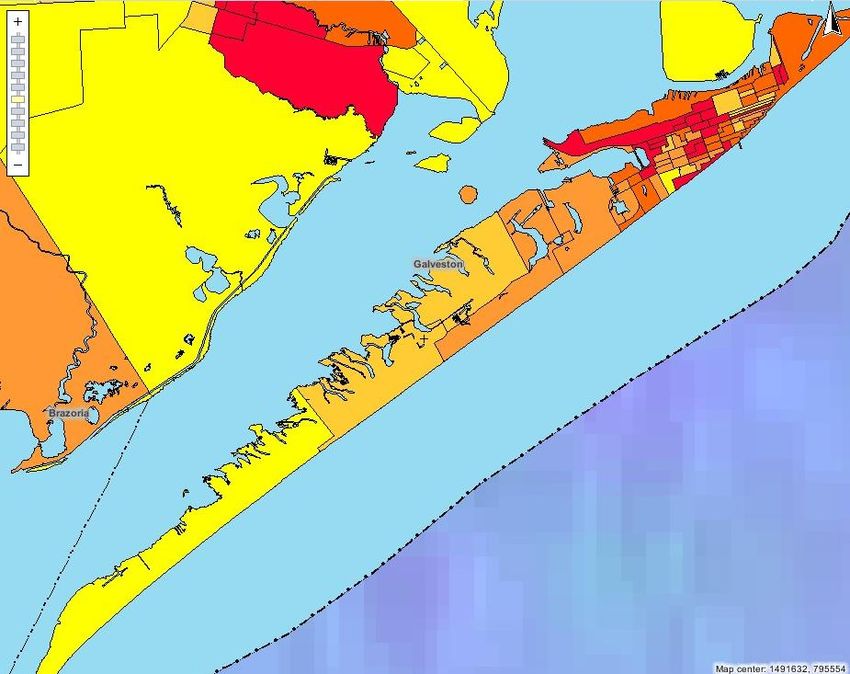
Example: SV indices overlaid with
Cat 1&2 surge zones

coastalatlas.tamug.edu
Hurricane Ike
• Hurricane Ike (Galveston, TX 2008)
  provided an opportunity to validate
  SV mapping technique and examine
  impacts for socially vulnerable groups
• Select study objectives
  – Did the spatial distribution of vulnerable populations
    mitigate or exacerbate damage and loss to property?
  – Do social vulnerability factors facilitate or impede
    decision-making with regard to dislocation and early
    repair/rebuilding decisions?
  – How do pre-existing physical and social development
    patterns alter the long-term recovery trajectories for
    socially vulnerable households and housing in
    physically and socially vulnerable neighborhoods?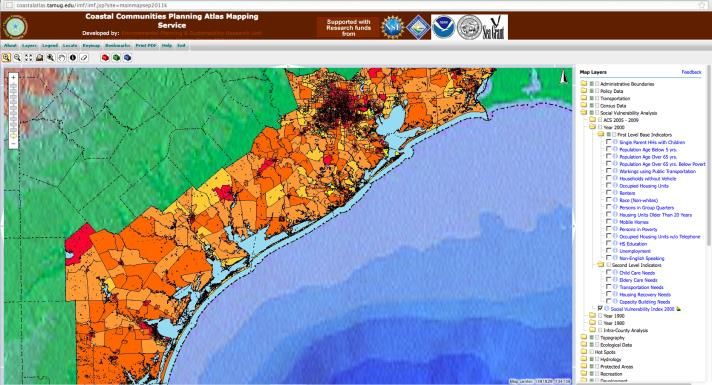
Data and methods
• Multiple data sources used:
  – Primary data:
     • Longitudinal panel survey of 1500 single family structures
     • Longitudinal panel survey of approximately 550 households
  – Secondary data sources
     • Galveston permit data
     • County appraisal district (CAD) parcel data
• Analyses include:
  – Correlation analysis of impacts and actions taken by
    socially vulnerable groups
  – Spatial analysis relating development patterns to damage
  – Longitudinal analysis of housing recovery
  – Long-term displacement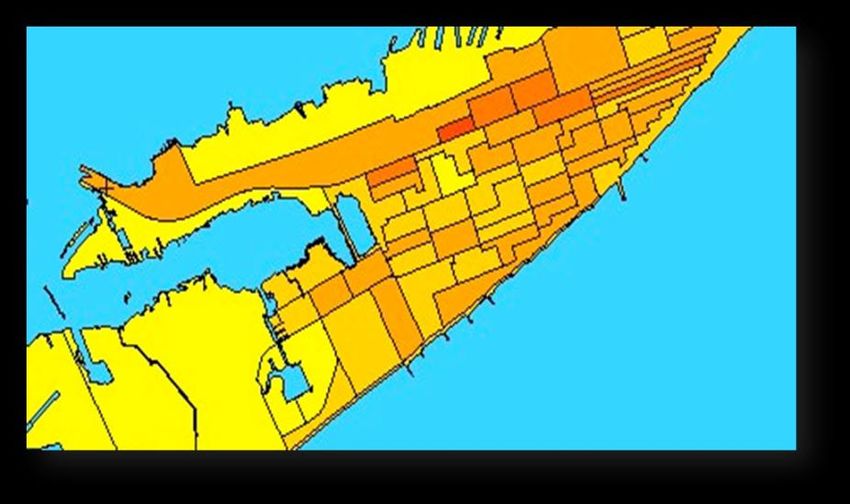
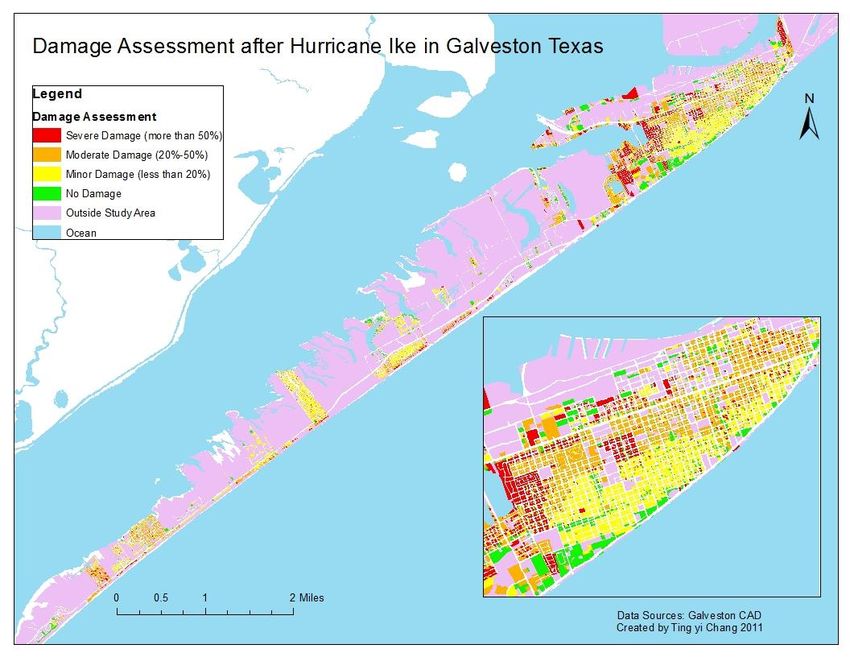
FINDING: Inequitable development
patterns affected damage received

  In the urban core of Galveston, many lower
  quality homes are only elevated a foot or
  less off the ground, if at all. Here, a poorly-
  constructed home has slid off its
  foundation, and the other structural
  systems have also collapsed.
In contrast, a West End vacation home
sits well above the surge level, a block
off the gulf coast, these high-quality
homes received only wind damage,
which as seen here, was quite minimal.
Transportation-dependent
  FINDING:                                    populations

 PREDICTED
 Using the Social
 Vulnerability
 Indicators from the
 Coastal Community
 Planning Atlas

                                                    r=-0.249*

 OBSERVED
 From Primary Data
 Collected After
 Hurricane Ike

                                                 Evacuated later
Source: Van Zandt, S., W.G. Peacock, *D. Henry, H. Grover, W. Highfield, and S. Brody. 2012. Mapping
Social Vulnerability to Enhance Housing and Neighborhood Resilience. Housing Policy Debate 22(1): 29-55.
Households with high
FINDING: recovery needs
PREDICTED
Using the Social
Vulnerability
Indicators from the
Coastal Community
Planning Atlas
r=-0.235*
OBSERVED
From Primary Data
Collected After
Hurricane Ike
Had higher levels of overall damage
Source: Van Zandt, S., W.G. Peacock, *D. Henry, H. Grover, W. Highfield, and S. Brody. 2012. Mapping
Social Vulnerability to Enhance Housing and Neighborhood Resilience. Housing Policy Debate 22(1): 29-55.FINDING: Households with high social vulnerability
PREDICTED
Using the Social
Vulnerability
Indicators from the
Coastal Community
Planning Atlas
r=-0.289*
OBSERVED
From Primary Data
Collected After
Hurricane Ike
Applied less to FEMA and SBA for aid
Source: Van Zandt, S., W.G. Peacock, *D. Henry, H. Grover, W. Highfield, and S. Brody. 2012. Mapping
Social Vulnerability to Enhance Housing and Neighborhood Resilience. Housing Policy Debate 22(1): 29-55.FINDING: Minority neighborhoods received
greater degrees of damage
Higher levels of damage seen to
minority neighborhoods—even
after accounting for the age of the
housing and the proximity of the
housing unit to water and the
seawall.
Source: Highfield, W., W.G. Peacock, and S. Van Zandt. 2013. Determinants of Damage to Single-Family Housing from
Hurricane-induced Surge and Flooding: Why Hazard Exposure, Structural Vulnerability, AND Social Vulnerability Matter in
Mitigation Planning. Conditional accept at the Journal of Planning Education & Research.FINDING: Lower-value homes
recovered more slowly
Single-Family Housing
$250,000 • The average property value
pre-storm was $152,155, and
$200,000
dropped 20.1% due to Ike
damage.
House Value
$150,000
• Average property values
$100,000
regained 95.5% of the pre-
storm value within two years.
$50,000
• Lower value homes
experienced greater damage,
$0
2008_09 2009_04 2009_09 2010_09 lost a greater proportion of
Appraisal date their value, and have only
5% Distribution of Damage recovered 82% of their pre-
No Damage storm value.
19%
Minor
37%
Moderate
39%
Severe
Source: Van Zandt, S. T. Chang, and W.G. Peacock. 2011. Residential Rebuilding After Disaster: Findings from
Galveston, TX. Association of College Schools of Planning, Salt Lake City, UT, October 14, 2011.Hispanic
FINDING: Long-term displacement White
African-American
of African-Americans Galveston
25%
46%
25%
Bolivar
1%
39%
51%
Mainland
42% 35%
Distribution of Students enrolled in GISD, January 2010
19%
Van Zandt, S. , W.G. Peacock, D. Henry, and S. Willems. Demographic Impacts of
Natural Disasters. Urban Affairs Association Annual Meeting, Pittsburgh, PA, April
21, 2012.Summary • Disparate impacts to SV populations and their housing generate the potential for redevelopment and population change, including: – Loss of affordable housing stock – Exacerbation of pre-existing inequities • Highlights need for: – Targeting of resources – Capacity-building within SV populations – Pre-event planning for equitable recovery
THE NEXT GENERATION
You can also read