TSUNAMI DESIGN FORCES FOR ABC RETROFIT
←
→
Page content transcription
If your browser does not render page correctly, please read the page content below
TSUNAMI DESIGN FORCES FOR ABC RETROFIT

                  Quarterly Progress Report
            For the period ending August 31, 2021

                        Submitted by:
                      PI- Marc Eberhard
                   Co-PI – Michael Motley
               Graduate Student- Nicolette Lewis

Affiliation: Department of Civil and Environmental Engineering
                   University of Washington

                         Submitted to:
                           ABC-UTC
                Florida International University
                           Miami, FL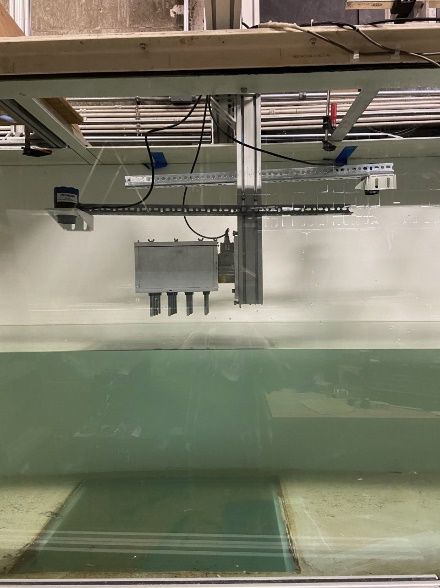
1. Background and Introduction
The catastrophic damage that tsunamis cause to coastal communities is often exacerbated by the
destruction of much of the transportation infrastructure (Fig. 1). This destruction delays critical
rescue efforts and economic recovery.
Many components of the transportation infrastructure can be damaged by the incoming tsunami
bore. Additional damage can be caused by the flow of water after the initial tsunami impact, at
which time the water is often carrying debris from other structures from structures located nearer
the coast (incoming flow) and structures further from the coast (outgoing flow).

                      Figure 1. Ponulele Bridge Destroyed by 2018 Tsunami

2. Problem Statement
The effects of the initial tsunami bore on bridges has been studied analytically and
experimentally by a number of researchers. For example, with funding from FHWA and five
state DOTs, PEER is currently coordinating a study in which the impact of a tsunami bore on a
bridge superstructure was simulated experimentally at the NHERI wave flume at Oregon State
University (OSU).
Our proposed research focuses on later, post-bore effects of tsunamis, which can be equally
damaging but have rarely been studied. The post-bore effects are dominated by quasi-steady-
state, debris-laden flows that cannot be simulated experimentally well in a flume with a transient,
piston-generated wave. No data is available to calibrate design or simulation models for this
condition. Such data is needed to develop ABC methods for the retrofit of bridges to resist
tsunamis.

3.   Objectives and Research Approach
UW and OSU researchers generated an initial set of data using the OSU wave flume. As shown
in Fig. 2, the force history (shown for an elevated structure) generated by debris includes
multiple impacts (sharp peaks in force history) and an accumulation of force as the debris
increases the hydraulic area of the bridge. The forces decrease rapidly with time, because the
transient wave lasted only a short time.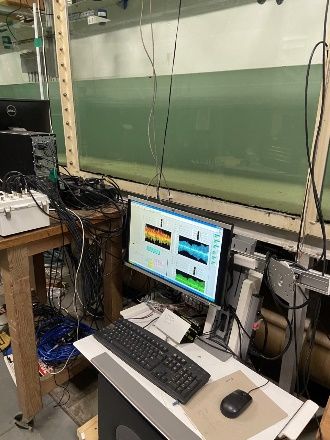
Figure 2. Measured Forces on Elevated Structure

Fig. 3 shows that the total measured force increased with the number of debris in the flow. For
eight blocks, this figure also shows that the total force varied greatly among the repetitions, a
behavior that is consistent with the semi-chaotic nature of debris interaction with the bridge. This
dataset is available from the NHERI DesignSafe data repository (PRJ-1709: NHERI Debris
Impact Experiments).

                      Figure 3. Effects of # Debris on Measured Peak Force

The ongoing research takes advantage of a new wind-wave-current interaction testing facility at
the University of Washington. This 18-m long by 1.2-m high by 0.9-m wide facility generates
currents with a centrifugal pump that enables quasi-steady flow conditions at a maximum
velocity of 1.0 m/s for at maximum depth or 2.0 m at half depth. Many structures do not
experience impact from the wave front of a tsunami; this facility can be used to model the
accumulation of debris, and the effect of rising flows on bridges.
The experiments will create datasets that be used to develop and calibrate design and numerical
models that account for flow-structure interaction, rising flow, and debris-induced forces.

4.   Description of Research Project Tasks
The following is a description of tasks carried out to date.
     Task 1 – Prepare for Tests.
Task #1 is 100% Complete
Establish forces for reference (no debris) flow conditions as a function of fluid velocity and
depth, and design test structure, support frame and instrumentation.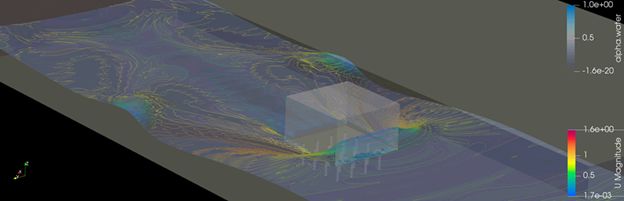
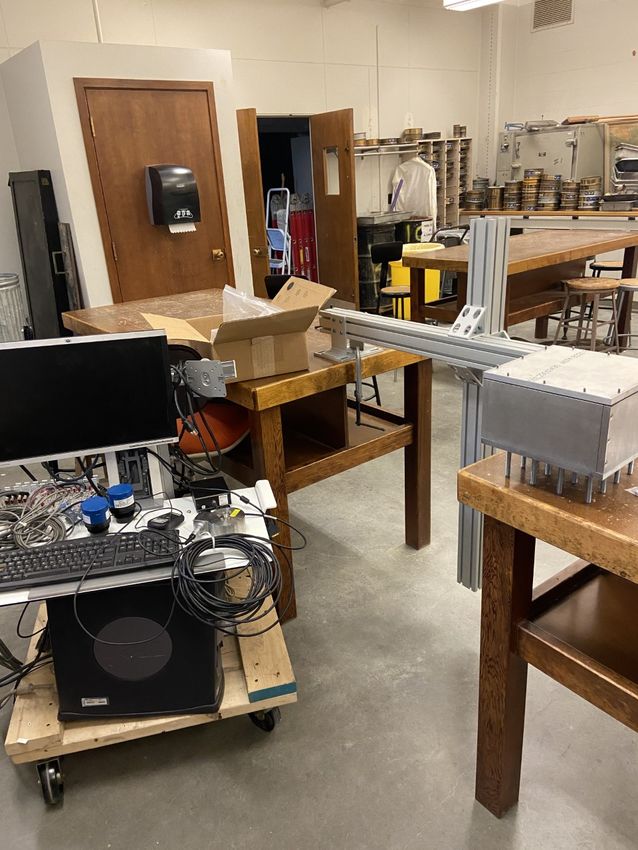
The fabrication of the test structure was
completed earlier this year, and last quarter we
purchased the data acquisition hardware needed to
collect and store the test data. Figure 4 shows an
isometric view of the test structure.
Figure 5 shows a 3D rendering of the test setup, in
which the current flows from left to right. The
structure (shown in grey in
middle of image) consists of
a waterproof box (fabricated
by Mechanical Engineering
Department Machine shop),
which has attachments to
accommodate a wide range
of columns numbers,
locations and heights. The
specimen is connected
through a 6-degree-of- Figure 5. 3D Rendering of Test Setup
freedom load cell to a
supporting frame (shown as
vertical I-beam downstream box). The rendering also shows (in orange) a debris field
approaching the structure. The blue cylinders depict ultrasonic gages to measure the elevation of
the water upstream and downstream of the structure. These instruments are also supported on
their own frames, which attach to the walls of the flume. During the experiments, we will also
use existing (and expensive) velocimeter instrumentation to measure current velocity.
To help estimate likely the magnitudes of forces expected in the tests, the team performed 3D
simulations using the OpenFoam simulation software (https://openfoam.org). Figure 6 shows the
results of a simulation of the fluid flow around the structure for the case in which debris is not
present.
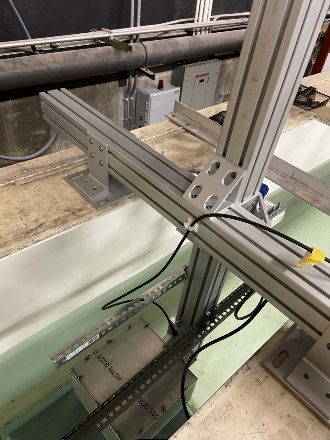
Figure 6. Typical Results of SimulationThe test setup has been assembled outside of the flume (Figure 7). The next step will be to calibrate the 6-DOF load cell before testing can begin in the WASIRF facility. Task 2 – Conduct Tests 50% of Task 4 has been completed Measure statistical distributions (at least 20 repetitions of each test) of impact and damming forces for numerous combinations of debris and flow characteristics. Initially, we might guide the debris with wires, so that the debris orientation can be controlled. Later (and more numerous) tests will start debris fields with a particular configuration but then allow the debris to reconfigure themselves as they approach the bridge. The main variables will be: (1) free-field flow depth, (2) free-field flow velocity, (3) # of debris/min., (4) debris shape, and (5) debris orientation. After long Covid-induced delays, the hydraulic laboratory is now available for experimental testing, and the testing began in the second week of August. It should continue until the end of the month and early September. Figure 8 shows three photographs of the test setup in the flume, including an elevation of the test setup, a top view of the Figure 7. In-Air Installation test setup, and the data acquisition system.
(a)             Elevation of Test Setup

(b)             Top View of Test Setup

(c)            Data Acquisition System

      Figure 8. Test Setup in Hydraulic Flume
Task 3- Develop and Document Design Tools.
No work has yet been performed on this task.
Develop tools to estimate the statistical distributions of debris impact and damming forces as a
function of the key test variables.
5. Expected Results and Specific Deliverables
The main deliverables will be:
• data from numerous experiments with a closed-system flume facility to provide the
statistical basis with which to estimate the forces generated by debris impacts and debris
damming.
• statistical estimates of forces on bridges as a function of debris and flow characteristics.
6. Schedule
Progress of tasks in this project is shown in the tables below.
Item % Completed
Percentage of Comple on of this project to Date 75%
Table 1. Schedule
Research Task 2019 2020 2021
J F M A M J J A S O N
1. Prepare for
Tests
2. Conduct
Tests
3. Develop
and Document
Design Tools
Completed Work
Planned Work
tiYou can also read