Climate Outlook Review - Northern Australia February 2019 Authors: Prof Roger C Stone & Dr Chelsea Jarvis - Centre for Applied Climate Sciences ...
←
→
Page content transcription
If your browser does not render page correctly, please read the page content below
Centre for Applied Climate Sciences

Climate Outlook Review –
Northern Australia

February 2019

Authors: Prof Roger C Stone
& Dr Chelsea Jarvis

University of Southern Queensland | Document title               1
2

Overview

   Rainfall: In terms of three-month total rainfall, our key forecast
   system utilising SOI phases suggests a continuation of seasonally
   averaged falls over most of Queensland but not the Top End of NT.
   However, there are higher probability values in Gulf County
   districts. Note that these forecasts are for three-month totals, not
   daily or weekly totals.
   Meanwhile, Bureau of Meteorology ACCESS model suggests below
   median rainfall for the region between approx. Charters Towers
   and Kingaroy in QLD and all of northern Western Australia. UK Met
   Office and ECMWF seasonal forecasts for northern Australia are
   also shown in the accompanying maps.

   The Australian and international long-term dynamic climate
   models that focus on forecasting central Pacific sea surface
   temperatures are continuing to predict further development and
   ‘coupling’ of an El Niño system within the next few months
   (February to April 2019). Over the past 3 to 6 months this El Niño
   development pattern has only been apparent in sea-surface
   temperatures while the atmosphere has remained fairly neutral.
   Consequently, most rainfall forecasts for northern Australia,
   especially north east Australia, currently indicate varying
   probability values of exceeding the respective long-term median
   rainfall. The SOI has fallen during January and the SOI phase-
   based forecast is indicating close to average rainfall for the three-
   month period, relative to this time of the year.

   The average Southern Oscillation Index (SOI) value for the month
   of January was close to minus 2.2 (-2.2).

   .
3
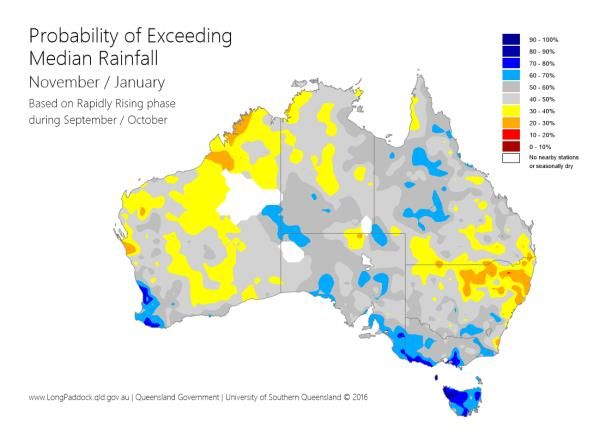
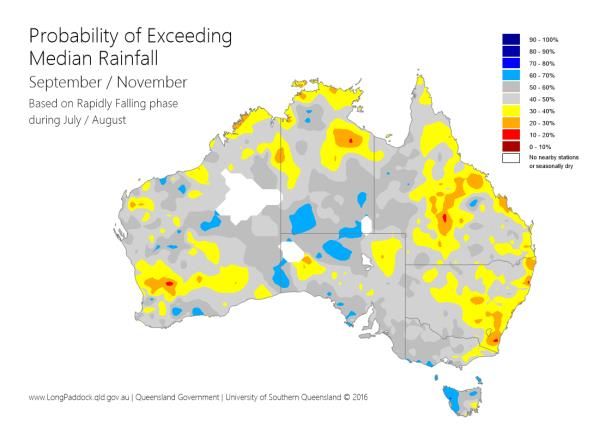
Figure 1: Using the SOI phase system, the ‘probability of exceeding median rainfall’
values for Australia for the overall period February to April 2019 based on ‘rapidly
falling’ SOI pattern during December and January. Regions shaded blue have a 60%-
70% probability of exceeding median rainfall values. Regions shaded darker grey
have a 50%-60% probability of exceeding median rainfall values and regions shaded
lighter grey have a 40% to 50% probability of exceeding median rainfall values.
Regions shaded yellow have a 30%-40% probability of exceeding median rainfall
values relative to this period.
Figure 2: Chances of
exceeding median pasture
growth for Australia for
February to April 2019 period.
This output integrates
antecedent moisture and
forecast rainfall, temperature,
within a pasture growth model
and the SOI phase forecast
system.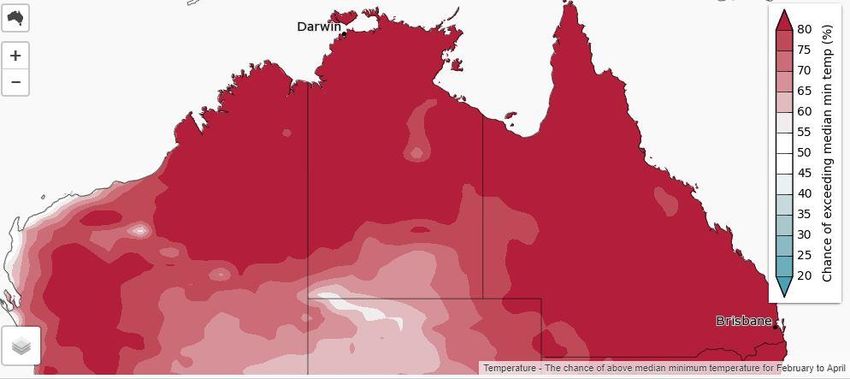
4

The Southern Oscillation Index:

The Southern Oscillation Index (SOI) is an index based on the difference between
surface pressure in Darwin, Australia and Tahiti, which are related to ENSO phases.
The SOI phase system is based on principal components and cluster analysis and
consists of five different categories that take into account both rate of change and
consistency in the SOI.

Figure 3: Monthly SOI values since January 2010 showing the five SOI phases.
The most recent phase was ‘rapidly falling' phase, reflecting a continuing widely
oscillating SOI. The most recent 30-day average value to 31 January, was close to
minus 2.2 (-2.2).

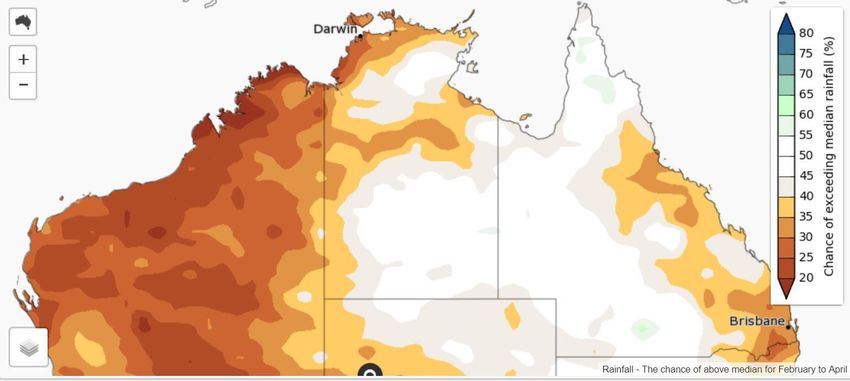
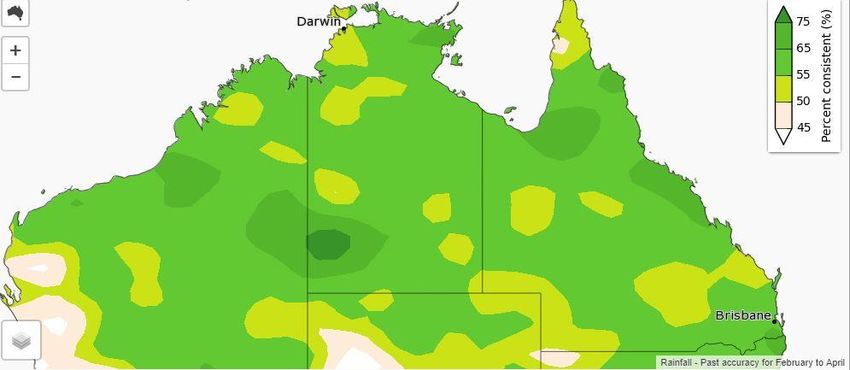
5

Australian Bureau of Meteorology forecasts:

Figure 4: Bureau of Meteorology Forecast ‘Chance of exceeding median rainfall’
values for northern Australia for the overall period February to April 2019. Using this
forecast system, all of northern WA, parts of NT, and eastern QLD have less than a
40% chance of exceeding the median for these months.

Figure 5: Past accuracy of rainfall from February to April 2019, indicating how
accurate past rainfall forecasts have been for these months.
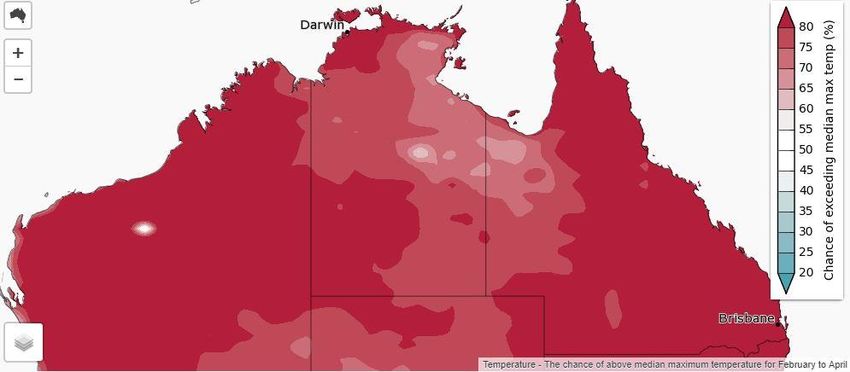
6

 Figure 6: Bureau of Meteorology Forecast ‘Chance of exceeding median maximum
 temperatures’ for northern Australia for the overall period February to April 2019. The
 majority of northern Australia is showing ~60% chance of exceeding median
 maximum temperatures.

Figure 7: Bureau of Meteorology Forecast ‘Chance of exceeding median minimum
temperatures’ for northern Australia for the overall period February to April 2019. The
majority of northern Australia is showing ~70% chance of exceeding median maximum
temperatures.
7

Longer-term forecasts:

The UKMO and ECMWF models provide useful assessments of longer-term rainfall
probability values for northern Australia (and other agricultural regions). The
UKMO example and ECMWF examples suggest (beige areas) are between a 20-
40% probability of above median rainfall for February to April 2019 for some
regions of northern Australia, with white shaded areas suggesting close to
climatology .

 Figure 8: UKMO forecast map: Probability of above median precipitation during the
 months of February, March and April. Using this system from the UK Met Office, for
 of northern Australia, there is a 20-40% chance of receiving above median rainfall.

8

Figure 9: ECMWF forecast rainfall probability values for northern Australia – and
the region generally for February, March and April 2019 (Courtesy ECMWF).
Many regions in northern Australia indicate about a 20-40% probability of above
median rainfall for this seasonal period.

Figure 10: ECMWF forecast rainfall probability values for northern Australia – and
the region generally for May, June and July 2019 (Courtesy ECMWF).
Most regions in Australia show about a 20-60% probability of above median rainfall
for this seasonal period.
9

Explaining the differences between models:

BOM, UKMO, and SOI rainfall ‘Probabilities of exceeding median’ differ slightly.
This is due to the BOM and UKMO using dynamical models for predicting rainfall,
while the SOI phase is applied as a statistical system. Dynamical models use the
current state of the oceans and atmospheres combined with our understanding of
the physical processes behind weather and climate to forecast the likelihood of
future rainfall. Each dynamical model is based on certain model calibrations, which
differ from model to model, providing slightly different outcomes. Statistical
models use historical climate data to determine when conditions were similar in
the past and what rainfall resulted from those past conditions.
While all of the models may be slightly different, it is important to focus on the
overall predicted outcomes. All three of the models presented here show that there
is an average to below average likelihood of receiving median rainfall when
assessed over a three month period.

El Niño-Southern Oscillation (ENSO)

ENSO events generally begin in the Southern Hemisphere winter, peak during
summer, and then usually end during autumn. The El Niño phase is often
associated with warmer and drier conditions while La Niña phases are often
associated with cooler and wetter conditions. The main areas of Australia impacted
by ENSO phases are the eastern seaboard, north-eastern Australia and south-
eastern Australia. Currently, ENSO conditions are neutral, with some models
predicting an El Niño phase beginning sometime in January or March while other
models predict neutral conditions to prevail. Impacts of and El Niño (dry and warm
conditions) can occur even if conditions do not meet thresholds for an official event
and can occur in eastern Australia while El Niño is developing.
10
Madden Julian Oscillation (MJO)
MJO impacts weather in tropical Australia (and occasionally in higher latitude
areas) on a weekly to monthly timescale. According to BoM‘s and NOAA’s
forecasting system and USQ’s analysis, the MJO was mainly active over areas that
impact Australia from about the 18-26 January (areas 4, 5, & 6), which likely
helped deepen the monsoon trough and increased the chances of rainfall. At this
time of year, if the MJO is active in phases 8, 1, & 2, it can bring drier conditions
to parts of northern Australia. It would most likely return around early March.
Please also refer to the interesting NOAA website (below) for updated information
on the MJO.
Figure 11: MJO phase diagram for 5 to 19 February 2019. The purple line
shows values for December and the red line for January. The numbers
indicate the day of the month. When the line is in the circle, it indicates a
weak/inactive MJO phase and when the line is outside of the circle, the MJO
is active with strength indicated by distance from circle. The area shaded in
grey containing yellow lines indicates the ensemble plume prediction for 5 to
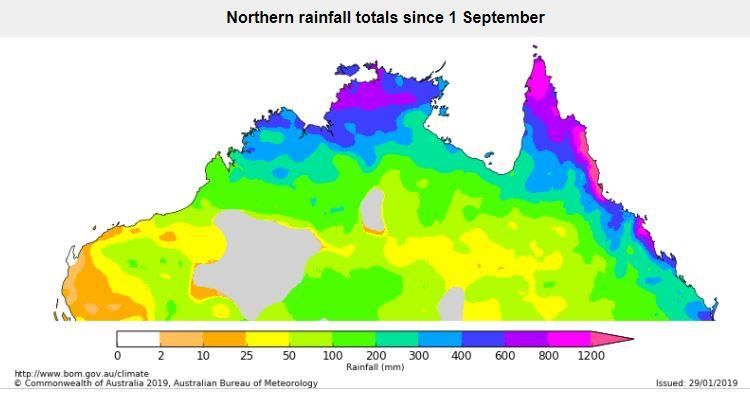
19 February, with the green line showing the ensemble mean.11 Monsoon/Wet Season Onset (Included seasonally) Figure 12: Northern Australia rainfall totals from 1 September to 29 January 2019 Figure 13: Number of days earlier or later than the long-term average of receiving at least 50mm after 1 September. Grey areas have not yet received 50mm.
12

Recent SOI-phase forecast maps

As these forecasts are issued for a three-month validity on a rolling monthly basis, it
has been decided to provide a continuous reference to these forecasts, as below:

Seasonal climate forecast valid                 Seasonal climate forecast valid
1 February to 30 April 2019                     1 January to 31 March 2019

 Seasonal climate forecast valid                Seasonal climate forecast valid
 1 December 2018 to 28 February 2019            1 November 2018 to 31 January 2019

Seasonal climate forecast valid                 Seasonal climate forecast valid
1 October to 31 December 2018                   1 September to November 2018
13
For further information, click on the following links:
For the MJO
For weekly SSTs
For easterly (and westerly) wind anomalies across the Pacific
For sub-surface temperatures across the Pacific
For ECMWF forecast products (note the web site for this output has
changed)
For ‘plume’ forecasts of SSTs in the central Pacific
For a complete history of the SOI
The Long Paddock
Additional information on ENSO
USQ Research
Centre for Applied Climate Sciences
Please email Prof Roger Stone at
Roger.stone@usq.edu.au
This work is currently funded by Meat and Livestock Australia Donor
Company, the Queensland State Government through the Drought and
Climate Adaptation Program and the University of Southern QueenslandYou can also read