Experiences with U.S. National Election Polling in 2016 and 2020
←
→
Page content transcription
If your browser does not render page correctly, please read the page content below

Experiences with U.S. National Election
       Polling in 2016 and 2020
Using a Probability-based Internet Panel and
      Experimental Outcomes Models

        Jill E. Darling, Survey Director
        Understanding America Study
   Center for Economic and Social Research
       University of Southern California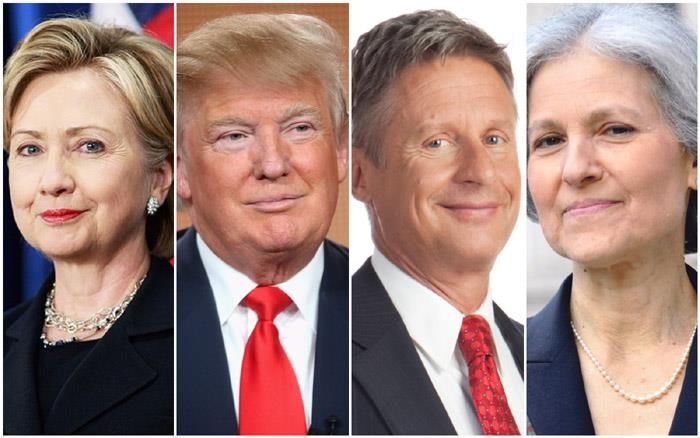
Data collection funded by NSF, and USC Dornsife
                                                                                   2
February 5, 2021 WAPOR Webinar
The Understanding America Study Methodology
Probability-based internet panel of 9000+ adults
  • Founded 2014 at USC Center for Economic and Social Research
  • Address-based sample for a representative sample of U.S.
  • Internet-connected tablets provided as needed
  • Multi-mode & multi-step English/Spanish recruitment
  • 14% recruitment rate into the panel, 75%-80% survey RR
  • Panel burden is low
     • 1 to 3 surveys a month in English or Spanish
     • Compensation is $3 for every 5 minutes of survey time
     • Almost no one is in another survey panel
  • Two-stage weights adjust for sample design, non-response

                                                                   3
                                  February 5, 2021 WAPOR Webinar
Probability of Own Vote
            • What is the percent chance that you will vote in the presidential election?
            • If you do vote in the election, what is the percent chance that you will vote for
              Donald Trump? For Joe Biden? And for someone else?

           Probability of one’s Social Circle Vote
           • What percentage of your social contacts that live in your state are likely to vote in
Measures      the 2020 U.S. presidential election?
            • Of all your social contacts who live in your state and are likely to vote in the 2020
               U.S. presidential election, what percentage do you think will vote for Donald
               Trump? For Joe Biden? And for someone else?

           Probability of the vote at State and National Level
               Of all people who live in the U.S. / your state and are likely to vote, what
               percentage do you think will vote for Donald Trump? For Joe Biden? And for
               someone else?

                                                                                                      4
                                  February 5, 2021 WAPOR Webinar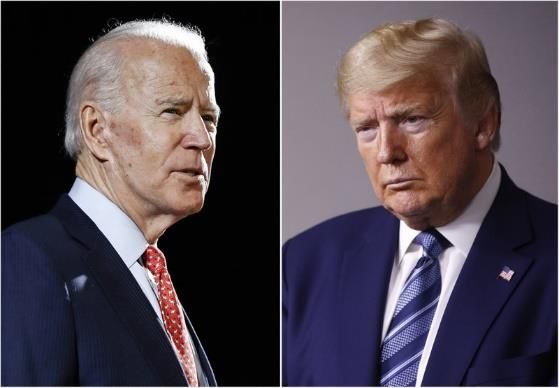
UAS Presidential Election Tracking Polls – 2016 and 2020
                     The Daybreak Poll

                                                           5
                     February 5, 2021 WAPOR Webinar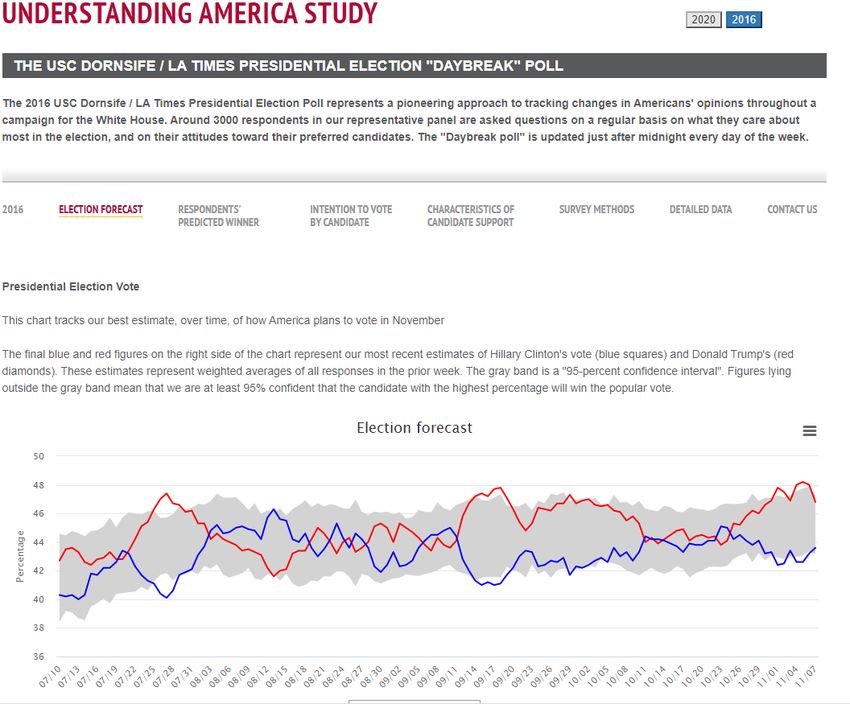
UAS Tracking Poll – 2016
                               4000+ participants assigned a day of the week
                               7-day waves, 18 waves starting in July
                               Graphs updated daily with rolling 7-day averages
                               Microdata available in real time
                               3 measures in the tracking + social circle in extra polls
                                 1. Own probability of voting in the election
                                 2. Own probability of voting for each candidate
                                 3. Percent chance that each candidate would win

                                                                                           6
             February 5, 2021 WAPOR Webinar
UAS Tracking Poll – 2020
5500+ participants assigned a day of the week
14-day waves, 6 waves starting in August
Graphs updated daily with rolling 7-day (and then 14-
day) averages
6 Measures in the tracking poll:
   1. Own probability of voting in the election
   2. Own probability of voting for each candidate
   3. Prediction of National vote
   4. Prediction of State vote
   5. Probability of how Social Circle would vote
   6. Categorical “if the election were held today”

                                                                                7
                                               February 5, 2021 WAPOR Webinar
UAS Tracking Poll – 2016 Events
                        1. The DNC and RNC party conventions in
                           July ended with Hillary Clinton as the first
                           female nominee for president
                        2. Clinton called Trump and his supporters a
                           “basket of deplorables”
                        3. Clinton stumbled due to illness at an
                           event, after Trump saying she was weak
                        4. Donald Trump was seen on Access
                           Hollywood video making lewd comments
                           about grabbing women
                        5. The head of the FBI revealed they were
                           investigating Clinton’s use of a personal
                           email server while she was Secretary of
                           State

                                                                      8
             February 5, 2021 WAPOR Webinar
UAS Tracking Poll – 2020 Events
1. Party conventions were virtual for the first time in
   history. Democrats nominated the first African
   America/Asian female vice president in history
2. Police killed George Floyd in May; months of angry
   and sometimes violent protests across the country
3. Changes to the U.S. postal service created
   slowdowns in service, while voting by mail spiked
4. Donald Trump and others politicized the U.S.
   response to the pandemic, belittling people for
   wearing masks and calling for states to open up.
5. Donald Trump cast doubt on the reliability of voting
   by mail, and early vs. in person voting was
   politicized
6. Liberal U.S. Supreme court justice Ruth Bader
   Ginsberg died; the majority Republican Senate
   confirmed a conservative replacement, days before
   the presidential election.

                                                                                  9
                                                 February 5, 2021 WAPOR Webinar
Other challenges
Election polling comes with the mixed blessing of nearly instant feedback on
the accuracy of your approach, in a normal year
   • We conduct a post-election poll immediate after the election gives us vital
     information about how panel members actually voted and to assess their reactions
     to the outcome
   • We also compare our outcomes to the actual vote, and take stock of where things
     worked and where they did not
This year, the massive turnout, coupled with unprecedented levels of mail
voting, slowed the vote count. Challenges by the Trump administration to
try to overturn the vote counts in several states also contributed to delayed
results.

                                                                                        10
                                  February 5, 2021 WAPOR Webinar
In 2020, Biden led in our own probability of voting measure, often by double
digits, ending at 11 points (factoring in the full wave it is 9 points).
Average at FiveThirtyeight.com had similar Biden leads, ending with 8 points.
Fivethirtyeight.com
53.5% Biden
42.6% Trump
Own probability of voting
11
February 5, 2021 WAPOR WebinarPost-Election Insights
• Our Own-Probability questions did a great job of
• predicting overall likelihood of voting (within-person) and actual vote for the candidates.
• Predicting their likelihood of voting for Trump or Biden
• So… we seem to be missing some voters
• We measured evidence of voter suppression but not to a level where it could
have played a significant role in the outcome
• We are missing some of the late deciders, which would have brought Trump’s
percentage up in the own-vote, but not enough to get us to the outcome
• Trump won among election-day deciders (10% of the electorate)
• The candidates tied among people who made up their mind within the week before the
election (19% of the electorate)
12
February 5, 2021 WAPOR Webinar2020 UAS Model Comparison
Own Probability of voting for Trump/Biden Social Circle Probability of voting for Trump/Biden
9 or 11 point Biden lead 4 point Biden lead – Spot On
13
February 5, 2021 WAPOR WebinarWhy do Social Circle methods work better?
• It may help include people who are otherwise difficult to get to talk to us in a poll.
They may not want to answer polling questions, they may not trust universities or the
media, or they just may be a hard to reach group.
• Indirectly increases sample size of the poll
• This is related to, but different than the hidden voters idea, which is that some people
may not tell us that they are voting for a very polarizing candidate. The team tested this
using social circle methods: low incidence overall, but higher predictions of each of
these behaviors for a person’s social circle among Trump voters.
• Embarrassment (~10%)
• Fear of harassment (~10%)
• Wanting to skew poll results (~ 5%)
• It may help us include votes from people who decide who they will vote for on
election day. So far in our data, it looks like that is about 10% of voters. Many of these
late deciding voters may well be influenced by the decisions made by their friends and
family
14
February 5, 2021 WAPOR WebinarRelevant Citations and Links
• Galesic, M., Bruine de Bruin, W., Dumas, M. et al. Asking about social
circles improves election predictions. Nat Hum Behav 2, 187–193 (2018).
https://doi.org/10.1038/s41562-018-0302-y
• Galesic, M., Bruine de Bruin “Election polls are more accurate if they ask
participants how others will vote” The Conversation, November 18, 2021
• Darling, J., Gutsche, T. “It is Finally Election Day” Evidence Base, November
3, 2021
15
February 5, 2021 WAPOR WebinarThank you!
Jill Darling
JillDarl@usc.edu
Center for Economic and Social Research (cesr.usc.edu)
Panel methodology, survey data and documentation (UASdata.usc.edu)
Tracking poll graphs and methodology (elections.usc.edu)
16
February 5, 2021 WAPOR WebinarYou can also read