Solar Virtual Observatory for millimeter wavelength survey
←
→
Page content transcription
If your browser does not render page correctly, please read the page content below
Boletim da Sociedade Astronômica Brasileira, 31, no. 1, 25-27
c SAB 2020

Solar Virtual Observatory for millimeter wavelength survey
V. Lessa, I.F. Santos,, & A. Valio
      1
          Mackenzie    Presbyterian         University;      e-mail:       vslessa@terra.com.br, israel.santos@mackenzie.br,
          avalio@craam.mackenzie.br
      Abstract. The study of the Sun is a very important area of astronomy due to its effects on the Earth. The objective of this work is to
      develop a Virtual Observatory to store data observed by the POEMAS polarimeters and the automatic detection of flares at 45 and 90
      GHz.
      Resumo. O estudo do Sol é uma área da astronomia muito importante, devido aos seus efeitos na Terra. O objetivo desse trabalho é
      desenvolver um Observatório Virtual para disponibilizar aos especialistas, dados de explosões solares observadas pelos polarímetros
      POEMAS (POlarização de Emissão Milimétrica da Atividade Solar) e a detecção automática de explosões observadas em 45 e 90
      GHz.

      Keywords. Virtual observatory tools – Sun: flares – Telescopes

1. Introduction
Currently, with the evolution of technology such as the devel-
opment of space and ground observatories great amount of data
can be collected. To process the data quickly for analysis is a
challenge for experts.
    The study of solar activity is very important due to its effects
on Earth. The importance of analyzing the radio spectrum and
polarization of solar flares at millimetric wavelengths to under-
stand:

 – Particle Acceleration Mechanisms.
 – Magnetic field configuration.
 – Population of energetic particles.                                     Figure 1. POEMAS (POlarization Emission of Millimeter
                                                                          Activity at the Sun). Valio (2013)
    The Center for Radio Astronomy and Astrophysics at
Mackenzie (CRAAM) monitors solar activity by collecting
data from different telescopes in the Southern Hemisphere
and is responsible for the operation of several experimen-
tal resources. For the CRAAM-SVO project, we highlight
the Solar Submilimetric Telescope (SST) and the telescopes
for POlarization Emission of Millimeter Activity at the Sun
(POEMAS).
    The POEMAS (Fig. 1) is a system of two telescopes
that monitors the Sun, operating in two bands of millimeter
wavelengths (45 and 90 GHz). This unique circular polariza-
tion Telescopes were installed at the observatory El Leoncito
Astronomical Complex (CASLEO) – in Argentina and oper-
ated from 11/2011 to 12/2013. Currently it is being repaired in
Germany and should be back in operation by the end of 2018.               Figure 2. Architecture of the CRAAM-SVO.
    A Virtual Observatory (VO) consists of a set of data and in-
formation with tools for access and research that allow the com-
parison of data with other facilities of the astronomical commu-          2. Methodology
nity. The CRAAM-SVO (Solar Virtual Observatory) allows the
astronomer to make global electronic access to data files and             The architecture of the CRAAM-SVO (Fig. 2) is composed of an
analysis results. The CRAAM-SVO makes available the data as               application server that supports requests from users and partner
FITS (Flexible Image Transport System) files. The project is be-          research centers. This component is developed in the Java archi-
ing developed in Python and using Django as a framework. We               tecture using the JPA and Jena frameworks for integration to the
hope this data will disseminate to the community interested in            Virtuoso database through SQL and RDF / XML, respectively,
studying millimetric emission of the Sun.                                 in addition to the API for generating FITS files for data sharing.

                                                                                                                                               25
V. Lessa et al.: Solar Virtual Observatory for millimeter wavelength survey
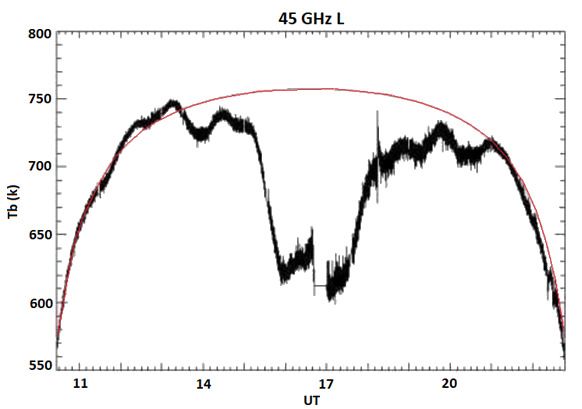
Figure 4. Diurnal Variation (Silva 2016).
Figure 3. CASLEO: DBServer.
After the solar observation performed by POEMAS, the data
are stored in binary files and forwarded for analysis to the Radio
Astronomy and Astrophysics Center (CRAAM). The binary files
used in this work have TRK (* .TRK) extension, Sun Tracking
Brightness Temperatures.
The TRK file has the number of frequencies (always 2 - 45
GHz and 90 GHz), the maximum and minimum brightness of the
file, the date (YYYY - MM - DD) and the time (HH - MM - SS)
and the elevation and azimuth angles (the position of the sun
on the sky), the Right - R and Left - L polarization brightness
temperatures of the two frequencies (TBR45, TBL45, TBR90
and TBL90). The Telescope stores 100 records per second. In 1
day of observation, we have approximately 320 MBytes.
After reading the binary file a FITS file is generated. FITS is
a widely used file format in the astronomy community for stor-
ing images and tables. A FITS file contains a sequence of header
units, and in each of them there are records describing the fol-
lowing dataset. For each Extension Header of the FITS file we
have the Subheader data from the FITS file (date, time, elevation
angles and azimuth). In the dataset we have TBL45, TBR45,
TBL90 and TBR90 records.
The data will be stored in a CASLEO: DBServer database.
In Fig. 3 we have the relationship entity diagram where we show
a flow diagram of the relationship between entities (POEMAS,
Figure 5. Subtraction of the previous and/or the next day emis-
Polarization, Frequency and Observation). This diagram was
sion (Silva 2016).
used to design the project database with the POEMAS data.
We apply a running mean on the reference curve. With the
3. Solar Data overlap of the observations in the three days, the coincidence
The data recorded by the telescopes present a great challenge of between the reference curves (blue and red) and the day of the
processing, analyzing, storing and understanding the large vol- observed event (black), shows that there is little change from one
ume of data generated. For the data on the web we will use Big day to another. Due to this small variation, we can use the data
Data Analytic techniques to be discussed in future works. from the days before or after to correct the diurnal variation, thus
As sun from tipycal observation day is shown in Fig 4 there obtaining the excess flux due to the solar flare.
is a diurnal variation in flux due to the misalignment of the tele- The light curve of the flare after the background subtrac-
scope. The expected variation of the millimeter emission during tion is depicted in Fig. 6. The gradual component of the flare is
the day is shown by the red curve. However what is observed clearly at 45 GHz, which was not evident before the subtraction
by POEMAS is the black curve, where it is evident the variation process.(Fig. 6)
close to noon due to instrumental problems.
To solve this problem, we carry out a subtraction of the pre-
4. Conclusions
vious and/or the next day observation (when available) of the
same polarization brightness temperature. An example of this This work is part of a larger project developed by CRAAM re-
proceedure is shown in Fig 5, on 27 Jan 2012. On this day, a searchers and students. To reach our goal a great deal of pro-
flare occurred, shown by the Greenwich. The background used gramming, researching, and testing is needed, such as:
for subtraction is a combination of the previous day (red curve)
and the next day (blue curve), also shown before subtraction. – Big Data Analytics for CRAAM-SVO.
26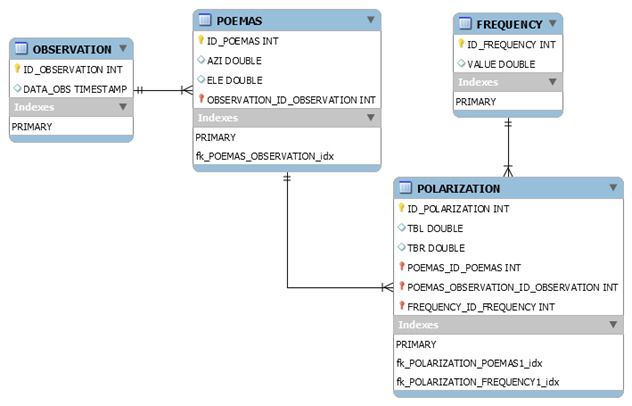
V. Lessa et al.: Solar Virtual Observatory for millimeter wavelength survey

Figure 6. Light curve of the flare after the background subtrac-
tion (Silva 2016).

 – Online pipeline calibration for background subtraction;
 – Artificial Intelligence process to automatically detect solar
   flares.
Acknowledgements. We thank MackPesquisa, the research funding programme
of the Instituto Presbiteriano Mackenzie and FAPESP (Fundação de Amparo à
Pesquisa do Estado de São Paulo)

References
Valio, A. et al., Polarization Emission of Milimeter Activity at the Sun
   (POEMAS): New Circular Polarization Solar Telescopes at Two Milimeter
   Wavelength Ranges., Solar Physics 283(2):651-665, 2013.
Silva, D. F. - Análise de explosões solares em 45 e 90 GHz
   observadas     por     POEMAS        com     medidas   de  polarização,
   http://tede.mackenzie.br/jspui/handle/tede/1310

                                                                                                                  27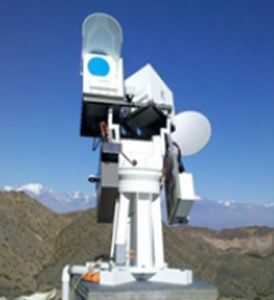
You can also read