2021 ATLANTIC HURRICANE OUTLOOK - PRESENTED BY: ANTHONY SAGLIANI AND ALYSSA ROBINETTE MAY 13, 2021 - Earth Networks
←
→
Page content transcription
If your browser does not render page correctly, please read the page content below

2021 ATLANTIC HURRICANE OUTLOOK
 PRESENTED BY: ANTHONY SAGLIANI AND ALYSSA ROBINETTE
                                         MAY 13, 2021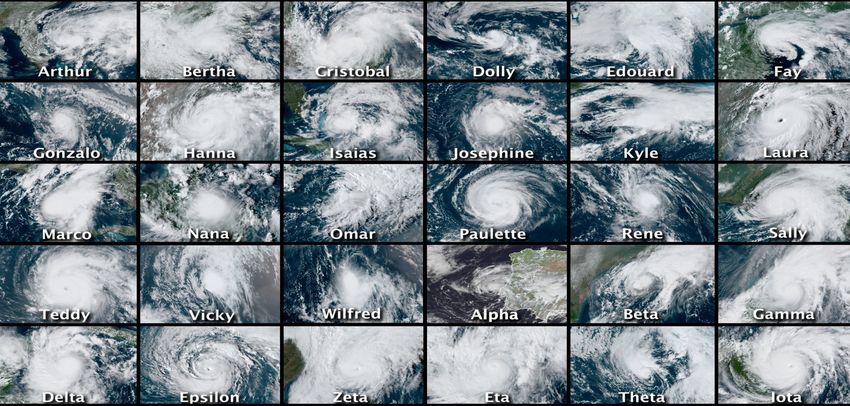
BEFORE WE GET STARTED…

Got questions?
During the webinar, use the “Ask Question” feature.
After the webinar, send questions to info@earthnetworks.com.

We can’t hear you.
You are in “listen only mode” and your microphone is muted.

On the go?
Download the “GoToWebinar” app on your smartphone or tablet to watch live.                    Question Box

         And yes, this webinar is being recorded and the recording will be provided to you.

                                                                                                       2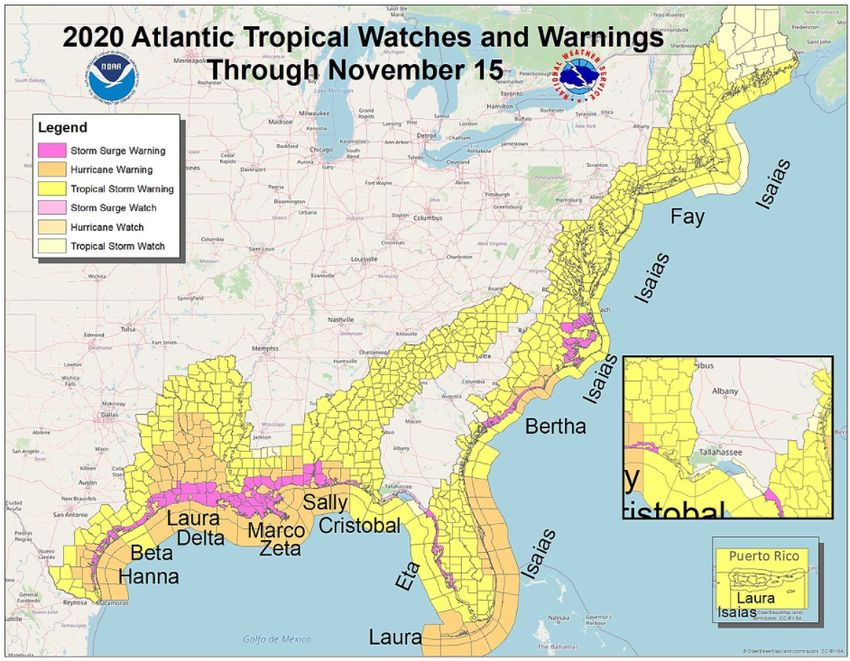
2021 HURRICANE OUTLOOK METEOROLOGICAL TEAM

                    ALYSSA ROBINETTE                       FRED ALLEN
                       Meteorologist                       Meteorologist
 ANTHONY SAGLIANI                      JAMES AMAN                          JOHN BENEDICT
    Meteorologist                      Sr. Meteorologist                    Meteorologist

                                                                                            3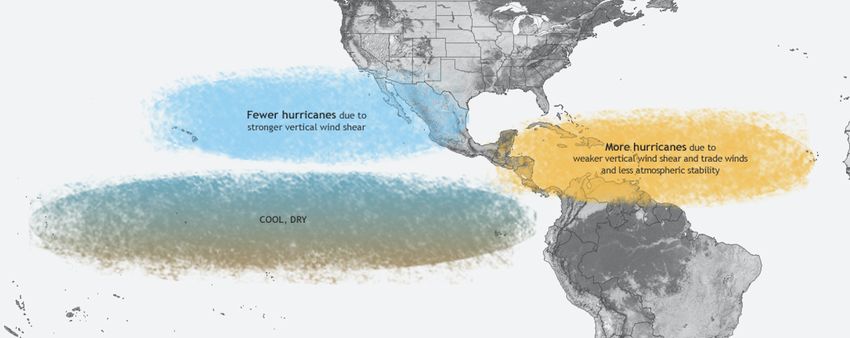
REVIEW OF 2020 HURRICANE SEASON

                                  2020 TOTALS
                                  •   30 Tropical Storms (R)

                                  •   14 Hurricanes

                                  •   7 Major Hurricanes (Tie R)

                                                                   4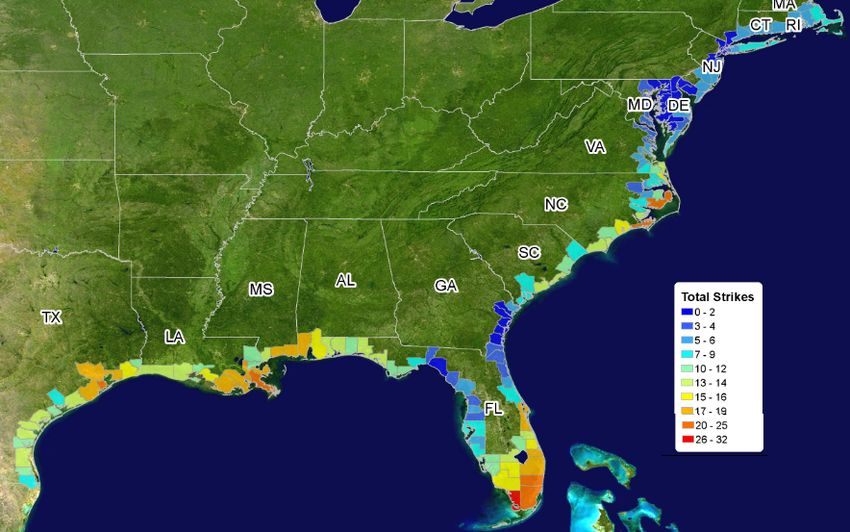
THE 2020 ATLANTIC HURRICANE SEASON

                                     5
REVIEW OF 2020 HURRICANE SEASON

                                  Tropical watches and
                                  warnings issued in
                                  every coastal county
                                  except Wakulla and
                                  Jefferson in Florida

                                                         6
VERIFICATION OF 2020 HURRICANE OUTLOOK

                       May Forecast   July Update   2020 Actual

          ACE             150            175           180

     Named Storms          16            22            30

       Hurricanes           9            11            14

    Major Hurricanes        4             5             7

                                                                  7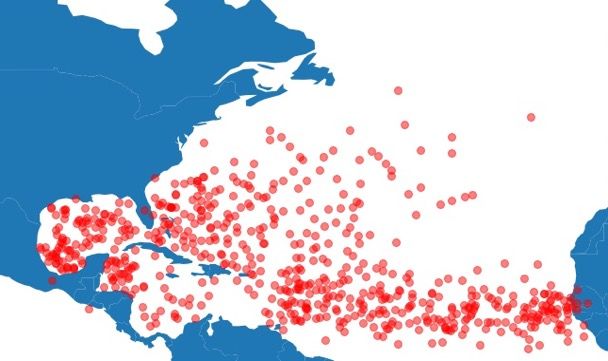
CLIMATOLOGY OF ATLANTIC TROPICAL CYCLONES

                                            •   Occasional storms
                                                develop early
                                                (before June 1)

                                            •   Peak activity in
                                                early September;
                                                secondary October
                                                peak

                                            •   August-October
                                                primary time for
                                                major hurricanes

                                                                    8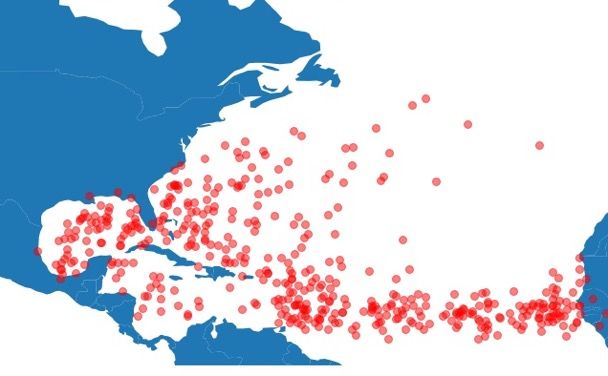
NEW CLIMATE NORMALS FOR 1991-2020

                                    •   14 named storms,
                                        7 hurricanes,
                                        3 major hurricanes

                                    •   This only includes active
                                        era of Atlantic storms
                                        that began in 1990s

                                    •   We will use 1950-2020
                                        for climate normals to
                                        get a better scope of
                                        the range of possible
                                        seasonal activity

                                                                    9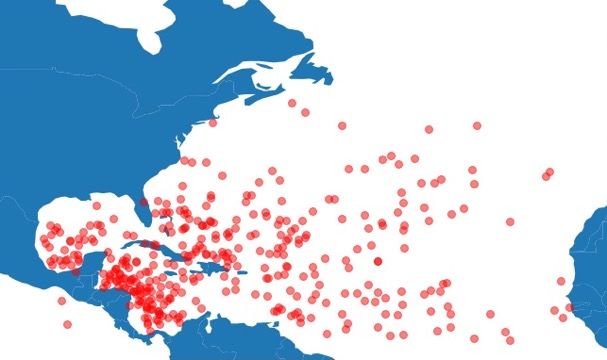
TYPICAL TROPICAL CYCLONE FORMATION, JUNE – AUGUST
       JUNE                    JULY                AUGUST
     1851–2019              1851–2019             1851–2019

GENESIS POINTS = 125   GENESIS POINTS = 173   GENESIS POINTS = 451

                                                                     10
TYPICAL TROPICAL CYCLONE FORMATION, SEPTEMBER – NOVEMBER
SEPTEMBER OCTOBER NOVEMBER
1851–2019 1851–2019 1851–2019
GENESIS POINTS = 630 GENESIS POINTS = 359 GENESIS POINTS = 89
11TOTAL U.S. HURRICANE LANDFALLS (1900 – 2010)
14ELEMENTS OF THE 2021 ATLANTIC HURRICANE OUTLOOK
KEY PREDICTORS
• El Niño / La Niña (ENSO)
• Atlantic Multi-decadal Oscillation (AMO)
15ENSO – A PERIODIC CYCLICAL WARMING AND COOLING
OF THE EQUATORIAL PACIFIC OCEAN
KEY EL NINO/LA NINA BACKGROUND
Typical circulation patterns
during El Niño/La Niña
(Source: WMO, El Niño/Southern Oscillation)
16LATEST ENSO
MODEL FORECASTS
Most models forecast
Neutral ENSO for the
2021 Hurricane Season.
Some get close to La Niña
conditions. Overall large
spread and range of
possibilities.
17TYPICAL IMPACT OF LA NINA – LOWER WIND SHEAR IN THE
ATLANTIC SUPPORTS DEVELOPMENT OF STORMS
18ACCUMULATED CYCLONE ENERGY INDEX (ACE)
• ACE measures total
overall seasonal activity.
• Factors in both intensity and
duration of named storms.
• Mean ACE from
1950-2020 is 104.
• 2005 and 2017 most recent
years with >200 ACE.
• 2013, 2014 and 2015
most recent years with
less than 100 ACE.
19HISTORIC ATLANTIC ACTIVITY DURING DIFFERENT ENSO CONDITIONS
When considering just
ENSO, La Niña events favor
higher ACE (more active
seasons) than El Niño.
Note that “Neutral” does
not mean “not important.”
It is a spectrum from Niña
to Niño.
20ATLANTIC MULTIDECADAL OSCILLATION (AMO)
• AMO cycles typically last 20-30 years.
• Since 1995, AMO has been mainly
positive (warm SST).
• 2021 AMO VALUES:
• Jan. = 0.14,
• Feb. = 0.15
• Mar. = 0.12
21COMBINING HISTORICAL AMO AND ENSO CONDITIONS
• Both AMO and ENSO modulate
Atlantic tropical activity.
• When ENSO phase is combined
with AMO phase, a clear pattern
emerges.
• Stronger La Niñas and positive
AMOs favor more active
hurricane seasons.
• Stronger El Niños and negative
AMOs favor more inactive
hurricane seasons.
22EARTH NETWORKS 2021 FORECAST METHODOLOGY
IN-HOUSE STATISTICAL MODELS ANALOGS
• Neural Network model is used to forecast 2021 ACE. • Analogs are chosen by the forecast team.
• Model based on 41 years of data spanning • Each member chooses 5 or more years where
1980 to 2020. similar expected atmospheric and oceanic
conditions from June to November occurred.
• Utilizes several global atmospheric and oceanic
predictors (e.g. ENSO, AMO, others).
• Compute the average of ACE, number of named
• Poisson regression equations to forecast number storms, hurricanes and major hurricanes.
of named storms, hurricanes, major hurricanes.
KEY FINAL STEP: Consider statistical model forecasts with analog averages and make final adjusted prediction as needed.
23LATEST OCEAN WATER TEMPERATURE ANOMALIES
GULF OF MEXICO/CARIBBEAN
Most areas near or above average
ATLANTIC
Near or above average most areas.
Well above average off SE US coast.
CENTRAL/ EASTERN PACIFIC
Slightly below average reflecting
weakening La Niña
24FORECAST SUMMER OCEAN WATER TEMPERATURE ANOMALIES
C3S multi-system seasonal
forecast Mean forecast SST
anomaly
ECMWF/Met Office/Meteo-
France/CMCC/DWD/NCEP
July-August-September 2021
25WEST AFRICAN RAINFALL
Above average rainfall predicted
across Sahel region of Africa July
through September.
This likely reflects consistent and
numerous African Easterly
Waves.
African Easterly Waves can
develop into tropical storms and
hurricanes once they travel into
the open Atlantic Ocean.
26ANALOG YEARS – YEARS WITH SIMILAR PREDICTOR PATTERNS TO 2021
Year ACE Named Storms Hurricanes Major Hurricanes
1989 135.1 11 7 2
1996 166.2 13 9 6
2001 110.1 15 9 4
2006 83.3 10 5 2
2008 145.7 16 8 5
2011 126.3 19 7 4
2012 132.6 19 10 2
2013 36.1 14 2 0
2018 129.0 15 8 2
Mean of
118.3 14.7 7.2 3.0
Analog Years
Normal Tropical
104 12 6 3
Season (1950-2020)
Analog years point to
Years where Cool Neutral ENSO
A Positive AMO ABOVE NORMAL tropical activity
through the Summer and Fall
for the upcoming season.
27COMBINING ANALOGS WITH STATISTICAL MODEL FORECAST
STATISTICAL MODEL MEAN OF MODEL AND
CATEGORY MEAN OF ANALOGS
FORECASTS ANALOGS
ACE 133 118 125.5
Named Storms 16 15 15.5
Hurricanes 8 7 7.5
Major Hurricanes 3 3 3.0
28EARTH NETWORKS – 2021 ATLANTIC HURRICANE OUTLOOK:
Above Normal: Normal: Below Normal:
55% chance 30% chance 15% chance
CATEGORY NORMAL (1950-2020) FINAL FORECAST
ACE 74 to 126 133 (+/- 58)
Named Storms 10-14 16 (+/- 4)
Hurricanes 5-7 8 (+/- 3)
Major Hurricanes 2-3 3 (+/- 1)
292021 PROBABILITY OF
EXCEEDANCE FOR ACE
• In order to better convey uncertainty in the
forecast, Probability of Exceedance charts
have been included to enable users to more
accurately assess risk.
• The black line is the probability of a given ACE
number being achieved based on 1950-2020
climatology.
• The orange dashed line displays the
probability of ACE exceeding a given value
based on a forecast of 133.
302021 PROBABILITY OF
EXCEEDANCE FOR HURRICANES
• In order to better convey uncertainty in the
forecast, Probability of Exceedance charts
have been included to enable users to more
accurately assess risk.
• The black bar is the probability of a given
hurricane count being achieved based on
1950-2020 climatology.
• The orange bar shows the probability of a
hurricane count being exceeded a given
forecast value of 8.
31TECHNICAL DEFINITIONS AND TERMINOLOGY EXPLANATIONS
KEY DEFINITIONS FORECAST PROBABILITY
• Accumulated Cyclone Energy (ACE): Sum of the Squares of 6-hourly • Final forecast probability is
Maximum Sustained Wind Speeds (in units of knots) for all Systems determined by the likelihood ACE
while they are at least Tropical Storm intensity. will fall into a given tercile.
• Named Tropical Storm: 1 Minute Sustained Winds > 33 kt (39 mph). • Tercile groupings correspond to
• Hurricane: 1 Minute Sustained Wind > 63 kt (74 mph). 1/3 (33.3%) of observed seasonal
• Major Hurricane: 1 Minute Sustained Wind > 95 kt (110 mph). values in 1950 to 2020 climatology.
• Above normal seasonal ACE is
therefore the highest 1/3 of
recorded values, or >126.
COMMENTARY ON OUR NEURAL NETWORK MODEL • Normal seasonal ACE values are
• Our statistical prediction forecast is based a neural network the middle 1/3 which are between
incorporating several predictors in the Atlantic ocean basin 74 and 126.
that have shown skill in seasonal ACE forecasting. • Below normal seasonal ACE values
• Model is designed to run in April. areAPRIL CROSS-VALIDATED
HINDCAST ACE
(1980-2020)
33MODEL PARAMETER LOCATIONS
34RANKED IMPORTANCE OF FORECAST VARIABLES
3536
THANK YOU
QUESTIONS AND COMMENTS?
You can also read