Review of the 2019 influenza season in Australia and what to expect in 2020
←
→
Page content transcription
If your browser does not render page correctly, please read the page content below
Review of the 2019 influenza season in
 Australia and what to expect in 2020

                         Ian Barr
                 Deputy Director
     WHO Collaborating Centre for Reference and
              Research on Influenza

              www.influenzacentre.org

                  The Melbourne WHO Collaborating
                 Centre for Reference and Research on
                Influenza is supported by the Australian
                  Government Department of Health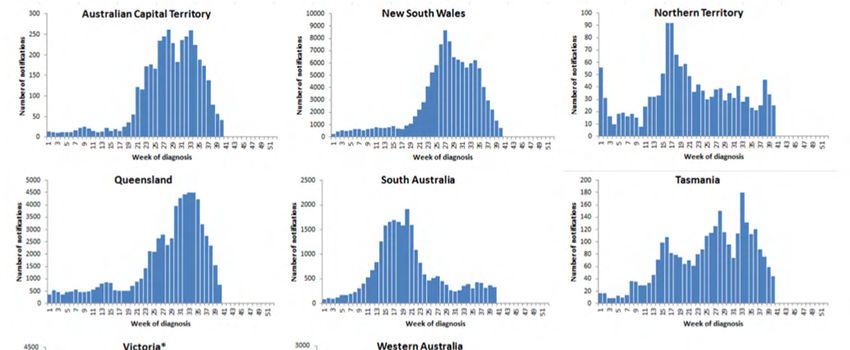
A reality check?

https://www.washingtonpost.com/health/time-for-a-reality-check-america-the-flu-is-
  a-much-bigger-threat-than-coronavirus-for-now/2020/01/31/46a15166-4444-11ea-
                          b5fc-eefa848cde99_story.html
How was the 2019 SH influenza season for you?

• Normal season – nothing much different from any other

• Low season – similar to 2010, 2018

• Medium season – similar to 2011, 2013

• Big season – similar to 2012, 2014, 2015, 2016

• Massive season – Once in every decade or two
                   - Pandemic of 2009
                   - Flumageddon 2017
                   - Flunami of ………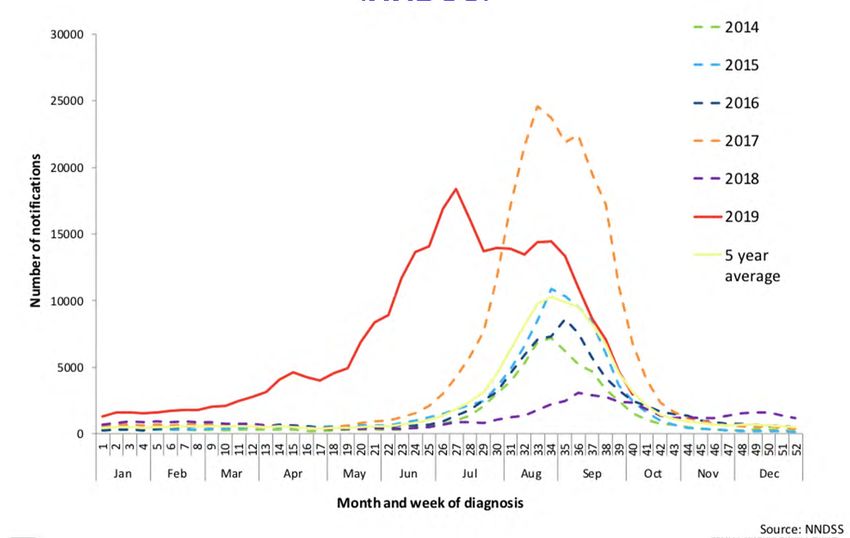
Summary of the 2019 Australian Influenza season
• A big “Influenza” season by most measures
   – NNDSS Lab confirmed influenza data
      – Highest “interseasonal” influenza activity (Jan-Mar) on record (again)
      – Highest ever number of lab confirmed cases recorded;
         (2019: 312,978, 2018: 58,736, 2017: 251,150)
      – High activity in Autumn-early winter (Apr-Jun) approx. x10 usual,
         Early Peak (Wk 27 w/b 1/7 norm mid Aug), very long season (30wk vs 12-16w avg.)
   – ASPREN-GP ILI data – Extended activity March-October, broad peak
   – Very high press coverage around extent and severity of season

• Characteristics of season
   – Australia had mainly A(H3N2), followed by A(H1N1)pdm, some B’s
   – FluCan data
       – High number of hospital admissions 3915 (April 1-Oct 6) (725 2018, 3969 2017)
       – 6.3% admitted directly to ICU (8.1% 2018, 8.9% 2017; 7% 2015, 11% 2014)
       – Most hospitalizations due to A(H3N2), then B, small number of A(H1N1)pdm
   – Influenza deaths (NNDSS); 902 deaths (2018 148) med. 86y (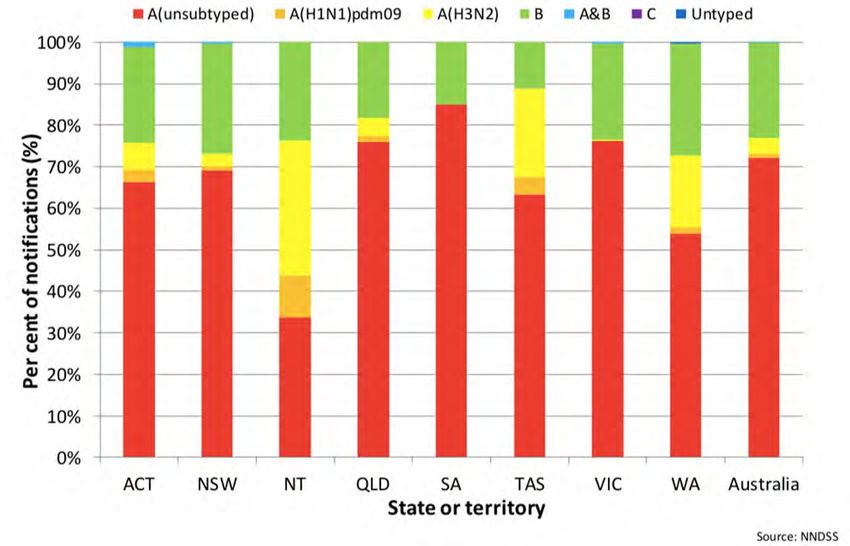
10 April 2019 20 May 2019
6 May 2019
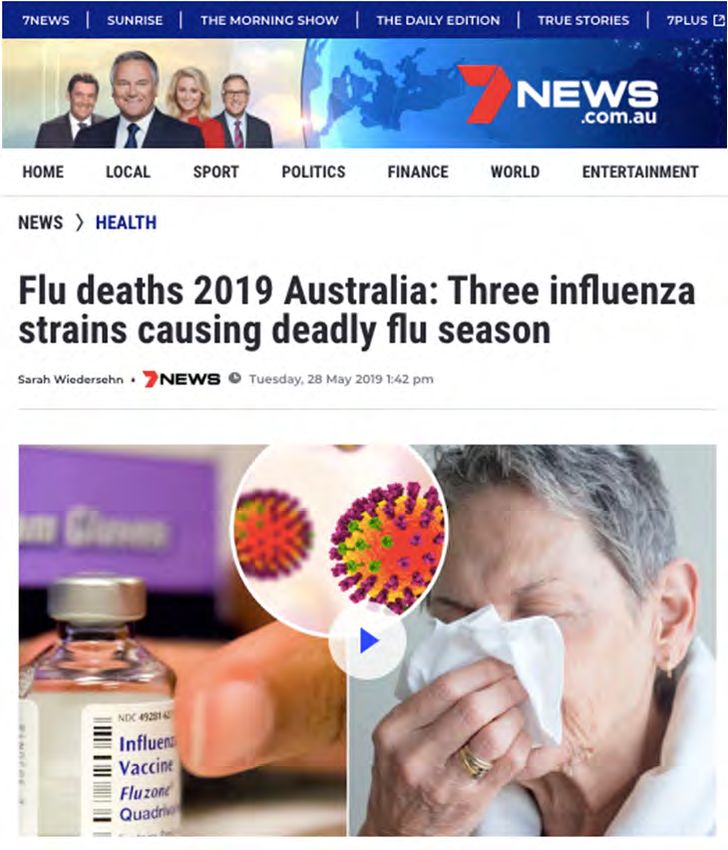
22 May 2019
June 18 2019
Aug 8 2019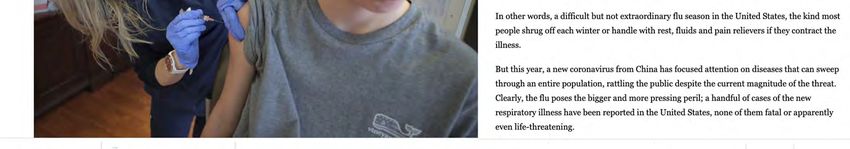
9 September 2019

                   From MJA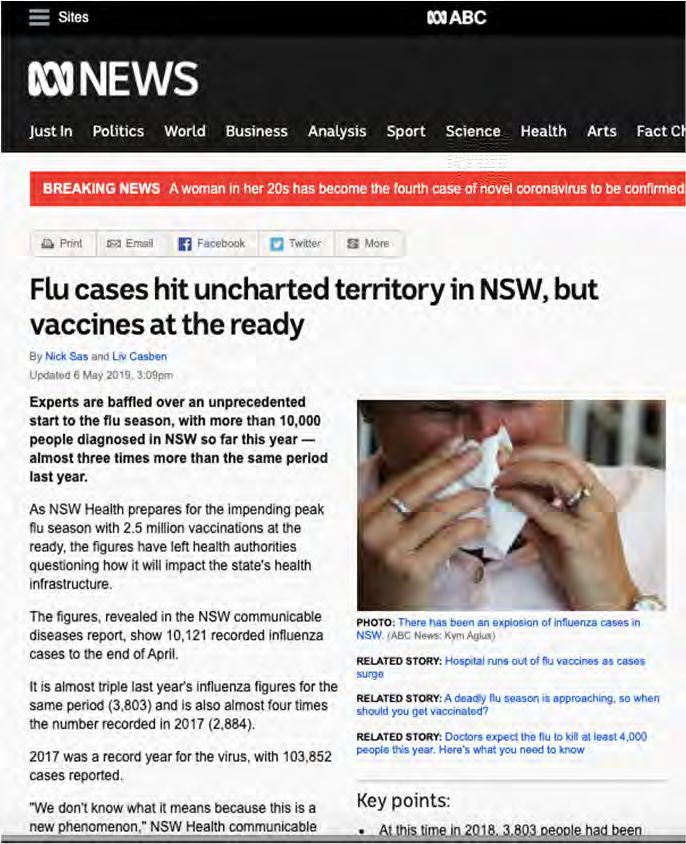
14 Jan 2020
https://www.brisbanetimes.com.au/national/queensland/queensland-s-record-flu-season-
killed-five-a-week-in-2019-20200114-p53rgv.html
Influenza-like illness (ILI) 2013-19 in Australia
                 SENTINEL GP ILI SURVEILLANCE

  Season: If ILI threshold @ 3/1000
   season lasted approx. 30 wks
        vs average 20 wks

 US threshold 2019-20 uses >2.4%
   influenza positive ILI cases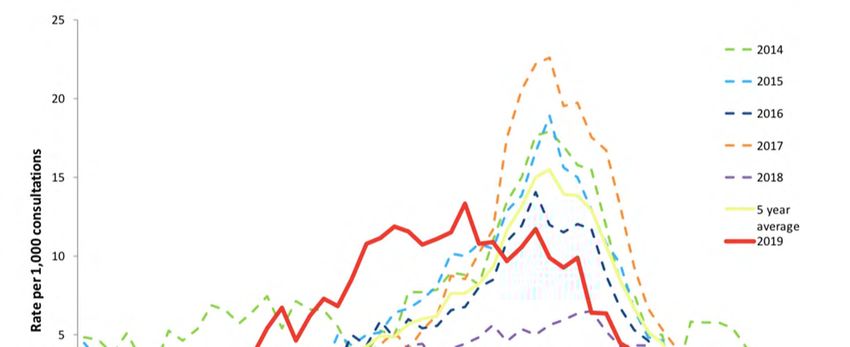
Lab confirmed influenza in Australia 2013-19
                 (NNDSS)
   Year     Nov    Dec   Jan
   2017-18 3368 2031 3746
   2018-19 5546 6257 6829
   2019-20 3733 4245 4742

   Season: If LCI threshold
  set at 2500 cases/wk then
  season lasted approx. 31
   wks vs average 12 wks
Lab confirmed influenza in Australia 2019 by State
     – Early start; Extended season, multiple peaks
NNDSS Laboratory confirmed influenza cases by state 2019
State # Rate/
100K
ACT 4072 967
NSW 116368 1456
NT 1736 701
QLD 68075 1358
SA 27060 1558
Tas 3137 593
Vic 69285 1072
WA 23245 895
Aust 312978 1252NNDSS Laboratory confirmed influenza cases by age 2019
Sample types received at WHO CC Melbourne

     Type/subtype proportions
      from Australian samples
    received at WHO CC in 2019
Molecular diversity of Australian influenza viruses in 2019
(Based on Haemagglutinin gene sequencing by WHO CC Melb)
A/H3 A/H1
n=970 n=374
B/Vic B/Yam
n=217 n=33FluCAN hospitalisation data 2019 (1 April-6 October)
Reported influenza outbreaks in NSW institutions
NSW 2014-2019

 Excess deaths in NSW

                                    2019
NNDSS reported influenza associated deaths in Australia
1 January to 31 December
5 year
2014 2015 2016 2017 2018 2019*
average
Notifications*†
67,670 100,556 90,858 251,151 58,858 113,819 307,907
Deaths§
189 222 273 1181 148 403 902
Case Fatality
Rate 0.28% 0.22% 0.30% 0.47% 0.25% 0.35% 0.29%
•Data on ‘Deaths’ should always be used with extreme caution as clinical information is not always collected across the various jurisdictions and timely mortality data is not available.These
notification data are based on data extracted from the NNDSS on the date indicated above. Due to the dynamic nature of the NNDSS, data on this extract are subject to retrospective revision
and may vary from data reported in published NNDSS reports and reports of notification data by states and territories. In general notification data represent only a proportion of the total cases
occurring in the community, that is, only those cases for which health care was sought, a test conducted and a diagnosis made, followed by a notification to health authorities. The degree of
under-representation of all cases is unknown and is most likely variable by disease and jurisdiction. In interpreting these data it is important to note that changes in notifications over time may
not solely reflect changes in disease prevalence or incidence. Depending on the disease changes in testing policies; screening programs including the preferential testing of high risk
populations; the use of less invasive and more sensitive diagnostic tests; and periodic awareness campaigns, may influence the number of notifications that occur annually.
*Up to 1.12.19
Data kindly supplied by OHP, DoHVaccine effectiveness for Australia 2019
GIVE report (interim estimates)
September 2019Vaccine effectiveness for Australia 2019
GIVE report (interim estimates)
September 2019Vaccine effectiveness for Australia 2019
GIVE report (interim estimates)
September 2019Vaccine effectiveness for Australia 2019
GIVE report (interim estimates)
September 2019Vaccine effectiveness for Australia 2019
GIVE report (interim estimates)
September 2019Influenza vaccines for Australia and NZ in 2020
• H1N1pdm – A/Brisbane/02/2018-like
• H3 – A/South Australia/34/2019-like
Trivalent vaccine:
• B – B/Washington/02/2019-like (B/Vic)
Quadrivalent vaccine:
• B – B/Phuket/3073/2013-like (B/Yam)
• B – B/Washington/02/2019-like (B/Vic)
*Changes to 2019 recommendationsCommentary by: Robert L Atmar,
Wendy A Keitel Baylor College of
Medicine, Houston, Texas, USA
The Journal of Infectious
Diseases,
https://doi.org/10.1093/infdis/jiz54
5An early start of the 2020 Australian Influenza
season?
19 December 2019The NH 2019-20 influenza season
(so far)US influenza activity at high levels
CDC data on influenza in USA
USA influenza related deaths

                                      “So far, 10,000 people have died and
                                           180,000 people have been
                                      hospitalized during the 2019-2020 flu
                                        season, according to preliminary
                                            estimates from the CDC”

As at 24 Jan 2020: 173.3M doses of
   influenza vaccine distributed
 (sufficient for 53% of population)
US “real time” tracking of
influenza using smart
thermometers - Kinsa
https://www.kinsahealth.co/products/health-map/Walgreens Flu Index – based on sales of antiviral
medications at their stores in the USA
https://walgreens.maps.arcgis.com/apps/MapSeries/index.html?app
id=40d0763cd3cc42428b26f85202108469&rel=0WHO Flunet global influenza map (at 17 Jan 2020)
Summary of influenza seasons
•   2019 a very high influenza season in Australia
•   2019 an lower activity season in NZ (below seasonal baseline level)
•   Influenza A(H3N2) predominated in Aus + NZ
•   B-Victoria lineage most common B virus in Australia (10:1 Vic:Yam) & NZ
•   Record number of vaccines distributed in Australia – 12.5M doses (50% pop)
•   Vaccine match – good for H1N1pdm and B’s, A(H3N2) - moderate
•   Very few oseltamivir/zanamivir resistant viruses detected; No baloxavir marboxil resistance
•   Hospital admissions & deaths in Australia both high
•   Vaccine Effectiveness: Australia good; Overall A/B VE=48%; H3 lower VE=39%
•   H3N2 + H1N1pdm + B/Vic components of Australian/NZ 2020 vaccine updated from 2019
•   Influenza activity 2019-20 in Nth Hemisphere; high in USA and low in EU, low in Japan
•   A(H1N1)pdm09 increasing in USA after B-Vic early, ? Second wave, Japan mostly H1pdm,
    China mix H3/B/Vic, EU mix of H3/H1/B-Vic

•   Prediction for 2018; A quiet year with B’s and H1N1pdm’s predominating!!     ✓
•   Prediction for 2019: A moderate year with mixed viruses and more H3N2!!              ✗
    ✓
•   Prediction for 2020: A quiet year with H1pdm viruses predominating!!
Acknowledgments
• Various influenza reports
– Australian influenza surveillance report
– NSW Influenza report
– ESR Influenza weekly update
– CDC Fluview
– ECDC Influenza report
– WHO reports
• NICs and labs that have sent us samples
• Staff at Melbourne WHO CC
• Sheena Sullivan for VE data
• Other WHO CC’s
• Surveillance Division of OHP, Commonwealth DoH
• WPRO and WHO HQ GenevaYou can also read