Country presentation - Fiji - PRDR Sustainable Energy for All
←
→
Page content transcription
If your browser does not render page correctly, please read the page content below
Country presentation - Fiji
Fiji Department of Energy

                        Vision
    To provide a sustainable Energy sector

                            Mission
To provide an enabling environment for a sustainable energy sector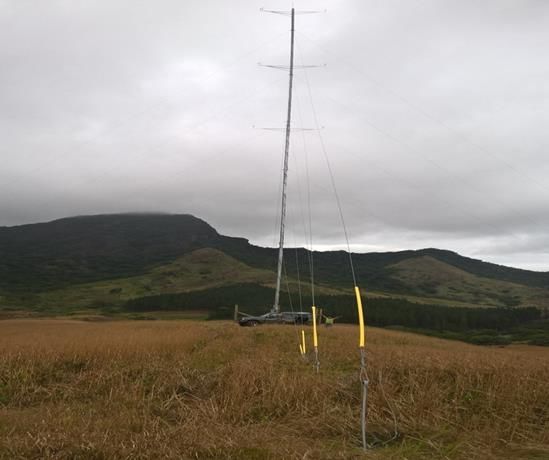
GENERAL INFORMATION
Independence: 10 October 1970
Republic: 7 October 1987
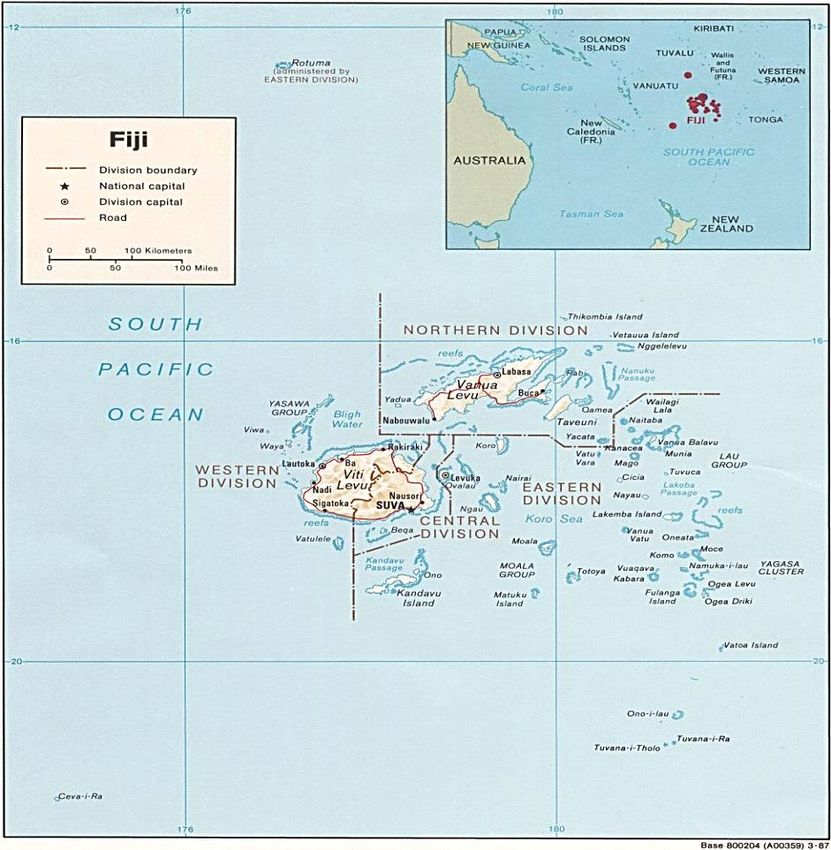
Population: 884,887
Area: 18,333sq.km
Language: English, Fijian, Hindi
Religion: Christianity, Hindu,
Muslim
Political System: Unitary Parliamentary
Republic
Fiji’s Energy Sector
Fiji Department of Energy vision is for a sustainable energy sector in Fiji
while its mission is to provide an enabling environment to achieve the vision.
Electricity Fiji Limited (EFL) – The EFL is a wholly Government of Fiji
owned statutory body that was established under the Electricity Act of 1966.
EFL is responsible for the Generation, Transmission and Retail of electricity
on the larger islands, Viti Levu, Vanua Levu and Ovalau, which account for
some 90% of the country’s population. Installed generation capacity is
approximately 237MW, comprising 80MW Monasavu Hydro Scheme and
40MW Nadarivatu Hydro Scheme in Viti Levu and about 112MW of diesel
capacity in 14 stations on the three main islands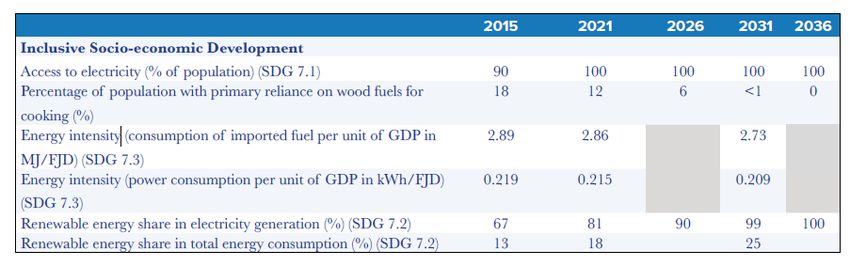
Overall National Energy Situation
1. Fiji’s energy situation is characterised primarily by a high
   reliance on imported fuels.
2. Energy demand is driven by household consumption of
   electricity and transport fuels and by the need of its major
   industries, in particular agriculture, forestry, tourism, and mining.
3. Grid-based power supply has arguably the most immediate
   potential to make Fiji’s energy sector more efficient, cost
   effective, equitable, and environmentally sustainable.
4. Transport sector is the main user of imported fuel in Fiji..
5. The issue of having the right data needs a concerted effort from
   everyone.
6. Despite the fact that Fiji has a relatively low energy-intensity
   economy, improving Fiji’s energy efficiency – in the transport
   sector and also in the power sector and amongst households,
   businesses and industry – is likely a cost-effective way to reduce
   the cost and increase the availability of energy in Fiji.
National Energy Situation

National Targets:

• Fiji has an electricity access of 96% and targets to provide 100% access by 2021

• Fiji’s current electricity mix is 55% renewable energy. Fiji targets 100 %
  Renewable energy share in electricity generation by 2036

• Under the Nationally Determined Contributions (NDCs) Fiji is also pursuing an
  economy-wide indicative reduction of 10% carbon dioxide emissions from
  energy efficiency improvements. Collectively, these measures will reduce the
  Fijian energy sector’s total carbon dioxide emissions by around 30% by 2030

5-YEAR & 20- YEAR NATIONAL
     DEVELOPMENT TARGETS

     • 100% Electricity Access to
2021 all Fijians
     • Increase renewable target
       to 100% in the overall
2036 electricity Supply mix
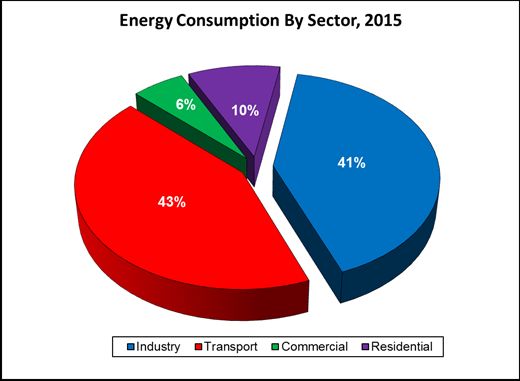
5-Year & 20-Year National Development Plan – Energy
                       Sector Targets
Energy Consumption by sector in 2015. Source: UN Statistics Division, Total Final Consumption per industry.)
EFL Electricity Generation 2013 - 2018
                               EFL Electricity Generation for Fiji
                1050

                1000
Million Units

                 950

                 900   1032.94
                                    1007
                 850                         934.04
                                                             904.3   891.78
                 800                                                          872.2

                 750
                        2018        2017      2016           2015    2014     2013
                                                      YEAR
% EFL Electricity Generation 2013 - 2018
70
% Electricity Generation Mix for Fiji
60
50
Generation Mix %
40 Hydro
Industrial and Heavy
fuel Diesel
Wind
30
IPP
20
10
0
2018 2017 2016 YEAR 2015 2014 2013Data Collection
• Data is sourced from various stakeholders that include:
Fiji Revenue Custom Services – Trade Data
Fiji Bureau of Statistics – Census data, electricity access data, appliance ownership
etc.
Energy Fiji Limited - Electricity generation, demand, etc
Climate Change Unit – Carbon emission dataWind Speed Data • 15 Wind Monitoring Stations installed in
Viti Levu
• The assessment of these sites will lead to
nationwide mapping of renewable
resource potentials of wind and solar.
• There have been surface investigations
done on known sites but not for the whole
of Fiji. As such there is a need to
implement nation-wide mapping of other
renewable resource potential in
accordance with global renewable
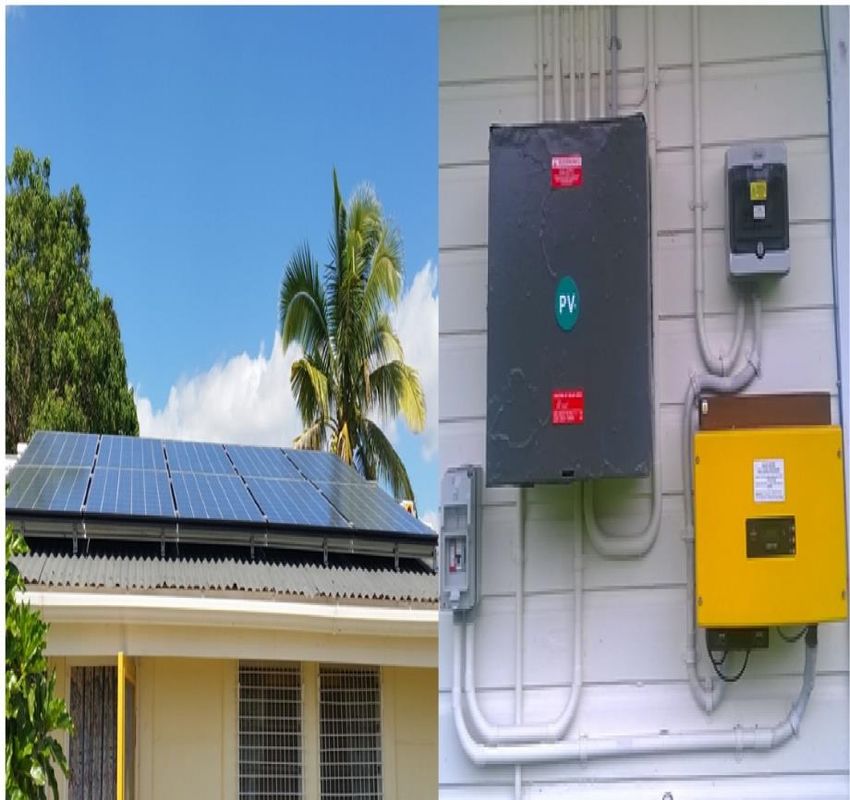
resource mapping protocols The pilot GCPV project is a collaborative research
Solar PV Data
project under DOE’s renewable energy development
program together with EFL. The underlying
objectives of the project are:
• Formulation of framework for implementation
of grid connected PV projects
• Assessment of performance of grid connected
PV in Fiji
The demonstration project consists of a total of
110kW of PV systems in clusters of 1.2 kW to 2.4
kW installed in 60 government residential quarters
around Fiji for the purpose for assessment to
determine on-grid PV feasibility in FijiEnergy Benchmark Study
• The agreed objectives for the energy benchmarking study
were to:
Obtain energy and business information from a representative
sample of sites within each of the three sectors.
Evaluate and compare energy performance between or within
each sector or sector sub-group
• Three (3) sectors were surveyed:
Hotel sector;
Commercial building sector;
Manufacturing sector.Energy Benchmark Study – Survey Format
The energy survey was issued via email.
The email contained two format options for completing the
surveys, to help reduce any potential barriers that people may
have in completing the survey One format was online using
SurveyMonkey and one format was a PDF attachment in the
email issued to the sites.
For consistency, the same questions were asked in both the
online and PDF surveys
To incentivise businesses to complete the survey, respondents
were provided with the opportunity to enter a draw to win a fully
funded half-day base level energy audit at their site.Response Rate
Sector Surveys Sent Received Rate
Responses Response
Hotels 33 19 58%
Commercial 144 66 46%
Manufacturing 387 85 22%
Total 564 170 30%
There were several common issues that were raised by the people who were contacted:
• They had compiled some of the information but were not able to answer all of the
questions.
• The survey had been passed onto someone else.
• The information was confidential
• They were too busyProject challenges and mitigation
Challenges Mitigation
Relying on self- Developed clear and concise survey questions to prevent misunderstandings. A Help
reporting Guide was also provided with the survey, which provided guidance on how to find
some of the information.
Timeliness of Closing dates for the survey were clearly communicated in the initial email to the
response rate sites. Two reminder emails were issued prior to and on the day of the closing date.
This was a successful method, as the number of responses increased after each
reminder email was sent.
Low response We regularly with those sites which had not responded to the survey. Extensions
rate were provided to sites in order to allow as many responses as possible to be
received.
Missing data We followed up directly with the site contacts to obtain missing data. This was
moderately successful, although some sites refused to provide production data due
to confidentiality concerns.
Incorrect data Similar sites where compared to each other during the benchmarking process, which
did highlight several outliers in each data set. These outliers are likely to be due to
incorrect data being provided in the survey and the benchmarking reports highlight
this. Data believed to be incorrect was excluded from some of the analysis.THE END
You can also read