The World Has Cooled Off - What's the Significance?
←
→
Page content transcription
If your browser does not render page correctly, please read the page content below
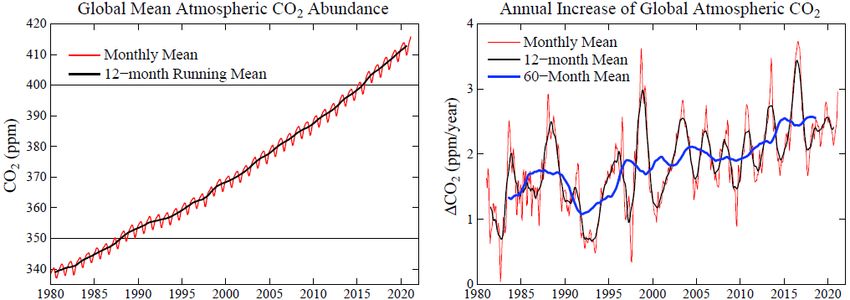
Fig. 1. Left: monthly global temperature anomalies. Right: Nino 3.4 temperature anomaly
for past six years and NCEP forecast (green line).

              The World Has Cooled Off – What’s the Significance?
                                                                                    13 May 2021
                                James Hansen and Makiko Sato
Global temperature in April continues to be much less than a year ago (Fig. 1: left side). ENSO
(El Nino Southern Oscillation) is the principal cause of year-to-year global temperature change.
We are in a moderately strong La Nina (Fig. 1: right side) and NCEP (NOAA’s National Center
for Environmental Prediction) current forecast (Fig. 1: right side) suggests that tropical
temperatures are headed for a double-dip La Nina. Nino forecasts are notoriously difficult,
however, so we need to wait a few months to see.
Global temperature is highly correlated (61.4%) with the Nino3.4 index, with global temperature
lagging Nino3.4 by 5 months (Fig. 2). The 12-month running mean temperature is dropping fast
(Fig. 3) and probably will not reach a minimum until November this year.1 That minimum is
likely to be well below the 1970-2015 trend line (Fig. 3) and 2021 will be much cooler than
2020. Will that global cooling imply that the apparent global warming acceleration of the past
six years was a misleading deviation, rather than a significant change of the warming rate?

 Fig. 2. Global surface temperature and Nino3.4 multiplied by 0.1 to make scales similar.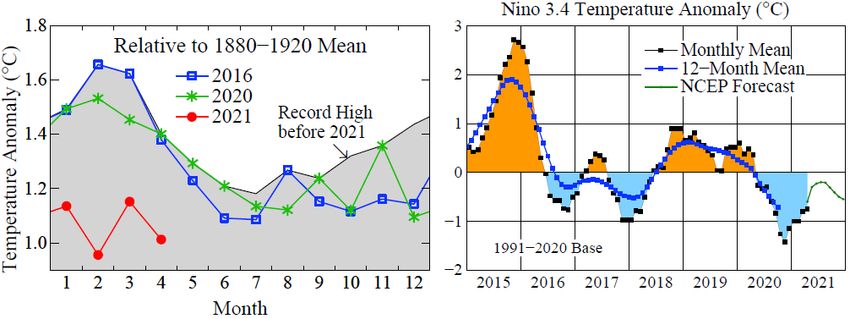
Fig. 3. Global surface temperature relative to 1880-1920 average.

No, almost surely not. Global temperature will ultimately respond to global climate forcings.
We know that Earth is now out of energy balance – more energy coming in than going out – at a
record imbalance2 close to +1 W/m2. Moreover, greenhouse gases (GHGs) continue to increase
rapidly and there is growing evidence that human-made aerosols are decreasing. Aerosols have a
cooling effect, so they partially offset GHG warming, but that offset is now decreasing, as we
will discuss in a future paper and temperature update.
Let’s look at the primary drive for global warming: increasing GHGs. As we will see – despite
international concern about climate change and promises by governments to address the matter –
GHG growth rates are increasing, not declining.
The methane (CH4) growth rate3 is shocking (Fig. 4). A CH4 increase causes tropospheric ozone
(O3) and stratospheric water vapor (H2O) to also increase. Including these indirect effects, the
climate forcing by observed CH4 growth is half as large as the climate forcing by CO2.

             Fig. 4. Left: Global CH4 amount. Right: Annual CH4 growth rate.
      Data source: Ed Dlugokencky, NOAA/GML (https://gml.noaa.gov/ccgg/trends_ch4/)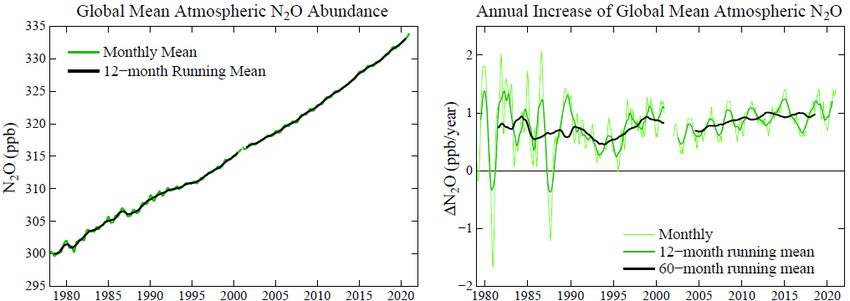
Fig. 5. Left: Global CO2 amount. Right: Annual CO2 growth rate.
   Data source: NOAA Global Monitoring Lab (https://gml.noaa.gov/ccgg/trends/global.html)

Any realistic plan to limit global warming must include a reduction of atmospheric CH4, as
discussed in Young People’s Burden.4 Such a CH4 reduction is feasible because of the short
(about 10 year) lifetime of CH4, but it requires reducing CH4 sources. Instead, after CH4 nearly
stabilized early this century, growth has returned and recently accelerated to its highest rate in
the period of accurate global data, with increased growth at least in part as a result of “fracking”
for gas and reliance on gas as the complement to intermittent renewable energies.
The CO2 growth rate (Fig. 5) is now a bit below the peaks that occur in conjunction with strong
El Ninos. However, the CO2 growth rate is not declining. CO2 growth has not even slowed as a
result of the reduced economic activity associated with Covid-19.
The growth rate of the third strongest greenhouse gas, N2O, does not provide any good news. Its
growth rate (Fig. 6) continues to increase.

             Fig. 6. Left: Global N2O amount. Right: Annual N2O growth rate.
          Data source: Ed Dlugokencky, NOAA/GML (gml.noaa.gov/ccgg/trends_n2o/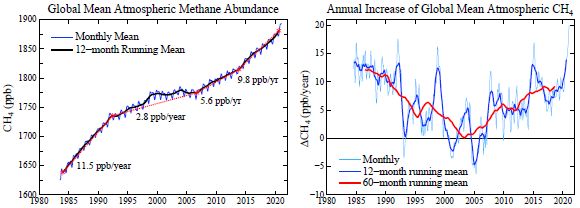
There is a wide gap between reality and the picture that governments paint about the status of
actions to limit global warming. Actual government policies consist of little more than tinkering
with domestic energy sources, plus goals and wishful thinking in international discussions.
Solution of the global warming problem has two fundamental requirements.
The first, underlying, requirement is for a simple rising carbon fee. The fee could be made near
global via border duties on products from countries without the fee. The public would accept a
rising carbon fee if all of the resulting funds was distributed uniformly to domestic citizens.5
The second requirement is for technology to produce baseload dispatchable carbon-free electric
power at a price below that of fossil fuels. Based on the price of nuclear fuel and the amount of
material (concrete, steel, etc.) in a power plant, one technology with that potential is modern
nuclear power. However, governments chose not to support the development of that technology.
Instead, they chose an unlimited hidden subsidy of renewable energies via renewable portfolio
standards for electricity as well as explicit subsidies of renewables. If uniform support had been
provided for all clean energies, for example via clean energy portfolio standards, we would now
be well on the way to stabilizing climate, and we would have a cleaner, healthier atmosphere.6
Our children and grandchildren will pay the price for our energy policy incompetence.

1
 As we advance one month, the change to the 12-month running mean is obtained by adding the most recent point
on the red curve and deleting the same month from the green curve. So as long as the red curve remains below the
green one, the 12-month mean will keep declining. Record global temperatures in September and November 2020
are unlikely to be exceeded this year.
2
 von Schuckmann, K., et al.: Heat stored in the Earth system: where does the energy go?, Earth System Science
Data 12, 2013-2041, 2020.
3
 Dlugokencky, E. J., L. P. Steele, P. M. Lang, and K. A. Masarie (1994), The growth rate and distribution of
atmospheric methane, J. Geophys. Res., 99, 17,021– 17,043, doi:10.1029/94JD01245.
4
  Hansen, J., M. Sato, P. Kharecha, K. von Schuckmann, D.J. Beerling, J. Cao, S. Marcott, V. Masson-Delmotte,
M.J. Prather, E.J. Rohling, J. Shakun, P. Smith, A. Lacis, G. Russell, and R. Ruedy, 2017: Young people's burden:
requirement of negative CO2 emissions. Earth Syst. Dynam. 8, 577-616, 2017.
5
    Hansen, J.: Student Leadership on Climate Solutions, 31 July 2020.
6
    Hansen, J.: Sophie's Planet #36: Chapter 47 (China and the Global Solution), 4 March 2021.
You can also read