Climate change in alpine areas in central Austria between 1961 and 2006 - PARCS.at
←
→
Page content transcription
If your browser does not render page correctly, please read the page content below
4th Symposium o fth e Hohe Tauern National Park
 Conference Volume                for Research in Protected Areas                        pages 305-310
 ___________________________ September 17th to 19th, 2009, Castle of Kaprun__________________________

   Climate change in alpine areas in central Austria between 1961
                              and 2006

       Wolfgang Taucher1, Andreas Kellerer-Pirklbauer1, Gerhard Karl Lieb1,
                                Michael Avian2

           1 Institute of Geography and Regional Science, University of Graz, Graz, Austria,
 2 Institute of Remote Sensing and Photogrammetry, Graz University of Technology, Graz, Austria,

Summary
Monthly values of four different climatic elements (mean temperature, precipitation sum, sum of
freshly fallen snow and maximum snow depth) from 44 meteorological stations were analysed for
quantifying climatic trends over a 46 year period (1961-2006) at six high-altitude areas in the
mountains of central Austria, partly located in the Hohe Tauern National Park. The trends of the
four climatic elements were investigated by applying different statistical approaches. Our results
indicate a significant temperature rise of mean annual temperatures of 1.3 to 1.4°C since 1961 in
all six areas at the reference altitude of 2500 m a.s.l. The highest increase in temperature occurred
during the summer season (JJA) with ~1.9°C. The trends of mean annual precipitation, sum of
freshly fallen snow and maximum snow depth are not significant at all six sites. However, the
annual precipitation sum seems to have decreased in two o fth e six areas (-75mm) whereas in one
area it increased substantially (+160mm). The annual sum of freshly fallen snow decreased in five
areas. The maximum snow depth decreased in all six areas. Our results clearly demonstrate that
climatic conditions changed significantly within the last decades in central Austria.

Keywords
Temperature, Precipitation, Snow, Climatic trends, Hohe Tauern National Park.

Objectives and Study areas
The changing climate system affects high altitude regions by strong impacts on glaciers and
permafrost (Haeberli & Burn 2002). Scientific research in Austria dealing with this topic is carried
out in various projects and several studies have already been published (e.g. Formayer et. al.
2001). This study quantifies trends of four climatic parameters (mean temperature, precipitation
sum, sum of freshly fallen snow and maximum snow depth) over a 46 year period (1961-2006) at
six high-altitude areas in the mountains of central Austria (Fig. 1). These six areas (5 in the Hohe
Tauern Range, 1 in the Niedere Tauern Range) are investigated by a project focussing on the
effects of climate change on high mountain environments named "ALPCHANGE - Climate Change
and Impacts in Southern Austrian Alpine Regions" (www.alpchange.at).

                                                                 Figure 1: Location o fth e six selected
                                                                 ALPCHANGE study sites:
                                                                 A=Pasterze Glacier
                                                                 B=Schareck - Fallbichl
                                                                 C=Central Schober Mountains
                                                                 D=Dösen Valley
                                                                 E=Hintereggen Valley
                                                                 F=Hochreichart

                                                                                                           305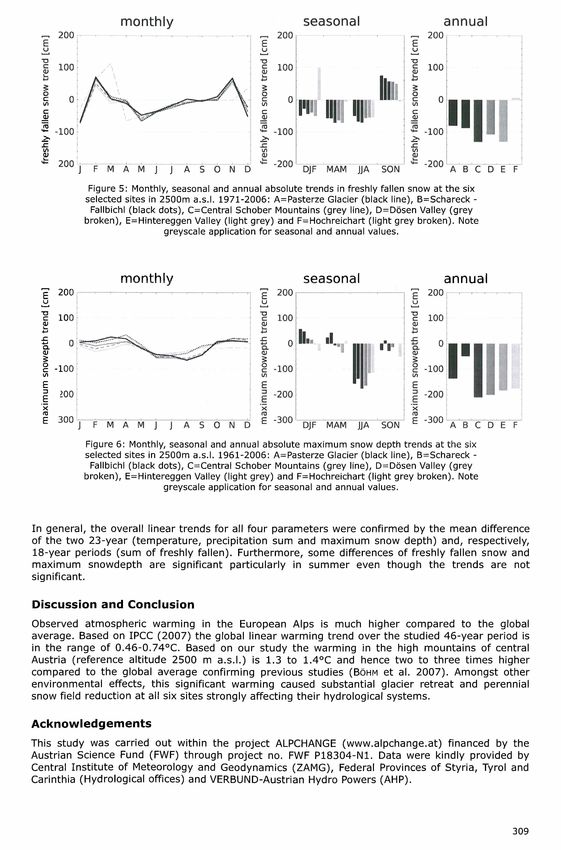
Method and data base
The essential input for climate impact analysis is represented by the local data base which
consisted in the framework of this study of monthly values from 44 observational meteorological
stations (Table 1) nearby the six study sites depicted in Figure 1. Trends of the four climatic
elements were investigated by applying different statistical approaches. Correlation analysis was
used for filling data gaps, linear regression to calculate the conditions at reference altitude 2500 m
a.s.l. and the overall linear trend. Mean differences of the two 23-year periods for mean
temperature, precipitation sum and maximum snow depth (1961-83 vs. 1984-2006) as well as the
two 18-year periods for the sum of freshly fallen snow and (1971-1988 vs. 1989-2006) were
calculated. The statistical significance was tested with signal-to-noise ratios (Table 2) which are
defined as the absolute trends divided by the Standard deviations as well as Student's t-tests
(95% confidence limit).

Table 1: List of observational meteorological stations with altitude (m a.s.l.) used for the calculations of climatic
elements at the six selected sites 1961-2006: A=Pasterze Glacier, B=Schareck - Fallbichl, C=Central Schober
Mountains, D=Dösen Valley, E=Hintereggen Valley and F= Hochreichart.

                                   altitude
       name                                   temperature     precipitation    fresh snow       snowdepth
                                 (m a.s.l.)
       Sonnblick                      3105    A,B,C,D,E,F      A,B,C,D,E       A,B,C,D,E,F           A
       TG4                            3076                       A,B,C
       PF3                            2930                                                           F
       PF4                            2893                                                          C,D
       PF2                            2850                                                           A
       PF1                            2800                                                         B,D,E
       Rudolfshütte                   2304       A,B,C             A                A               A,B
       Reisseckhütte                  2256        D,E              E              d ,e ,f          D,E,F
       Margaritze                     2070       A,B,C
       Mooserboden                    2036         A              A,B              A,B             a ,b ,f
       Hochalm                        2010                         D
       Kölnbrein                      1973         D               D
       Palik                          1950                       A,B,C
       Goldeck                        1885         E               E                E                 E
       Zettersfeld                    1820         C               C                C                c
       Edelrautehütte                 1725         F
       Gößkessel                      1673                        D,E
       Felbertauern                   1650                         A                A                A
       Wastlbaueralm                  1634                         D
       Planneralm                     1605         F                                F                F
       Schmelz                        1560         F                                                 F
       Wöllatal                       1550                         D                D               D,E
       Hochreichart                   1500                         F
       Obermillstätter Alpe           1450                                          E                E
       Heiligenblut                   1380                       A,B,C             A,B              A,B
       Kais                           1347                         C                C                C
       Hohentauern                    1265                         F                F                F
       Teuchl                         1260                         E               D,E              D,E
       Iselsberg-Penzelsberg          1208                         C                C                C
       Mallnitz                       1196                         D                D                D
       Innerfragant                   1195                         D                D                D
       Döllach                        1071                         C               B,C               B
       Matrei in Osttirol             1050                                          C                C
       St.Johann am Tauern            1050                         F                F                F
       Oberzeiring                      930                        F                F                F
       Wald am Schoberpass              890                        F                F                F
       Seckau                           855                        F                                 F
       Ingering                         850                        F                F                F
       Malta                            830                        E                E                F
       Stall                            820                        D               C,D               D
       St.Johann im Walde               750                                         C                C
       Kleindorf                        742                                         D                D
       Mautern                          735                         F               F                F
       Kraubath an der Mur              605        -                F               F                F

306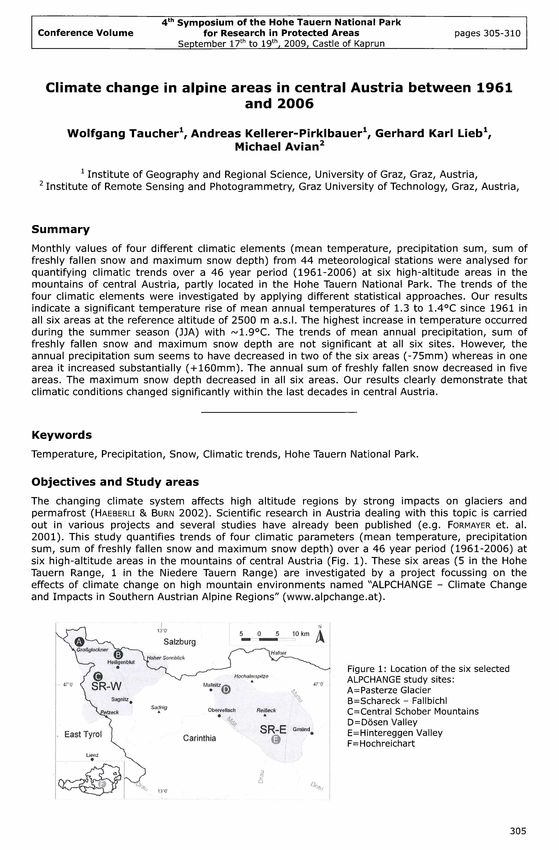
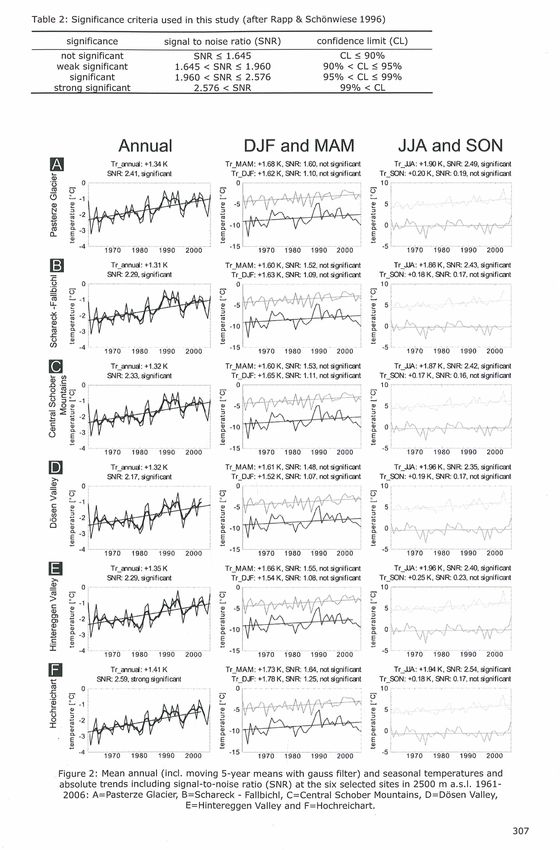
Table 2: Significance criteria used in this study (after Rapp & Schönwiese 1996)

           significance                          Signal to noise ratio (SNR)                                      confidence limit (CL)
       not significant                                     SNR < 1.645                                                  CL < 90%
      weak significant                                 1.645 < SNR < 1.960                                           90% < CL < 95%
         significant                                   1.960 < SNR < 2.576                                           95% < CL < 99%
     stronq significant                                    2.576 < SNR                                                  99% < CL

                           Annual                                        DJF and MAM                                                                            JJA and SON
                       Tr_annual: +1.34 K                       T r _ M A M : + 1.68 K . S N R : 1.60, not sig n ifican t                                   T r_ JJA : + 1 .9 0 K , S N R : 2.49, sig n ifica n t
                      S N R : 2.41, sig n ifican t                 T r_ D JF : +1.62 K , S N R : 1.10, not sig n ifica n t                           T r_ S O N ; +0.20 K , S N R : 0.19, n ot sig n ifica n t
     a>
    *Co
      O                                                              0 r~ — ----- -------------- ----- -------- --------- ---- >..........I
           O
    ü      L-
           0)
     ü     ZJ
    B      ro
    to
     CtJ   S
           a.
    0l     e
           2
                                                                                 1970          1980           1990          2000
                       T ra n n u a l: +1.31 K                  T r _ M A M : + 1.60 K , S N R : 1.52. not sign ifican t                                    T r J J A : +1.86 K , S N R : 2.43, s ig n ific a it
                      S N R : 2.29, sig n ifican t                 T r_ D JF : + 1.63 K , S N R : 1.09, not s ig n ific a it                         T r_ S O N : +0.18 K , S N R : 0.17. not sig n ifica n t

                     1970        1980         1990       2000
                       Tr_annual: +1.32 K                       T r J v lA M : +1.60 K . S N R : 1.53, not sig n ifican t                                   Tr_JU A : +1.87 K , S N R : 2.42, sig n ifican t
                      S N R : 2.33, s ig n ific a it               T r_ D JF : + 1.65 K . S N R : 1.11, not s ig n ific a it                         T r_ S O N : +0 17 K , S N R 0.16, not sign ifican t

                     1970        1980         1990       2000                    1970          1980           1990           2000                                     1970        1980    1990        2000
                        Tr_annuel: +1.32 K                      T r _ M A M : +1.61 K , S N R : 1.48. not s ig n ific a it                                  T r J J A : +1.96 K , S N R : 2.35, s ig n ific a it
                      S N R : 2.17, sig n ifica n t                T r_ D JF : + 1.52 K , S N R : 1.07, not sig n ifican t                           T r_ S O N : +0.19 K , S N R : 0.17, not sig n ifican t

                        Tr_annual: +1.35 K                      T r _ M A M : + 1.66 K , S N R : 1.55. not sig n ifican t                                  T r_ JJA : +1.96 K , S N R : 2.40, sig n ifican t
                      S N R : 2.29. sig n ifican t                 T r_ D JF : + 1.54 K , S N R : 1.08. not s ig n ific a it                         Tr_ S O N : +0.25 K , S N R : 0.23, not sig n ifican t
                                                                     n ..........                                                                    10r...... ... .... ......... ..........
                                                                                                                                                                                       ^  j\ j
                                                                                                                                                       5

                     1970        1980         1990      2000                     1970          1980           1990          2000
                        Tr_annual: +1.41 K                       T r _ M A M : +1.73 K , S N R : 1.64, not s ig n ifica n t                            T r J U A : +1.94 K , S N R : 2.54, sig n ifica n t
                  S N R : 2.59, strong sig n ifican t               T r_ D JF : +1.78 K , S N R : 1.25, not sig n ifica n t                     T r_ S O N : +0.18 K , S N R : 0.17, not sig n ifica n t
                                                                                                                                              _ 10           - - f - . . . . .. . . . . . . . . - - . - . j
                                                                                                                                              o
                                                                                                                                              2> 5

                                                                                                                                              !Q .     ^
                                                                                                                                                           L ... /v
                                                                                                                                                                 ..............
                                                                                                                                                                                     a-A                       h
                                                                                                                                               e
                                                                                                                                               0)          i               \Ar
                                                                                                                                                                             *      v           * vv ‘ i
                                                                                197019801990                                 2000                     "5 . . . . 1 9 7 0          1980   1990         2000

      Figure 2: Mean annual (incl. moving 5-year means with gauss filter) and seasonal temperatures and
      absolute trends including signal-to-noise ratio (SNR) at the six selected sites in 2500 m a.s.l. 1961-
       2006: A=Pasterze Glacier, B=Schareck - Fallbichl, C=Central Schober Mountains, D=Dösen Valley,
                                   E=Hintereggen Valley and F=Hochreichart.

                                                                                                                                                                                                                    307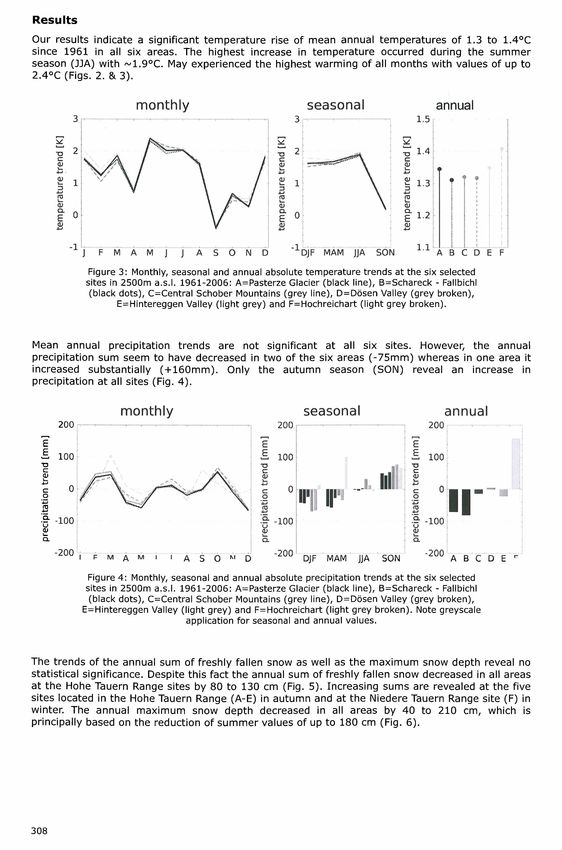
Results
Our results indicate a significant temperature rise of mean annual temperatures of 1.3 to 1.4°C
since 1961 in all six areas. The highest increase in temperature occurred during the summer
season (JJA) with ~1.9°C. May experienced the highest warming of all months with values of up to
2.4°C (Figs. 2. & 3).

                          m o n th ly                          seasonal                    annual
        3       ----T
                    -T
                     -----x
                          -----,-----r—                    3

                                                           2

                                                           1

                                                           0

                                                          -1

             Figure 3: Monthly, seasonal and annual absolute temperature trends at the six selected
            sites in 2500m a.s.l. 1961-2006: A=Pasterze Glacier (black line), B=Schareck - Fallbichl
             (black dots), C=Central Schober Mountains (grey line), D=Dösen Valley (grey broken),
                    E=Hintereggen Valley (light grey) and F=Hochreichart (light grey broken).

Mean annual precipitation trends are not significant at all six sites. However, the annual
precipitation sum seem to have decreased in two of the six areas (-75mm) whereas in one area it
increased substantially ( + 160mm). Only the autumn season (SON) reveal an increase in
precipitation at all sites (Fig. 4).

                     m o n th ly                               seasonal                      annual

             Figure 4: Monthly, seasonal and annual absolute precipitation trends at the six selected
             sites in 2500m a.s.l. 1961-2006: A=Pasterze Glacier (black line), B=Schareck - Fallbichl
              (black dots), C=Central Schober Mountains (grey line), D=Dösen Valley (grey broken),
            E=Hintereggen Valley (light grey) and F=Hochreichart (light grey broken). Note greyscale
                                    application for seasonal and annual values.

The trends of the annual sum of freshly fallen snow as well as the maximum snow depth reveal no
statistical significance. Despite this fact the annual sum of freshly fallen snow decreased in all areas
at the Hohe Tauern Range sites by 80 to 130 cm (Fig. 5). Increasing sums are revealed at the five
sites located in the Hohe Tauern Range (A-E) in autumn and at the Niedere Tauern Range site (F) in
winter. The annual maximum snow depth decreased in all areas by 40 to 210 cm, which is
principally based on the reduction of summer values of up to 180 cm (Fig. 6).

308
m o nth ly seasonal annual
200 200
1 100 I 100
$
O im
S o
l'lil III IIP j
OJ
7ö
>N
-C
l/l
-100
\
4-
sz
i/i
-100
00
x
ra
E 300
j F M A M J J A S O N D DJF MA M JJA SON A B C D E F
Figure 6: Monthly, seasonal and annual absolute maximum snow depth trends at the six
selected sites in 2500m a.s.l. 1961-2006: A=Pasterze Glacier (black line), B=Schareck -
Fallbichl (black dots), C=Central Schober Mountains (grey line), D=Dösen Valley (grey
broken), E=Hintereggen Valley (light grey) and F=Hochreichart (light grey broken). Note
greyscale application for seasonal and annual values.
In general, the overall linear trends for all four parameters were confirmed by the mean difference
of the two 23-year (temperature, precipitation sum and maximum snow depth) and, respectively,
18-year periods (sum of freshly fallen). Furthermore, some differences of freshly fallen snow and
maximum snowdepth are significant particularly in summer even though the trends are not
significant.
Discussion and Conclusion
Observed atmospheric warming in the European Alps is much higher compared to the global
average. Based on IPCC (2007) the global linear warming trend over the studied 46-year period is
in the ränge of 0.46-0.74°C. Based on our study the warming in the high mountains of central
Austria (reference altitude 2500 m a.s.l.) is 1.3 to 1.4°C and hence two to three times higher
compared to the global average confirming previous studies (B öhm et al. 2007). Amongst other
environmental effects, this significant warming caused substantial glacier retreat and perennial
snow field reduction at all six sites strongly affecting their hydrological systems.
Acknowledgements
This study was carried out within the project ALPCHANGE (www.alpchange.at) financed by the
Austrian Science Fund (FWF) through project no. FWF P18304-N1. Data were kindly provided by
Central Institute of Meteorology and Geodynamics (ZAMG), Federal Provinces of Styria, Tyrol and
Carinthia (Hydrological Offices) and VERBUND-Austrian Hydro Powers (AHP).
309References
Böhm R., J urkovic A. & A uer I. (2007): Regionale Klimazukunft Bericht zu Zielvereinbarung
2008/32. Zentralanstalt für Meteorologie und Geodynamik. Vienna, 18 p.
Formayer H., Eitzinger J., Nefzger H., S imic S., K romp-Kolb H. (2001): Auswirkung einer
Klimaveränderung in Österreich: Was aus bisherigen Untersuchungen ableitbar ist. Institut für
Meteorologie und Physik, Universität für Bodenkultur, Wien, 60 S.
Haeberli W. & Burn C. (2002): Natural Hazards in Forests: Glacier and Permafrost effects as related
to Climate Change, IUFRP Research Series 9, CABI Publishing, Wallingford/New York, 167-202
Intergovernmental Panel on Climate Change (IPCC) (2007): Climate Change; The Physical Science
Basis - Summary for Policymakers, Cambridge University Press, Cambridge, 21p.
Rapp J. & Schönwiese C.D. (1996): Atlas der Niederschlags- und Temperaturtrends in Deutschland
1891-1990. Frankfurter Geowissenschaftliche Arbeiten, Serie B, Meteorologie und Geophysik, Band
5, Frankfurt am Main, 253 p.
Contact
Wolfgang Taucher Michael Avian
taucher@edu.uni-araz.at
Institute of Remote Sensing and
Andreas Kellerer-Pirklbauer Photogrammetry,
Graz University of Technology
Gerhard Karl Lieb
Steyrergasse 30
Institute of Geography and Regional Science 8010 Graz
University of Graz Austria
Heinrichstraße 36
8010 Graz
Austria
310You can also read