Seasonal And Annual Climate Profile of Adama District, East Shewa, Oromia, Ethiopia - ssrg-journals
←
→
Page content transcription
If your browser does not render page correctly, please read the page content below
SSRG International Journal of Geoinformatics and Geological Science (SSRG-IJGGS) – Volume 7 Issue 2 – May – Aug 2020

Seasonal And Annual Climate Profile of Adama
    District, East Shewa, Oromia, Ethiopia
                   Abdisa Hirko1, Gezahegn Mergia1, Tilahun Dandesa2, Asalifewu Niguise1
1
 National Meteorology Agency of Ethiopia: Eastern and Central Oromia Meteorological Services Centre: Forecast
                               and Early Warning Case Team, Oromia, Ethiopia
                         2
                           Agricultural Transformation Agency, Addis Ababa, Ethiopia

Abstract

This study scrutinizes climate profile and appraises its        is 13.10c & 10.40c respectively. The maximum
social and economic values in reducing climate-related          temperature trend has been increasing but the minimum
impacts on Agricultural product over Adama district.            temperature has been decreasing which shows the
The study used CHIRPS data, daily, decadal, monthly,            climate changes over district. Averagely season starts
seasonal and annual station data used from NMA.                 during May while the season starts at minimum period
Statistical methods applied to generate recent climate          of April. The season ends averagely at the end of
characteristics and climate events of district and              September and the minimum ends at October.
secondary data from published and unpublished                   Averagely the LGP of district is more than 4 months
sources, and systematically analyzes the data both              and minimum and maximum is 3 and 4 months
using qualitative and quantitative analysis. The result         respectively. Overall, the results of Belg and Annual
showed that the trend of gradual, extreme events and            rainfall trend have been decreasing while Bega and
meteorological       drought     increased   agriculture        Kiremt seasonal rainfall amount has been increasing.
vulnerability in the study area. According to the 38            The driest year over district was happened during El-
years (1981-2019) CHRIPS Rainfall estimates from                Nino year 1987, 2002 & 2015 in contrast the wettest
rain gauge and satellite observations/CHIRPS Blended            year of district during La-Nina Year 1999, 2000 &
with station data/ and the 31 years meteorological              1998. The coldest year and the warmest were during
gauged station data (NMA). The highest Annual and               2014 and 2017 correspondingly. Kiremt and Belg
seasonal average Maximum Temperature recorded                   season rainfall variability increases in the recent
over district is 29.7 0c & 31.00c during 2011 and lowest        decade.

Keywords: CHRIPS; Rainfall; Temperature; Season;
CV; SPI.

                    I. Introduction
Adama district is districts in the Oromia region of             average rate of 0.28°c per decade [3]. Rainfall varies
Ethiopia. Parts of East Shoa provinces located in the           over Ethiopian Great Rift Valley [4]. Ethiopian
Great Rift Valley, it is bordered on the south by               agriculture is mostly characterized by extreme
the Arsi Zone, on the southwest by Koka                         dependence on rained system [5]. The area has three
Reservoir which separates it from Dugda Bora, on the            seasons with two rainy seasons locally known as Kiremt
west by Lume, on the north by the Amhara Region, and            {(Ganna) (June-September)} the main rainy period and
on the east by Boset [Figure1] [1]. It is found in Awash        {Belg (Arfaasaa) (February-May)} which is the small
River basin. Highland is 85%, low land 10% mid-land             rainy period. Bega (October-January) when dry and
5%, Soil types of district are: Andsoil 74.3% and,              cold period dominate the district [6] . The 38 years
cambisoil and luvisols 25.7%. Notable local landmarks           (1981-2019) CHRIPS rainfall estimates from rain gauge
include the Sodere and Gergedi hot springs, and Boku            and satellite observations/CHIRP blended with station
Femoral [1]. Identifying climate profile is important to        data/ and the 31 years meteorological gauged station
socio-economic activity of the area. The impacts of             data [7]. Mean annual rainfall of gauged station ranges
severe climatic events on livelihoods were frequent and         from 678.1-973.5mm [Figure3], and average annual
cyclic. The 1994 heavy and unseasonal rain has also             maximum & minimum temperature is 29.70c and
damaged crops [2]. The UNDP Climate Change profile              13.10c, respectively [Graph3 and 4].
for Ethiopia shows that the mean annual temperature
has increased by 1.3°c between 1960 and 2006, at an

ISSN: 2393 - 9206                             www.internationaljournalssrg.org                                   Page 55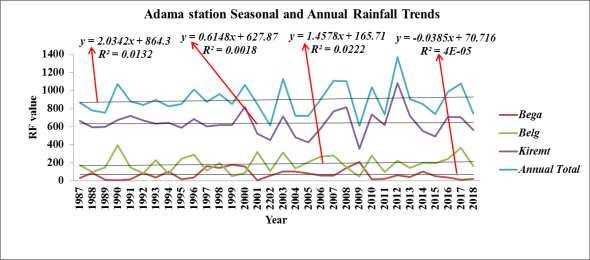
SSRG International Journal of Geoinformatics and Geological Science (SSRG-IJGGS) – Volume 7 Issue 2 – May – Aug 2020
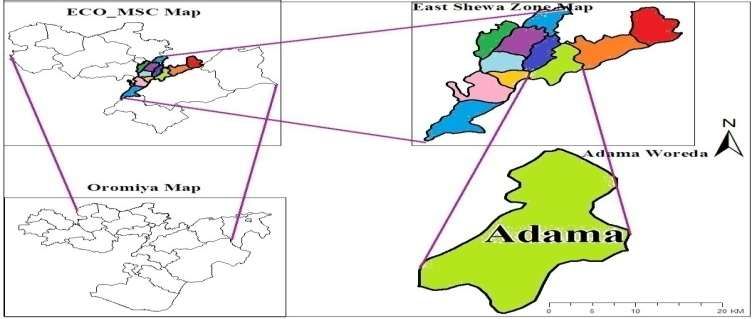
II. Description of Study Areas towns and found in the Awash River basin .The
Adama district extends between 8.14°-8.44° N and altitude of district is range from 1500-2300m asl.
39.04°-39.25° E longitude. It is located in the East Shoa [Map1]. Natural resources include forest (known
Zone with the border of Lume, Dodota, Boset, Amahara natural resources of district) with different topography
Rgion, and Bora. The study area covers 37 kebeles & 4 and elevation with River and tributaries
Figure 1. Adama District Location
III. Data and Methodology standardization of rainfall totals, and calculated for
season and annual. According to, the standardized
GIS Arc maps, GeoCLIM software, Kutools for excel anomalies (Z) of inter-annual and seasonal variability in
and Instat used for data manipulation and analysis to rainfall as
generate output. CHIRPS data, daily, decadal, monthly, where, x is an annual average, x is long-term mean and
seasonal and annual station data used from NMA (ECO SD is standard deviation. Annual rainfall variability has
MSC). Statistical methods applied to generate recent been calculated using the coefficient of variation (CV),
climate characteristics and climate events of district. which expressed as
A. Data Analysis and Results Where, CV, is coefficient of variation, SD, is standard
deviation and x is the long-term rainfall mean. The
The trend of rainfall and temperature were examined degree of rainfall variability which is CV is classified
using standardized precipitation index (SPI). It provides as less variable (CV 30%).
The analysis with inputs of Rainfall data was done days, LGP, Onset and Cessations of District, to
using GIS to interpolate rainfall spatial distribution of calculate Rainfall coefficient of variation, Range,
district, GeoCLIM to identify average, anomaly, Minimum, Maximum, mean and standard deviation,
coefficient of variation, percentage and meteorological Excel for Monthly, Seasonal and Annual mean & Total
drought, Instat to identify probability of Dry and Wet rainfall and Temperature trends.
ISSN: 2393 - 9206 www.internationaljournalssrg.org Page 56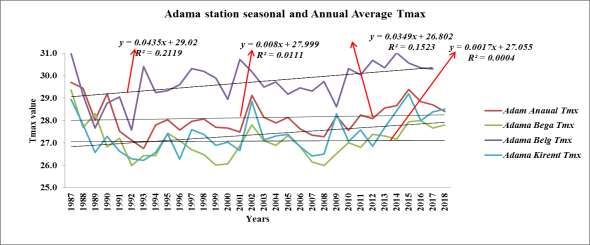
SSRG International Journal of Geoinformatics and Geological Science (SSRG-IJGGS) – Volume 7 Issue 2 – May – Aug 2020

                                             IV. Discussion and Results

A. Spatial distributions of Seasonal Rainfall average over Adama District

Figure 2. Kiremt, Belg and Bega Seasonal Average Rainfall for nine years from 1981-1990, 1991-2000, 2001-2010
                                         and 2011-2019 map analysis.

From the GeoCLIM tool of CHIRPS data analysis                 whereas Bega season increases. In 2011-2019 Decade
output results the average seasonal rainfall indicates        Belg and Bega season shows that more decreasing
that Kiremt and Belg seasons decrease from1991-2000           rainfall values (Figure2). During the seasons was more

ISSN: 2393 - 9206                           www.internationaljournalssrg.org                                   Page 58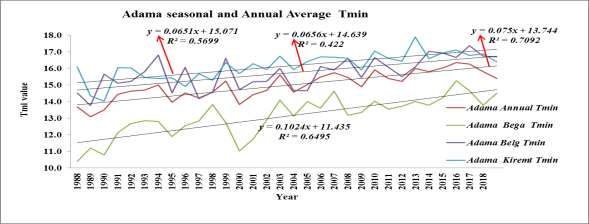
SSRG International Journal of Geoinformatics and Geological Science (SSRG-IJGGS) – Volume 7 Issue 2 – May – Aug 2020

decadal rainfall decreasing in Belg season (from 1981-        2010 better than from 2011-2019).
1990 better than from 1991-2000) and also (from 2001-

                        Figure3. Adama District annual rainfall distribution from 1987-2018

                             Figure 4. Adama District Annual Rainfall from 1987-2018.

From the station data rainfall anomaly shown during the       2002 & 2009 was almost moderately dry but during the
year of 2002 (-0.3 value) & 2009 (-0.3 value) the driest      year of 2012 was moderately wet (Graph1 and
but during the year of 2012 (0.5 value) the wettest and       Figure4), respectively.
SPI shown from Chirps data analysis during the year of

ISSN: 2393 - 9206                           www.internationaljournalssrg.org                                   Page 2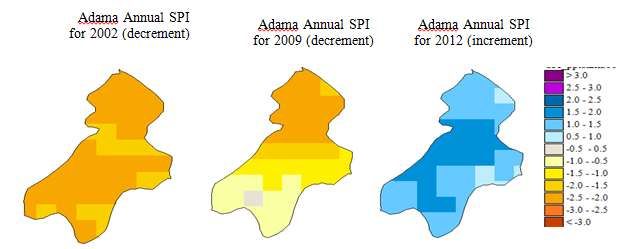
SSRG International Journal of Geoinformatics and Geological Science (SSRG-IJGGS) – Volume 7 Issue 2 – May – Aug 2020

                           Graph1. Rainfall Anomaly analysis and trend at Adama station

                  Graph2. Belg, Bega, Kiremt and Annual total Rainfall trends of Adama station

            Graph3. Belg, Bega, Kiremt and Annual Maximum average Temperature of Adama station

ISSN: 2393 - 9206                           www.internationaljournalssrg.org                                   Page 60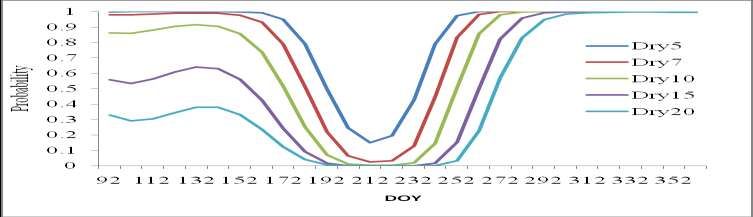
SSRG International Journal of Geoinformatics and Geological Science (SSRG-IJGGS) – Volume 7 Issue 2 – May – Aug 2020

             Graph4. Belg, Bega, Kiremt and Annual Minimum average Temperature of Adama station

Table1. Adama district Seasonal and Annual Rainfall summary statistics
Rainfall                       Belg                    Bega                  Kiremt              Annual
Maximum                        394.4                   208.2                 1084.1              1370.7
Minimum                        47.4                    7.7                   353.4               609.0
Range                          347.5                   200.5                 730.7               761.7
Mean                           189.76                  70.1                  638                 897.9
Standard Deviation             91.8                    55.9                  135.3               165.9
Coefficient of variation       48.4%                   79.8%                 21.2%               18.5%

Table2. Adama district Rainfall and Temperature Extreme Events
Parameters                                           Seasons                   Values                 Years
Extreme Heavy fall                                   Belg                      104.8mm                2001
Extreme Maximum Temperature                          Belg                      36.1oc                 2016
Extreme Minimum Temperature                          Bega                      3.0 oc                 2000

                               Graph5: Probability of dry spell days over Adama station

ISSN: 2393 - 9206                            www.internationaljournalssrg.org                                   Page 61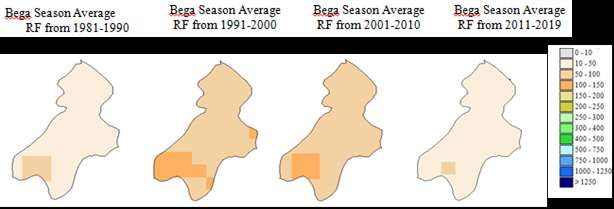
SSRG International Journal of Geoinformatics and Geological Science (SSRG-IJGGS) – Volume 7 Issue 2 – May – Aug 2020

                                          Graph6.SOS,EOS and GP of adama station

    300

    250

    200

    150

    100
                                    SOS

                                                               EOS

                                                                                          LGP
Adama district has a Bi-modal rainfall pattern with            and seasonal average Maximum Temperature recorded
mean annual rainfall 897.9mm and 18.5% coefficient of          over district is 29.7 0c & 31.0 0c during 2011 and lowest
variation respectively, which is Medium year to year           is 13.10c & 10.40c.respectively (Graph 3 and 4).
rainfall variability. The rainy season over the district on
average extends from June to September. Average                The annual standard deviation of district is 165.9mm.
annual maximum & minimum temperature are from                  This indicates that the normal Annual rainfall for this
29.7 0c and 13.1 0c respectively. The highest Annual           district ranges from 678.1mm to 973.5mm annual
                                                               rainfall       below               678.1mm           is

considered as below normal rainfall while above                rainfall amount has been decreasing. The temperature
973.5mm       is   considered    as   above    normal          trend has been increasing the value which shows the
rainfall(Figure3). The wettest year were 2012 over             climate change over district (Graph1).
Adama in contrast to this driest years were 2002 and
2009(Graph1). Averagely the season starts during May           4.2. Extreme event and meteorological drought over
while the season starts at minimum period of April. The        Adama district
season ends averagely at the end of September and the
minimum ends at October. Averagely the LGP of                  Definitionsof extreme event: Records are distinguished
district is more than 4 months and minimum and                 as daily (largest/smallest for that day on the calendar),
maximum is 3 and 4 months respectively (Graph5 and             monthly (largest/smallest value during that month), or
6)                                                             all-time (largest/smallest value ever observed at that
                                                               station). Summary information for recent periods (year-
Belg and Kiremt is a rainy season, while bega is the dry       to-date, month-to-date, last 30 days) is provided in
and cold period. Kiremt rainfall amount had 80.1%;             tabular format. Extreme events such as heat waves,
Belg had 20.1% and Bega had 7.8% from the annual               droughts, tornadoes, and hurricanes, highest and lowest
rainfall received over district. In 2012 annual rainfall       temperature, heavy fall.
amount of 1370.7mm were recorded which is the
highest annual total rainfall over district while the          Definitions of meteorological drought: This type of
lowest of district were 614.4mm and 609mm in 2002              drought all about the weather and occurs when there is
and 2009 respectively (Graph1).                                a prolonged period of below average precipitation,
                                                               which creates a natural shortage of available
In general, Kiremt seasonal, Belg seasonal and Annual          water. Meteorological drought is defined in terms of the
Rainfall trend has been increasing while Bega seasonal         magnitude of a precipitation shortfall and the duration
                                                               of this shortfall event.

ISSN: 2393 - 9206                              www.internationaljournalssrg.org                                 Page 62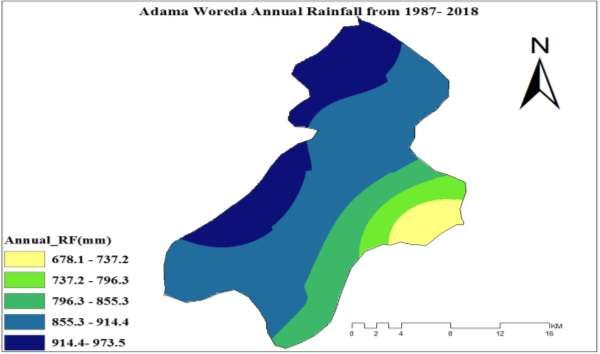
SSRG International Journal of Geoinformatics and Geological Science (SSRG-IJGGS) – Volume 7 Issue 2 – May – Aug 2020

The following figures shown kiremt season SPI for El Nino, La Nina and Neutral years.

Figure 5. Kiremt standard precipitation index (SPI) for El Nino years 1987, 1997, 2002 and 2015 CHRIPS data map
                                                      analysis.

  Figure 6. Kiremt standard precipitation index (SPI) for La Nina years 1988, 1998, 1999 and 2000 CHRIPS data map
                                                        analysis.
                              Kiremt and Belg season coefficient of variation (CV)

  Figure 7. Kiremt and Belg coefficient of variation (CV) from 1981-1999, 2000-2019 and 1981-1999, 2000-2019
                                  respectively using CHRIPS data map analysis.

ISSN: 2393 - 9206                           www.internationaljournalssrg.org                                   Page 63
SSRG International Journal of Geoinformatics and Geological Science (SSRG-IJGGS) – Volume 7 Issue 2 – May – Aug 2020
V. Conclusion Among four El-Nino year happened 1987, 1997, 2002
Adama district is a Bimodal (Belg and Kiremt) Rainfall and 2015, the strongest is 2002 whereas 1997 is
benefiting areas when Bega is the dry, cold period & medium. As La -Nina year identified the strongest over
the harvesting time. Kiremt rainfall amount accounts district was 2000. Variability increases both Kiremt and
80.1%; Belg had 20.1% and Bega had 7.8% from the Belg season from long decade to recent but the highest
annual rainfall received over district. The highest rainfall variability were during Belg seasons 1981-
rainfall variability is during Bega season. Mean Annual 1999.
Rainfall ranges from 678.1mm to 973.5mm and average
annual maximum & minimum temperature is 29.70c In general, Belg and Bega seasonal Rainfall trend has
and 13.10c Celsius, respectively. Extreme events and been decreasing while annual and Kiremt seasonal has
meteorological drought recently happened over district. been increasing. The temperature trend has been
Averagely the season starts during May while the slightly increasing the value which shows climate
season starts at minimum period of April. The season change over district. More Rainfall variability at recent
ends averagely at the end of September and the decade over district during El-Nino and La-Nina
minimum ends at October. Averagely the LGP of happened and Extreme event and Meteorological
district is more than 4 months and minimum and drought occurred of dry days.
maximum is 3 and 4 months, respectively.
VI. Acknowledgements Meteorology Agency of Ethiopia (NMA) support us
The authors declare that there is no conflict of to complete the work, and for providing long-term
interests regarding the publication of this paper. We climatic data free charge.
would like to extended special thanks to National
VII. References
[1] East Shoa Economic and Development Office and Adama
district; Finance and Economic Development Office
[2] Abate Feyissa. (2009). “Climate Change Impact on
Livelihood, Vulnerability and Coping Mechanisms: A Case
Study of West-Arsi Zone”, Ethiopia, 2009. LUCSUS, Lund
University SE-22644, Lund, Sweden.
[3] McSweeney., C., New., M., Lizcano.,G. and Lu., X. (2010).
“The UNDP Climate Change Country Profiles Improving
the Accessibility of Observed and Projected Climate
Information for Studies of Climate Change in Developing
Countries”. Bulletin of the American Meteorological
Society, 91, 157-166
[4] Getnet Feyissa. (2010). “Comparative Analysis of Climate
Variability and Impacts in Central Rift Valley and Adjacent
Arsi Highlands Using GIS and Remote Sensing”.
Department of Earth Sciences Faculty of Science Addis
Ababa University, Addis Ababa, Ethiopia.
[5] “Rainfall variability and crop production in Ethiopia Case
study in the Amhara region”. (Woldeamlak, 2009)
[6] Korecha, D.andBarnston, A. G. 2007, “Predictability of
June-September Rainfall in Ethiopia”, Journal of American
Meteorology Society135, 628-649., NMSA 1996, Degafu
1987
[7] National Meteorological Agency of Ethiopia Eastern and
Central Oromia Meteorology Service Centre
[8] Linso Timungpi and Micky Teron, "The Impact of Climate
Change and Forced Movement: an Overview of the
Incompetence of Laws for Climate Change Refugees" SSRG
International Journal of Humanities and Social Science
Vol-5,Iss-2,2018.
ISSN: 2393 - 9206 www.internationaljournalssrg.org Page 64You can also read