268WEATHER 2021 ATLANTIC HURRICANE SEASON FORECAST
←
→
Page content transcription
If your browser does not render page correctly, please read the page content below
268Weather 2021 Atlantic Hurricane Season Forecast
Issued: April 12, 2021
by Dale C. S. Destin (follow @268weather) – Director (Ag)
Antigua and Barbuda Meteorological Service (ABMS)
268Weather is projecting that the 2021 Atlantic hurricane season will likely be above normal,
with the possibility of being hyperactive–Accumulated Cyclone Energy (ACE) greater than 187.
The forecast spans the full season–June to November, plus May . In obtaining the forecast, data
available through April 10, 2021 were used.
The main reasons for the above normal forecast are the likely above normal sea surface
temperatures (SSTs) across the tropical North Atlantic (TNA), a cold-neutral El Niño Southern
Oscillation (ENSO) and the lagging favourable conditions left by what is forecast to be a recently
ended ENSO, at the start of the hurricane season. A warmer than usual TNA often translates into
lighter than usual trade winds and lower vertical wind shear – both very conducive for an above
normal Atlantic hurricane season. La Niñas enhance hurricane activity and warm ENSOs (El Niños)
do the opposite. Cold-neutral ENSOs sometimes have a similar effect to La Niñas.
Notwithstanding, there are notable uncertainties with the forecast largely due to uncertainties
regarding the evolution of ENSO. Models tend to do a poor job of forecasting ENSO at this time
of the year, due to what is called the “spring barrier”, which will not be overcome before June.
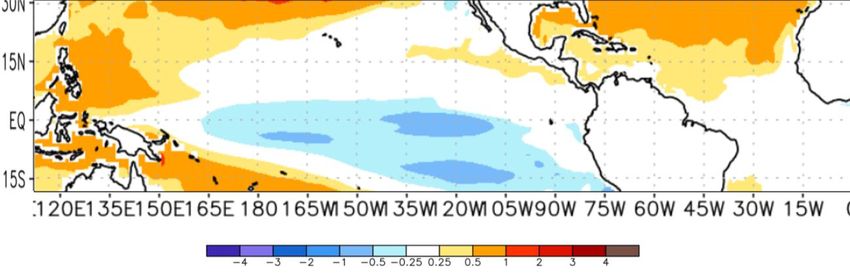
Figure 1: North American Multi-Model Ensemble (NMME) mean SSTs anomalies for Aug to Oct 2021, initialised Apr
2021. Warmer than usual SSTs for the TNA (right top, yellow/orange) – Aug to Oct 2021, and cold-neutral ENSO
forecast for the Pacific (middle, blues).
The forecast calls for 21 named storms with 9 becoming hurricanes and 5 becoming major
hurricanes. The ACE is forecast to be 184. Further, there is a 70% likelihood/confidence of
• 17 to 30 named storms;
• 6 to 14 becoming hurricanes;
1
•   2 to 7 becoming major hurricanes and
    •   109 to 275 ACE.

The seasonal activity is expected to fall within these ranges in 70% of seasons with similar SST
patterns, across the tropical Pacific and Atlantic Oceans, and uncertainties to those expected this
year. These ranges do not represent the total possible ranges of activity seen in past similar years.
These expected ranges are centred above the 1981-2010 seasonal averages of 106 ACE, 12
named storms, 6 hurricanes and 3 major hurricanes. Most of the predicted activity is likely to
occur during the peak of the season–August to September.

There is a 75% probability of an above normal season, 19% probability of a near normal season
and a 6% probability of a below normal season, based on the ACE for the climate period 1981-
2010. This forecast is to be taken as a guide and not as gospel. Forecasts issued in April of an
upcoming hurricane season have only moderate skill, historically. As we get closer to the season,
the forecasting skill normally increases.

Figures 1 and 2 show there is good skill in forecasting the season, in this case, using the CanGEM-
NEMO model SSTs to predict the ACE.

Figure 1a (left): Shows observed vs forecast ACE. The variance is 30%, using CanGEM-NEMO mean SSTs for May to
November 1981-2020, as the training period. Figure 1b (right): The ROC diagram shows very high discrimination by
the model in forecasting above and below normal ACE for the season using CanGEM-NEMO SSTs.

                                                       2
Figure 2: The X special loadings (mode 1) shows the most dominant pattern in SSTs correlation associated with above
normal ACE; the reverse pattern is true for below normal ACE. The canonical correlation for this pair of variables
(SSTs and ACE) is over 0.63. From the temporal scores (mode 1), warm SSTs across the tropical Atlantic Ocean
simultaneously with cool SSTs across the tropical Pacific Ocean tend to coincide with above normal ACE (or season)
and vice versa. Obtained using CanGEM-NEMO mean SSTs for May-November 1981-2020, as the training period.
Methodology
This forecast was obtained with the use of the Climate Predictability Tool (CPT) version 15.7.11,
2019 by Simon J. Mason, Michael K. Tippett and Lulin Song. The software was viewed in canonical
correlation analysis (CCA) mode. Input explanatory (X) files used were NOAA NCDC ERSSTv5 mean
observed SSTs for: March 1971-2021 and January to March 1971-2021; CanCM4i 1981-2021;
CanGEM-NEMO 1981-2021; CanSIPSv2 1981-2021; CFS2 1982-2021 and NCAR CCSM4 1982-2021
mean forecast SSTs for May to November, initialized early April 2021. Also, ECMWF SEAS5 May
to July forecast mean SSTs. The SSTs for the models were ensembled (6 Model Ensemble) by
finding the simple arithmetic mean of the output i.e. the response (Y) variable of all six. The X
domain used was 20°S to 30°N and 140°E to 20°W. The Y variables were ACE values, named
storms, hurricanes and major hurricanes for the Atlantic Basin (including the Caribbean Sea and
the Gulf of Mexico) for the period 1971 to 2020.
The following CPT settings were used:
• X modes: maximum was 8 and the minimum was 1
• Training period (observed SSTs and Y variables): 1971-2020, 50 years.
• Training period (forecast SSTs and Y variables): 1981/82-2020, 39/40 years.
• Climatological period – 1981-2010
• Transformation setting: Gamma distribution
• Confidence level: 70%
• Missing value replacement: best near-neighbor
3• Target season: May to November
• All other settings are by default
Results
Three sets of forecasts were produced, and the final forecast issued is based on the simple
arithmetic mean of the three – see tables 1 and 2 below. Note that the forecast spread may not
be symmetric around the mean value, given the historical distribution of tropical cyclone activity.
SSTs
Forecast May to Nov
Parameters and 5 Model
1981-2010 Average Mar Jan to Mar Ensemble Ensemble
in [brackets] 1971-2021 1971-2021 1981/82-2021 Mean Forecast
ACE [105.6] 151 (87-222) 162 (91-243) 238 (148-361) 184 (109-275)
Named Storms [12] 18 (14-24) 19 (15-27) 27 (22-38) 21 (17-30)
Hurricanes [6] 8 (5-12) 8 (5-12) 12 (8-18) 9 (6-14)
Major Hurricanes [3] 4 (2-6) 4 (2-6) 6 (3-9) 5 (2-7)
Table 1: Forecast parameters with 70 percent confidence intervals in (parentheses)
SSTs
Jun to Nov
5 Model
Forecast Mar Jan to Mar Ensemble Ensemble
Parameters 1971-2021 1971-2021 1982-2021 Mean Forecast
ACE A 67, N 26, B 7 A71, N 22, B 7 A 88, N 9, B 3 A 75, N 19, B 6
Named Storms A 85, N 13, B 2 A 90, N 9, B 1 A 96, N 3, B 1 A 90, N 9, B 1
Hurricanes A 61, N 27, B 12 A 63, N 25, B 12 A 84, N 12, B 4 A 70, N 21, B 9
Major Hurricanes A 63, N 27, B 10 A 67, N 25, B 8 A 82, N 14, B 4 A 71, N 22, B 7
Table 2: Forecast parameters expressed probabilistically. A - above normal; N - near normal and
B - below normal.
Verification of previous forecasts
The tables contain the forecast for each parameter with the 70 percent confidence interval in
(parentheses) i.e. 70% of forecasts are likely to fall in this range. ACE is Accumulated Cyclone
Energy index. So, for example, the 2017, July 5 (best) forecast is for 16 named storms with a 70%
confidence that the number of named storms will be in the range 11-22.
4Update Aug
2017 Apr May Jun Jul 51 4 Obs.
Named Storms - - - 16 (11-22) 18 (13-22) 17
Hurricanes - - - 7 (4-10) 7 (4-10) 10
Major Hurricanes - - - 4 (2-5) 3 (2-5) 6
ACE - - - 140 (75-216) 152 (84-222) 223
Table 3: 1My maiden forecast of the hurricane season
Update May Update Update Jul Update
2018 Apr 10 10 Jun 11 15 Aug 10 Obs.
Named Storms 15 (11-19) 13 (10-17) 11 (8-15) 12 (8-15) 11 (9-15) 142
Hurricanes 7 (4-10) 6 (4-10) 5 (3-8) 5 (3-8) 5 (3-8) 8
Major Hurricanes 4 (2-5) 3 (1-4) 2 (1-4) 3 (1-4) 2 (1-4) 2
ACE 135 (70-200) 119 (63-190) 93 (48-153) 99 (51-167) 93 (51-151) 1303
Table 4: 2There were 15 named storms in 2018 with an ACE of 1323 (2.4 from Alberto), which formed in May, outside
the range of my forecasts of the hurricane season proper – June 1 to Nov 30.
Update May Update Update Jul Update
2019 Apr 10 16 Jun 12 15 Aug 15 Obs.
Named Storms 13 (10-18) 12 (9-17) 13 (10-17) 13 (9-16) 12 (9-16) 174
Hurricanes 7 (4-10) 7 (4-10) 6 (4-9) 6 (4-9) 6 (4-9) 6
Major Hurricanes 3 (1-5) 2 (1-5) 3 (1-5) 3 (2-5) 3 (2-5) 3
ACE 124 (67-201) 113 (62-184) 114 (62-181) 127 (71-198) 136 (77-209) 131
Table 5: 4There were 18 named storms in 2019 with an ACE of 131 (0.245 from Alberto), which formed in May,
outside the range of my forecasts of the hurricane season proper – June 1 to Nov 30.
Update Update Update Update
2020 Apr 10 May 10 Jun 10 Jul 13 Aug 15 Obs.
Named Storms 20 (14-25) 19 (14-23) 21 (17-26) 23 (17-28) 26 (20-32) 30
Hurricanes 9 (6-12) 9 (6-12) 9 (6-13) 9 (6-13) 10 (7-15) 13
Major Hurricanes 5 (3-8) 4 (2-7) 5 (2-7) 5 (3-7) 4 (3-7) 6
ACE 191 (106-288) 189 (112-276) 202 (122-289) 200 (122-283) 218 (141-305) 185
Table 6: Record number of named storms, two (Arthur and Bertha) before the official hurricane season, which were
not captured in the April and May forecasts. ACE accumulation by the two storms amounted to 1.99
Definitions and acronyms
Accumulated Cyclone Energy (ACE) – A measure of a named storm’s potential for wind and storm
surge destruction defined as the sum of the square of a named storm’s maximum wind speed (in
104 knots2) for each 6-hour period of its existence. The 1981-2010 average value of this
parameter is 106 for the Atlantic basin.
Atlantic Basin – The area including the entire North Atlantic Ocean, the Caribbean Sea, and the
Gulf of Mexico.
5El Niño – A 12-18-month period during which anomalously warm sea surface temperatures occur
in the eastern half of the equatorial Pacific. Moderate or strong El Niño events occur irregularly,
about once every 3-7 years on average.
ERSSTv5 – Extended Reconstructed Sea Surface Temperature version five.
CCSM4 – Community Climate System Model version 4.
CFSv2 – Climate Forecast System version 2 GCM.
CMC4 – Canadian Meteorological Centre version 4 GCM.
EMC – Environmental Modeling Center of the United States.
GCM – General Circulation Model.
GFDL-FLOR – Geophysical Fluid Dynamics Laboratory-Forecast-Oriented Low Ocean Resolution
GCM.
Hurricane (H) – A tropical cyclone with sustained low-level winds of 74 miles per hour (33 ms-1
or 64 knots) or greater.
Major Hurricane (MH) – A hurricane which reaches a sustained low-level wind of at least 111 mph
(96 knots or 50 ms-1) at some point in its lifetime. This constitutes a category 3 or higher on the
Saffir/Simpson scale.
Named Storm (NS) – A hurricane, a tropical storm or a sub-tropical storm.
NCAR – US National Centre for Atmospheric Research.
NCDC – National Climate Data Center of the United States
NCEP – National Centers for Environmental Prediction of the United States.
NOAA – National Oceanic Atmospheric Administration of the United States.
Saffir/Simpson Hurricane Wind Scale – A measurement scale ranging from 1 to 5 of hurricane
wind intensity. One is a weak hurricane; whereas, five is the most intense hurricane. Tropical
North Atlantic (TNA) index – A measure of sea surface temperatures in the area from 5.5-23.5°N,
57.5-15°W.
SSTs – Sea surface temperatures.
6Tropical Cyclone (TC) – A large-scale circular flow occurring within the tropics and subtropics
which has its strongest winds at low levels; including hurricanes, tropical storms and other
weaker rotating vortices.
Tropical Storm (TS) – A tropical cyclone with maximum sustained winds between 39 mph (18 ms-
1 or 34 knots) and 73 mph (32 ms-1 or 63 knots).
Vertical Wind Shear – The difference in horizontal wind between 200 mb (approximately 40,000
feet or 12 km) and 850 mb (approximately 5000 feet or 1.6 km).
268Weather will issue an update to this forecast for the 2021 Atlantic Hurricane Season (June 1
to November 30, plus May) around the 10th of every month until August. The first update will be
issued around May 10, 2021.
7You can also read