Assessment of the surface and structure of elements produced in additive manufacturing technology after chemical treatment - MATEC Web of Conferences
←
→
Page content transcription
If your browser does not render page correctly, please read the page content below
MATEC Web of Conferences 332, 01010 (2021)                     https://doi.org/10.1051/matecconf/202133201010
19th International Conference Diagnostics of Machines and Vehicles

      Assessment of the surface and structure of
      elements produced in additive manufacturing
      technology after chemical treatment
      Dawid Marciniak1,*
      1UTP  University of Science and Technology, Department of Manufacturing Techniques, Al. prof. S.
       Kaliskiego 7, 85-796 Bydgoszcz, Poland

                    Abstract. Samples made of ABS material were produced on devices from
                    three different manufacturers: Stratasys, Velleman, 3Novatica. The quality
                    of the printed surface was improved by vaporization with acetone vapours.
                    Roughness measurements were performed, which proved the improvement
                    of the surface after vaporization. The structure of the produced samples was
                    also tested using a computer microtomography. It has been shown that
                    excessive exposure to the solvent significantly changes the geometrical
                    dimensions of models exposed to the vaporization process.

      1 Introduction
      Additive manufacturing technologies, as opposed to conventional technologies for producing
      elements from polymer materials, are characterized by high surface roughness. This
      phenomenon is caused by the layered deposition of plasticized material [1]. The side walls
      of the produced model have grooves where the layers meet, which is caused by the geometry
      of the nozzle outlet [2]. These grooves disqualify elements produced additively from some
      applications, e.g. despite printing from a material certified for contact with food, food
      remains in the cracks, where bacteria and fungi multiply with success. Manufacturers of
      additive manufacturing machines strive for the best possible quality of models, placing less
      emphasis on the mechanical properties of these products [3]. There are many methods of
      improving the quality of printed surfaces. We can distinguish chemical methods such as
      vaporization [4], where the material is treated by vapours of solvent, or short-term solvent
      baths and coatings. Mechanical methods include: machining, polishing and sandblasting of
      printed models [5-7]. Vaporization with acetone is one of the best methods of improving the
      quality of printed surfaces made of acrylonitrile butadiene styrene (ABS) [8]. The surface of
      the element treated with this method resembles the moulded part obtained with the injection
      technology [9]. The outer layer of the printed model becomes more smooth as the ABS is
      dissolved by acetone [10]. The biggest disadvantage of additive technologies is the
      occurrence of technological voids. These are areas of discontinuity in the model caused by
      the method of overlapping single paths of material [11].
          The aim of this work is to evaluate the printed surface after acetone vaporization treatment
      and to evaluate the structure of printed samples, as well as the influence of acetone vapours
      on technological voids.
      2 Methodology
      The test samples were made in accordance with PN EN ISO 527, shape 5a. The material used
      to produce the samples was a 1.68 mm ABS P430 filament from Stratasys (Israel). The
      samples were made on 3 devices for rapid prototyping: Dimension Elite by Stratasys (Israel),
      Vertex K8400 by Velleman (Belgium) and Gate 1.0 by 3Novatica (Poland). The roughness

      * Corresponding author: dawid.marciniak@utp.edu.pl

© The Authors, published by EDP Sciences. This is an open access article distributed under the terms of the Creative Commons
Attribution License 4.0 (http://creativecommons.org/licenses/by/4.0/).
MATEC Web of Conferences 332, 01010 (2021) https://doi.org/10.1051/matecconf/202133201010
19th International Conference Diagnostics of Machines and Vehicles
was measured on a Mahr Surf profilographometer (Germany). The geometry of the samples
was measured with a MarCal 16EWR caliper from Mahr (Germany). The microtomographic
examination was performed using the SkyScan 1272 from Bruker (Belgium). The acetone
vaporization process was carried out on a stand designed for the needs of the research [4].
The parameters of the printing process are presented in Table 1. The nozzle diameter was a
variable during the production process. Roughness measurement and geometry measurement
were performed before vaporization and 48 hours after the acetone vaporization process. The
time of conditioning the samples in acetone vapors was variable and amounted to 10 s, 20 s
and 30 s.
Table 1. Parameters of 3D printing proces.
Parameters Dimension Elite Gate 1.0 Vertex K8400
Nozzle diameter [mm] 0,35 0,50 0,4
Temperature of printing [°C] 275 275 275
Temperature of heated bed [°C] 75 (heated chamber) 75 75
Speed of printing [mm/s] unknown 40 40
Layer thickness [mm] 0,254 0,254 0,254
3 Results
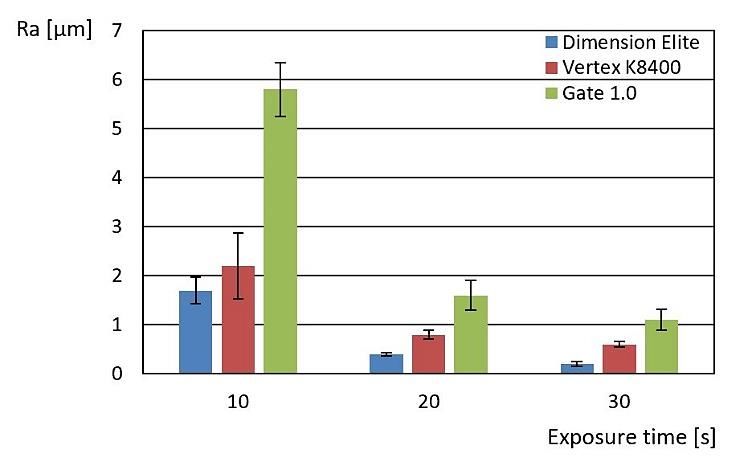
The samples were prepared at three different devices differ in initial average value of
roughness. The best result was obtained for the Dimension Elite device, the roughness was
lower by about 50% compared to the other devices (Fig. 1). The reason for such a result was
the use of a tightly closed working chamber in the Dimension Elite printer, in which the
process temperature was kept constant - 75 ℃, it limited the irregular cooling of individual
printed layers, and thus the internal stress in the produced model.
Fig. 1. Average roughness of samples before acetone vaporization.
Figure 2 shows the average roughness measurement results for different sample exposure
times to acetone vapours. The greatest improvement in surface quality was observed for the
longest duration of acetone exposure to a printed sample - 30 s. For Dimension Elite, the
reduction in Ra value was 5050%, for the Vertex K8400 printer this value decreased by
3583% and for Gate 1.0 the decrease in the average Ra value was 1809%.
2MATEC Web of Conferences 332, 01010 (2021) https://doi.org/10.1051/matecconf/202133201010
19th International Conference Diagnostics of Machines and Vehicles
Fig. 2. Average roughness results for samples after acetone vaporization.
The structure of the samples was examined using the non-destructive method, i.e. computed
tomography. Figure 3 shows examples of cross-sections of reference samples in the research
section. The reference samples were not treated with acetone. It was observed that depending
on the diameter of the nozzle in a given device, the size of technological voids formed in the
process of 3D printing (black fields in figure 4-6) differed. Technological voids arise as a
result of forced movement of the print head caused by the control software. The head’s nozzle
has the shape of a circle, which makes it impossible to print the perfect angles (there are
always radii) generated by the model cutting software. In addition, the stream of plastic
leaving the nozzle flows to the sides, which causes less discontinuity in the model. In figure
3c), a large deformation of the test sample can be observed, which was caused by the design
of the device, which allowed for uneven cooling of the applied layers.
Fig. 3. Examples of cross-sections of the samples printed before vaporization of acetone vapours: a)
Dimension Elite, b) Vertex K8400, c) Gate 1.0. Black areas inside the sample - technological voids.
3MATEC Web of Conferences 332, 01010 (2021) https://doi.org/10.1051/matecconf/202133201010
19th International Conference Diagnostics of Machines and Vehicles
On figures 4-6 are examples of cross-sections of the samples subjected to the process of
acetone vaporization. As the time of exposure to acetone vapours increases, a decrease in
technological voids can be observed. The best results were observed for samples produced
on the Dimension Elite.
Fig. 4. Examples of cross-sections of the samples printed after vaporization with acetone vapours
during 10 s: a) Dimension Elite, b) Vertex K8400, c) Gate 1.0. Black areas inside the sample -
technological voids.
Fig. 5. Examples of cross-sections of the samples printed after vaporization with acetone vapours
during 20 s: a) Dimension Elite, b) Vertex K8400, c) Gate 1.0. Black areas inside the sample -
technological voids.
4MATEC Web of Conferences 332, 01010 (2021) https://doi.org/10.1051/matecconf/202133201010
19th International Conference Diagnostics of Machines and Vehicles
Fig. 6. Examples of cross-sections of the samples printed after vaporization with acetone vapours
during 30 s: a) Dimension Elite, b) Vertex K8400, c) Gate 1.0. Black areas inside the sample -
technological voids.
An analysis of the void spaces present in the test samples was also performed using the
CTAn software (Bruker). The analysis allowed to confirm the reduction of technological
voids with the increase of exposure time to solvent vapours. The results are presented in
Table 2. The highest percentage of voids during and after vaporization can be observed for
samples made on the Dimension Elite device. On the other hand, the smallest average void
size was observed for samples made on the Vertex K8400 device.
Table 2. Percentage of voids and average pore size for samples printed by Dimensional Elite, Vertex
K8400 and Gate 1.0 printers.
Exposure Dimension Vertex Gate
Indicator
time [s] Elite K8400 1.0
0 1,40 1,29 0,56
Technological 10 1,10 1,08 0,50
voids [%] 20 0,94 0,75 0,46
30 0,89 0,62 0,42
0 0,33 0,46 0,86
Average pore size 10 0,29 0,39 0,42
[mm2] 20 0,25 0,18 0,30
30 0,19 0,12 0,26
The geometric measurement of the samples was also made (Table 3), which shows that
the length of the samples (L) after acetone vaporization slightly changed. The average width
of the samples in the measuring section (B) decreased by 3%, 2.9% and 4.6% for Dimension
Elite, Vertex K8400 and Gate 1.0, respectively. Average sample height (H) decreased by
3.3%, 4.3%, and 6.3% for Dimension Elite, Vertex K8400 and Gate 1.0, respectively.
5MATEC Web of Conferences 332, 01010 (2021) https://doi.org/10.1051/matecconf/202133201010
19th International Conference Diagnostics of Machines and Vehicles
Table 3. Average geometric measurements of samples before and after vaporization.
Device Dimension Elite Vertex K8400 Gate 1.0
Exposure L B H L B H L B H
time [s] [mm] [mm] [mm] [mm] [mm] [mm] [mm] [mm] [mm]
75,01 4,01 2,16 74,87 4,49 2,44 75,58 4,73 2,01
0 ± ± ± ± ± ± ± ± ±
0,02 0,03 0,02 0,15 0,07 0,06 0,21 0,15 0,07
74,95 3,94 2,14 74,68 4,44 2,36 75,19 4,64 1,95
10 ± ± ± ± ± ± ± ± ±
0,05 0,03 0,04 0,12 0,04 0,02 0,30 0,17 0,17
74,94 3,92 2,13 74,61 4,39 2,35 75,14 4,57 1,90
20 ± ± ± ± ± ± ± ± ±
0,03 0,04 0,05 0,11 0,08 0,03 0,25 0,19 0,13
74,89 3,89 2,09 74,58 4,36 2,34 75,11 4,52 1,89
30 ± ± ± ± ± ± ± ± ±
0,04 0,01 0,04 0,08 0,04 0,02 0,14 0,13 0,14
4 Conclusions
Three different printers of different design and accuracy were used in the study. The best
turned out to be Dimension Elite - a professional printer, characterized by the best surface
quality and the highest accuracy. The second was the Vertex K8400, which had the smallest
nozzle diameter which keeps the quality high. Gate 1.0 with 0.5mm nozzle was the least
accurate.
Acetone vaporization is one of the best methods to improve the quality of ABS models.
Thanks to acetone, the surface quality of the samples was at a high level.
Acetone dissolves ABS, so surface quality can be improved with a short exposure time. Be
careful that the exposure time was not too long, because it can permanently damage the
printed model.
The big difference in roughness results is caused by application of different printers and
their working conditions, despite similar settings. The samples were printed on the
Dimension elite, were sealed in a heating chamber throughout the process and had a constant
temperature. The samples printed on the Vertex K8400 printer were exposed to blasts of air,
which resulted in faster cooling of individual layers of the model. Samples prepared for the
Gate 1.0 in addition to air blasts were exposed to higher vibrations because of the movements
of the heated table moving in the Y-axis
Regardless of the machine used, acetone for vaporization, provides a high surface quality
that exceeds the quality standards of the best printers, also is the cheapest option for
improving surface quality.
References
1. P. Czyżewski, M. Bieliński, D. Sykutera, M. Jurek, M. Gronowski, Ł. Ryl, H. Hoppe,
Rapid Prototyping Journal, Vol. 24, Iss. 9, pp. 1447-1454, (2018)
2. P. Czyżewski, M. Falkiewicz, S. Siutkowski, Badanie technologiczności drukowania
obiektów przestrzennych w technologii FDM (Fused Deposition Modeling), 18
Nationwide Conference: Recirculation Vol. 19 Iss: 2, pp.118 - 125 in Machine
Construction, Bydgoszcz, Poland, (2014)
3. D. Michta, B. Kaczmarska, W. Gierulski, A. Szmidt, Uniwersalność druku 3d w
technologii fdm. Conference materials.
4. D. Marciniak, P. Szewczykowski, P. Czyżewski, D. Sykutera, M, Bieliński, Polimery,
Vol.63, No. 11-12, pp. 785-790, (2018)
6MATEC Web of Conferences 332, 01010 (2021) https://doi.org/10.1051/matecconf/202133201010
19th International Conference Diagnostics of Machines and Vehicles
5. S.-H. Ahn, M. Montero, D. Odell, S. Roundy, P. Wright, Rapid Prototyping Journal,
2002, Vol. 8 Iss: 4, pp. 248 - 257, (2002)
6. R. Sanatgar, C. Campagne, Nierstrasz, Applied Surface Science, Volume 403, pp. 551-
563, (2017)
7. A. Armillotta, Rapid Prototyping Journal 12(1), pp.35–41 (2006)
8. R. Singh, S. Singh, I. Singh, F. Fabbrocino, F. Fraternali, Composites Part B:
Engineering, 111, (2017)
9. M. Dawoud, I. Taha, S. Ebeid, Journal of Manufacturing Processes, 21, (2016)
10. S. Pietanza, D. Sorgente, G. Percoco, Rapid Prototyping Journal, (2015)
11. M. Mohammadizadeh, A. Imeri, I. Fidan, M. Elkelany, Composites Part B, vol. 175,
(2019)
7You can also read