Summary of Results for the 2005 National-Scale Assessment
←
→
Page content transcription
If your browser does not render page correctly, please read the page content below
Summary of Results for the 2005 National-
              Scale Assessment
INTRODUCTION

NATA is a prioritization tool. Its purpose is to identify geographic areas, pollutants and
emission sources that should be evaluated further to gain a better understanding of risks. EPA
uses NATA in many ways, including:
       To set priorities for improving data in emissions inventories
       To work with communities in designing their own local-scale assessments, and
       To help direct priorities for expanding and improving air toxics monitoring.

NATA helps state, local and tribal air agencies focus resources on geographic areas, pollutants
and types of emission sources for closer investigation. Once risks are further characterized,
agencies can determine steps to reduce air toxics emissions where necessary. NATA provides
broad estimates of risk over geographic areas of the country and not definitive risks to specific
individuals. This is because NATA uses models to estimate risks; it is not designed to determine
actual risks. NATA is designed to prioritize pollutants and areas for further study, not to compare
one area of the country’s risk to another. This is because the emissions data underlying the
assessment can vary in level of detail from state to state.

Of the 177 air toxics plus diesel PM included in the 2005 national-scale assessment, the risk
characterization considers the risk of both cancer and noncancer effects from inhalation of 139 of
these air toxics -- the subset of pollutants with health data based on chronic exposure. The
purpose of this national-scale assessment is to understand these cancer risks and noncancer
health effects in order to help the EPA and others to identify pollutants and source categories of
greatest potential concern, and to set priorities for the collection of additional information to
improve future assessments. The assessment represents a "snapshot" in time for characterizing
risks from exposure to air toxics. The national-scale assessment is not designed to characterize
risks sufficiently for it to be the sole source for regulatory action.

The 2005 national-scale risk assessment is based on a 2005 inventory of air toxics emissions (the
most complete and up-to-date available). It then assumes individuals spend their entire lifetimes
exposed to these air toxics. Therefore, it does not account for the reductions in emissions that
have occurred since 2005 or those that will happen in the near future due to regulations for
mobile and industrial sources (see further details in the Air Toxics Reduction section of the Web
site). This risk assessment represents an update and enhancement to EPA's 2002 national-scale
assessment. The next assessment will focus on emissions for the year 2008. It will be released in
2012.

Note that in this assessment, the potential carcinogenic risk from diesel PM is not addressed
because there currently is no unit risk estimate available. However, there are noncancer results.
Learn more about EPA's qualitative assessment of diesel PM.

Given its broad scope, this risk characterization is subject to a number of limitations due to gaps
in data or in the state of the science for assessing risk. For example, the current assessment does
not yet include results for dioxins, compounds that may contribute substantially to risks. In

                                                                                                      1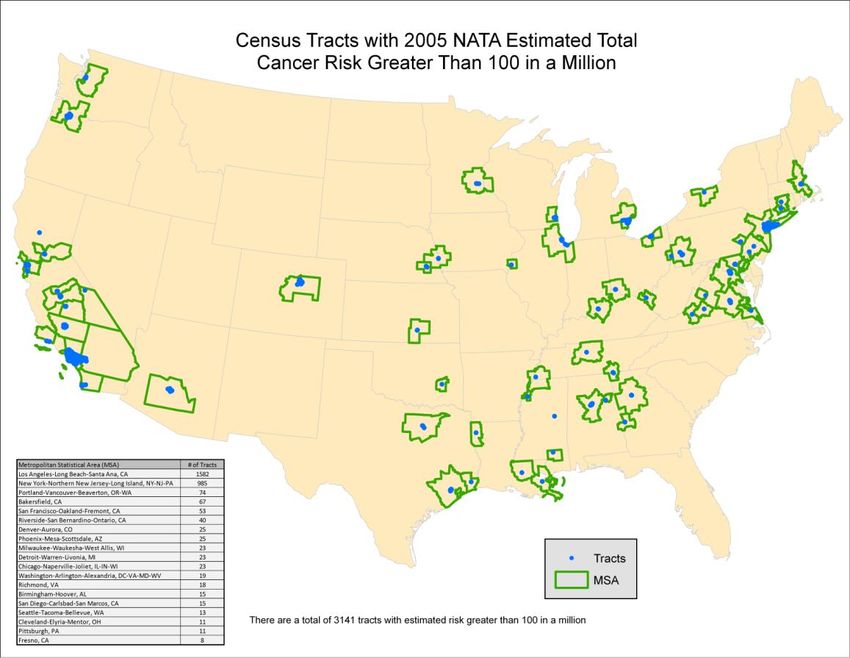
addition, the EPA is reassessing the health effects of many pollutants considered in this study. A
status report for all EPA health effect assessments is available at
cfpub.epa.gov/iristrac/index.cfm. For more details about the limitations in the risk
characterization, refer to the limitations section on the Web site.

The risk characterization, which was limited to inhalation risk from outdoor sources, was
designed to answer the following questions:

   1. Which air toxics pose the greatest potential risk of cancer or adverse noncancer effects
      across the entire United States?
   2. Which air toxics pose the greatest potential risk of cancer or adverse noncancer effects in
      some areas of the United States?
   3. Which air toxics pose lesser, but still significant, potential risk of cancer or adverse
      noncancer effects across the entire United States?
   4. When risks from all air toxics are combined, how many people have the potential for an
      upper-bound lifetime cancer risk greater than 10 in a million?
   5. When potential adverse respiratory or neurological effects from all air toxics are
      combined, how many people have the potential for exposures that exceed reference levels
      intended to protect against adverse effects, i.e., a target organ-specific hazard index
      greater than 1.0?

For general background on risk characterization, see the discussion in questions and answers
format on this topic.

SUMMARY OF RESULTS

Based on a comparison of the cancer and noncancer risks estimated for the 139 air toxics
quantified by the 2005 national-scale assessment, it is possible to determine which air toxics
pose the greatest potential risk in the United States. A summary of these findings are reported
below. Cancer risks in this assessment are presented as lifetime risks, meaning the risk of
developing cancer as a result of exposure to each air toxic compound over a normal lifetime of
70 years. Noncancer risks are presented in terms of the ratio between the exposure and a
reference concentration. This ratio is called the hazard quotient. The risk characterization
summary below focuses on results at the national level, where the EPA believes the results are
most meaningful.

EPA assessed 80 of the air toxics as carcinogens.
Number of Air Toxics with WOE Classification* and Unit Risk Estimate
Carcinogenic to humans – 10
Likely carcinogenic to humans – 53
Suggestive evidence of carcinogenic potential – 16
Range from Likely to not likely carcinogenic to humans - 1 (includes the 8 Groups of PAH)
* Based on the 2005 Cancer Guidelines. For ease of presentation, the WOE scheme under the
1986 Cancer Guidelines is combined with the new scheme (i.e., A = Carcinogenic to humans; B1
and B2 = Likely carcinogenic to humans; C = Suggestive evidence; D = Inadequate information;
E = Not likely carcinogenic to humans).

                                                                                                  2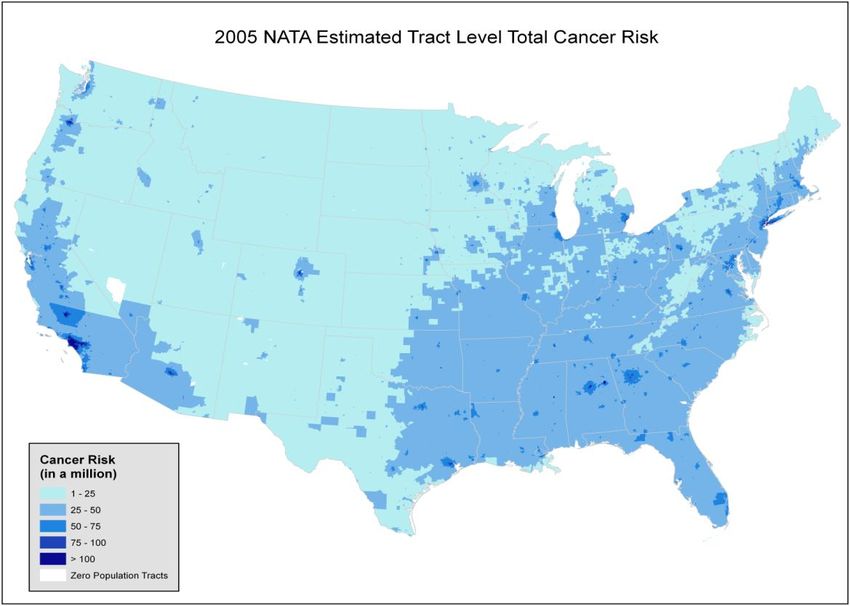
To help understand the results, it should be noted that:

        Concentration results (ambient and exposure) are provided for 177 air toxics plus diesel
        PM
        Cancer results are presented for 80 air toxics that have quantitative dose-response
        information
        Noncancer results are presented for 110 air toxics with quantitative dose-response
        information
        Many noncancer reference concentrations incorporate protective assumptions designed to
        provide a margin of safety. A hazard quotient greater than one does not necessarily
        suggest a likelihood of adverse effects. A hazard quotient equal to or less than one,
        however, suggests that exposures are likely to be without an appreciable risk of
        noncancer effects during a lifetime. Furthermore, the hazard quotient cannot be translated
        into a probability that an adverse effect will occur, and is not proportional to risk

For more information on the specific organ or organ systems adversely affected by the air toxics
in this assessment, go to the table in Health Effects Information (PDF) (12pp, 82k).

The following conclusions on individual air toxics compounds were drawn from the risk
characterization.

The following Table presents the criteria for classifying the NATA 2005 air toxics and will be
helpful in understanding the conclusions below. In general, drivers and contributors are defined
as air toxics showing a particular level of risk or hazard for some number of people exposed.
They are also presented in order of their cancer weight-of-evidence (WOE) classification, (i.e.,
beginning with "carcinogenic to humans").

         2005 NATA Health Effects Drivers and Contributors Risk Characterization
                                                                 Number of People or
    Risk Characterization      Risk Exceeds (in a              2
                                                       HI > 1.0 Greater Exposed
    Category                   million)1
                                                                 (in millions)
    National Cancer Driver          10                                     25
    Regional Cancer Driver          10                                     1
    Regional Cancer Driver          100                                    0.01
    National Cancer Contributor     1                                      25
    Regional Cancer Contributor     1                                      1

    National Noncancer Driver                                   1.0        25
    Regional Noncancer Driver                                   1.0        0.01

1
 Cancer risks are upper-bound lifetime cancer risks (i.e., a plausible upper limit to the true
probability that an individual will contract cancer over a 70 year lifetime as a result of a given
hazard (such as exposure to a toxic chemical)). This risk can be measured or estimated in
numerical terms (e.g., one chance in a million).

                                                                                                     3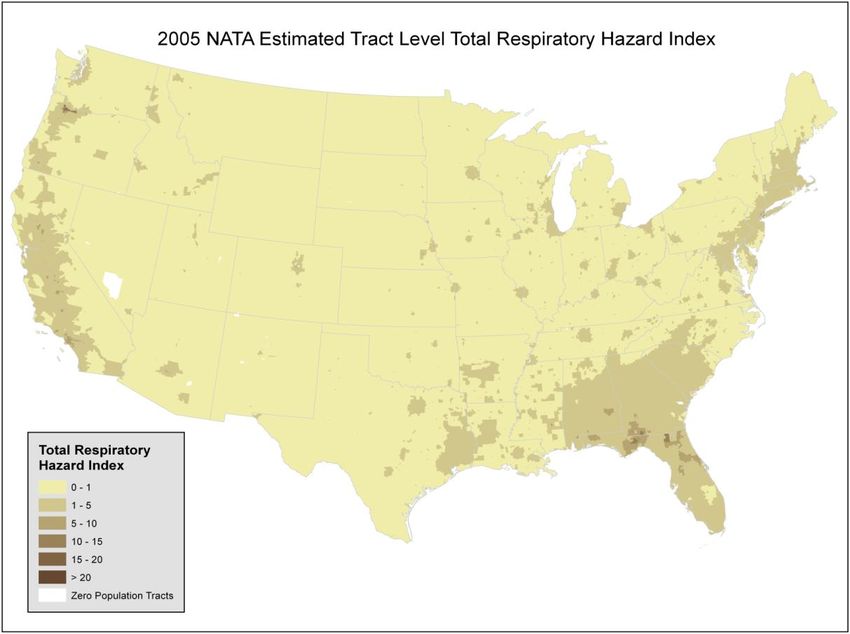
2
 HI = the sum of hazard quotients for substances that affect the same target organ or organ
system. Because different pollutants may cause similar adverse health effects, it is often
appropriate to combine hazard quotients associated with different substances to understand the
potential health risks associated with aggregate exposures to multiple pollutants.

        National cancer risk driver:
           o Formaldehyde: "likely carcinogenic to humans"
        Regional cancer risk drivers:
           o Benzene: "carcinogenic to humans"
           o PAHs: "likely carcinogenic to humans"
           o Naphthalene: "suggestive evidence of carcinogenicity"
        National cancer risk contributors:
           o 1,3-Butadiene; Arsenic compounds; Chromium compounds; Coke oven
              emissions: all “carcinogenic to humans”
           o Acetaldehyde; Acrylonitrile; Carbon tetrachloride; Ethylene Oxide;
              Tetrachloroethylene: all “likely carcinogenic to humans”
           o 1,4-Dichlorobenzene: “suggestive evidence of carcinogenicity”
           o Ethylbenzene:
        Regional cancer risk contributors:
           o Nickel compounds: "carcinogenic to humans"
           o 1,3-Dichloropropene; Methylene chloride : both "likely carcinogenic to humans

        National noncancer hazard drivers:
           o Acrolein
        Regional noncancer hazard drivers:
           o 2,4-Toluene diisocyanate; Chlorine; Diesel PM; Hexamethylene diisocyanate;
              Hydrochloric acid; Manganese compounds

Health Effects of National Air Toxic Drivers

    Cancer Risk Drivers
      Formaldehyde - Acute (short-term) and chronic (long-term) exposures have been shown
             to cause respiratory symptoms and irritation to the eyes, nose, and throat. Human
             studies have suggested an association between formaldehyde exposure and lung
             and nasopharyngeal cancer. Studies in animals have reported an increased
             incidence of nasal squamous cell cancer. EPA considers formaldehyde “Likely to
             Be Carcinogenic to Humans”.

    Noncancer Drivers
       Acrolein - It is toxic to humans following inhalation, oral or dermal exposures. Acute
              and chronic inhalation exposure may result in eye, nose and throat irritation and
              respiratory tract congestion. EPA considers the existing acrolein data to be
              inadequate for assessing human carcinogenic potential.

The following conclusions on simultaneous exposure to all air toxics compounds were
drawn from the risk characterization.

Cumulative Cancer Risks:
NATA estimates that all 285 million people in the U.S. have an increased cancer risk of greater
than 10 in one million. 13.8 million people (less than 5 percent of the total U.S. population based
                                                                                                   4
on the 2000 census) have an increased cancer risk of greater than 100 in a million. The average,
national, cancer risk for 2005 is 50 in a million. This means that, on average, approximately 1 in
every 20,000 people have an increased likelihood of contracting cancer as a result of breathing
air toxics from outdoor sources if they were exposed to 2005 emission levels over the course of
their lifetime
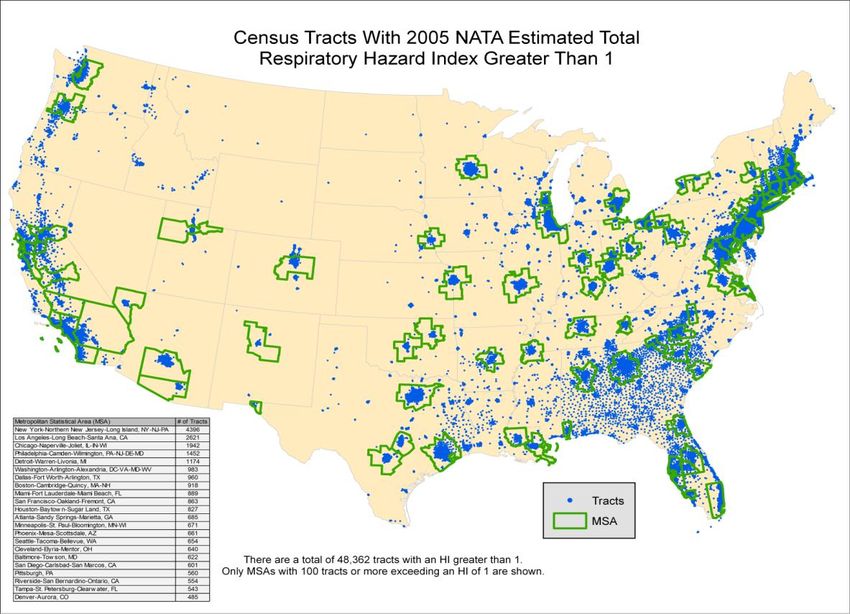
Cumulative Noncancer Hazards:
Ideally, hazard quotients should be combined for pollutants that cause the same adverse effects
by the same toxic mechanism. However, because detailed information on mechanisms was
unavailable for most of the substances considered in this assessment, the EPA used a simpler and
more conservative method. Many of the pollutants in this assessment cause adverse effects in
humans or animals by irritating the lining of the respiratory system. Although it is not clear that
these respiratory effects occur by the same mechanisms for all such air toxics compounds, the
EPA protectively assumed that these effects could be added for each target organ. These additive
effects were represented by a "hazard index," which is the sum of the hazard quotients of the 41
air toxics compounds in the 2005 NATA that affect the respiratory.
The respiratory hazard index was dominated by a single substance, acrolein, which contributed
about 75 percent of the nationwide average non-cancer hazard. The respiratory hazard index
exceeded 1.0 for approximately 69 million people while the HI exceeded 10 for more than
174,000 people. These estimates for acrolein differ greatly from the 2002 NATA estimates.
This is primarily due to the removal of fires, which were a big contributor of atmospheric
acrolein in 2002, from the 2005 inventory and assessment.
5Summary Risk Maps (Note: Hawaii, Alaska, and the Virgin Islands are not included on
these maps although they were included in this 2005 NATA.)
6Document date: 2/17/11
7You can also read