Reconfiguring Low Voltage Networks To Increase Voltage And Loss Of Electricity - International Journal of Scientific and ...
←
→
Page content transcription
If your browser does not render page correctly, please read the page content below
International Journal of Scientific and Research Publications, Volume 11, Issue 6, June 2021 299
ISSN 2250-3153

 Reconfiguring Low Voltage Networks To Increase
 Voltage And Loss Of Electricity
 Bambang Winardi1, Enda Wista Sinuraya1, Erlin Dolphina2, Yuli Christyono 1, Denis1, Tejo Sukmadi1, Sudjadi1, Ajub Ajulian
 Z.M1, Yosua Alvin Adi Soetrisno1, Sumardi1, Susatyo Handoko1
 1
 Department of Electrical Engineering, Diponegoro University, Semarang Indonesia
 2
 Faculty of Computer Science, Dian Nuswantoro University, Semarang Indonesia

 DOI: 10.29322/IJSRP.11.06.2021.p11439
 http://dx.doi.org/10.29322/IJSRP.11.06.2021.p11439

Abstract : In the operation of the electric power system, a good quality and level of reliability is needed, one of which is that the
voltage that reaches the customer does not experience a voltage drop below the standardization from PLN. The voltage drop
regulation according to SPLN No.72 of 1987 is the voltage drop on the Medium Voltage Network is a maximum of 5%, the voltage
drop on the transformer is a maximum of 3%, the voltage drop on the Low Voltage Network is a maximum of 4%, and the voltage
drop on the service line is a maximum of 1%. Brumbung Village, which is located in Mranggen District, Demak Regency, is one of
the areas experiencing stress drop problems. The measured voltage at the Low Voltage Network subscriber location at the end of
the day at 12.00 is 173 Volts, and at night when the peak load occurs at 19.00 is 154 Volts. With these conditions it is necessary to
reconfigure the network in the area.
Network reconfiguration planning includes the addition of 10 new poles to get consumers closer to the voltage source, enlarging
the network cable size, adding a 50KVA 1-phase distribution transformer, and reconfiguring house connections. After
reconfiguring the network, the magnitude of the voltage drop simulation results from the ETAP voltage drop is 0.4% - 2.6% and
the power loss is 1.1%, these results are in accordance with the SPLN, namely the allowable voltage drop does not exceed 5%,
(SPLN 72 , 1987).
Keywords: voltage drop, power loss, network repair.

 I. INTRODUCTION

The electrical problem felt by the public is a voltage problem. One of the areas experiencing stress reduction problems is Brumbung
Village, Demak Regency. The stress reduction on customers in this area exceeds the standards allowed in the SPLN. The measured
voltage at the JTR customer location at the end of the day at 12.00 is 173V, and at night when the peak load occurs at 19.00 is 154V.
With a very low voltage causes customer electronics to become damaged quickly. At 19.00 when there is a peak load, consumers
cannot handle TV, TL lamps, radios, refrigerators and other electronic devices. The customer can only build an incandescent lamp
but the flame is dim.
Based on the survey results, the network system is carried out radially with the number of draws at several location points exceeding
the provisions allowed in the SPLN, namely the distance between the draws on the house channel exceeds 30 meters with the number
of pulls exceeding 5 pieces. Meanwhile, according to the SPLN, the distance between the draws on the house channel (SR) does not
exceed 30 meters with a maximum number of customer traps 5 pieces. The impact of this condition is the voltage drop or voltage
drop received at the customer side, this is due to the large stress losses in the conductor due to the long pull.[4,5,6]
From this case the writer will calculate the amount of voltage and power loss (losses) generated and simulate it in the ETAP 12.6
software and plan network reconfiguration for problems in the area.[7,8]

 II. RESEARCH METHODS
2.1 Low Voltage Network Voltage Drop
 One of the criteria considered in designing a Low Voltage Network is the voltage drop. Based on SPLN No.72: 1987 the
allowable voltage drop limits (∆ V maximum) are as follows:
1.Drop Voltage on Medium Voltage Network = 5%
2.Drop Voltage on Transformer = 3%
3.Drop Voltage on Low Voltage Network = 4%
4. Voltage Drop on Service Line = 1%
The value of voltage drop (∆ V) usually varies depending on load fluctuation. So that in order to optimize the network, the
maximum value is taken according to SPLN No. 72: 1987.
To get the amount of voltage drop within this limit, the selection of the conductor used must consider the following:

 This publication is licensed under Creative Commons Attribution CC BY.
http://dx.doi.org/10.29322/IJSRP.11.06.2021.p11439 www.ijsrp.org
International Journal of Scientific and Research Publications, Volume 11, Issue 6, June 2021 300
ISSN 2250-3153
1. Type of Conductor
2. The cross-sectional area of the conductor.
3. Network Length
4. Load density
In addition to the selection of the conductor used, it must be limited to the amount of load current that flows in accordance with
the KHA (Current Conducting Capacity) of the type of conductor so that the allowable voltage drop limit can be achieved
(Pusdiklat PLN, 2009: 43).
According to the Distribution Network Criteria Design book published by Pusdiklat PT.PLN (Persero) in 2009 on page 44, the
type, area, and length of the conductor used for the JTR will affect the amount of impedance (Z) of the JTR. Multiplying the
impedance Z with the current flowing will get the amount of voltage drop on the JTR, like the following formula:

 ∆V = I x Z
Information :
∆V = Voltage drop (Volt).
I = The load current that flows (A).
Z = Impedance JTR (Ohm)

If the Low Voltage Network is represented as a diagram like the one above, then according to Kirchhoff's Law:
VS = VL + (R + j X). L = VL + RI + j X. I
V drop = VS - VL = RI + j X. I
 = I (R + j X) Volt
 = Re (I Z)
Where :
Real size Z = (R2 + X2)^1/2
Information :
 Z = Low Voltage Network Impedance (Ohm)
R = Conducting resistance (Ω / km).
X = Conducting Reactance (Ω / km).

2.2 Losses
 Losses are a form of loss of electrical energy that comes from the difference between the amount of available electrical
energy and the amount of electrical energy sold. These losses are caused by two factors, namely technical factors in the form of
network problems and non-technical factors, namely inaccuracy in recording. usage or in the calculation of kWh. In economic
terms, losses are closely related to the problem of efficiency, so it can be concluded that the more inefficient, the smaller the profit
from the income earned. The cost inefficiency that occurs in the flow of electrical energy is closely related to problems in terms of
technology and the role of human resources,[16].
 Losses = I2 x R x l
Presentase Losses :

 % Losses = x 100 %

Information :
a = value of losses (Watt)
b = feed power from the substation (Watt)

2.3 Figure of Existing Network of Case Study Sites
 In the existing network that has been installed at the location of this case study, it is taken from the Morawa brand 50 KVA
transformer which is connected to a low-voltage network (JTR) with a 2x35mm2 + N25 LVTC / NFA2X-T conductor which is then
supplied to SLP using LVTC / NFA2X 2x16mm2 and distributed to houses use 2x10mm2 LVTC / NFA2X cables. The measured
load on the transformer is 252 Ampere (OverBlast). On the existing network there are 121 consumers with an average power of
450VA (2 Ampere).
In the existing network there are 6 electric poles, namely pal T1-121 / 11, T1-121 / 11A, T1-121 / 11B, T1-121 / 11C, T1-121 / 12,
and T1-121 / 13 with a distance approximately 40-50 meters. On pal T1-121 / 11 there are 3 external service channel pulls tapped
directly from the low voltage network pole with a total of 9 outside service channels. On pal T1-121 / 11A there are 3 pulls. Outside
service channels are tapped directly from the low voltage network pole with a total of 7 outside service channels. On pal T1-121 /
11B there are 3 pulls. Outside service channels are tapped directly from the low voltage network pole with a total of 7 outside service
channels. On pal T1-121 / 11C there are 4 pulls. Outside service channels are tapped directly from the low voltage network pole
 This publication is licensed under Creative Commons Attribution CC BY.
http://dx.doi.org/10.29322/IJSRP.11.06.2021.p11439 www.ijsrp.org
International Journal of Scientific and Research Publications, Volume 11, Issue 6, June 2021 301
ISSN 2250-3153
with a total of 58 outside service channels. On pal T1-121 / 12, there are 5 pulls. Outside service channels are tapped directly from
the low voltage network pole with a total of 15 outside service channels. On pal T1-121 / 13 there are 5 pulls. The outside service
channel is tapped directly from the low voltage network pole
With a total of 25 outside service channels

 RUMAH KONSUMEN SAMPLING TEGANGAN

 : OVERLOAD 106% KAPASITAS
 RUMAH KONSUMEN TENAGA LISTRIK

 I
 : MORAWA 50 KVA
 TARIKAN SR EKSISTING
 PAL LISTRIK EKSISTING

 JTM 1 FASA EKSISTING

 JUMLAH PELANGGAN : 121 RUMAH
 TRAFO EKSISTING
 SKUR EKSISTING
 JTR EKSISTING

 H
 KONDISI TRAFO
 :
 :
 :
 :
 :
 :
 :
 :

 DATA TRAFO
 KETERANGAN :

 LVTC DX 2X16
 G
 JALAN BATURSARI IV

 F
 E
 JALAN BATURSARI III

 D
 DESA BRUMBUNG KAB. DEMAK
 GAMBAR JTR EKSISTING

 T1-121/11C
 C
 4
 JALAN BATURSARI II

 T1-121/11B
 3

 B
 T1-121/11A
 A
 2

 LVTC 2X35 + N25
 T1-121/12

 1 T1-121/11
 50 KVA
 T1-121/11
 T1-121/13
 JL. BATUR SARI RAYA MRANGGEN

 JALAN BATURSARI IX
 U

 Figure 1 Image of Existing Network

2.4 Existing Network Data of Case Study Sites
 In calculating both the power loss calculation and the voltage drop calculation, it is important to know the connected power
data for each house in the case study location. The connected power data as samples for each of these houses can be seen in the
following table.
 Table 1 House Connected Power
 Power
 No Customer ID House Code
 Connected (VA)
 1. 523082975871 1 450
 2. 523082975895 2 450
 3. 523082975894 3 450
 4. 523082975893 4 450
 5. 523082975892 D 450
 6. 523082975879 E 900
 7. 523082975845 F 450
 8. 523082975812 G 450
 9. 523082975803 H 450
 10. 523082975804 I 450

 In addition to the connected power, it is also necessary to conduct research related to the service voltage to consumers in the
existing network. The service voltage measurement was carried out on May 5, 2020. After obtaining permission from the local RT
head, a study was conducted at the case study location by measuring the service voltage at peak load times, which is between 19.00
WIB and outside peak load at 12.00 WIB. The following table 2 shows the results of the measurement of service voltage in the 10
sample houses in the case study locations.

 Table 2 Voltage Measurement Results
 Voltage at
 Voltage at
 No Customer ID outside the Peak
 Peak Load
 Load
 1. 1 223 Volt 224 Volt
 2. 2 221 Volt 223 Volt
 This publication is licensed under Creative Commons Attribution CC BY.
http://dx.doi.org/10.29322/IJSRP.11.06.2021.p11439 www.ijsrp.org
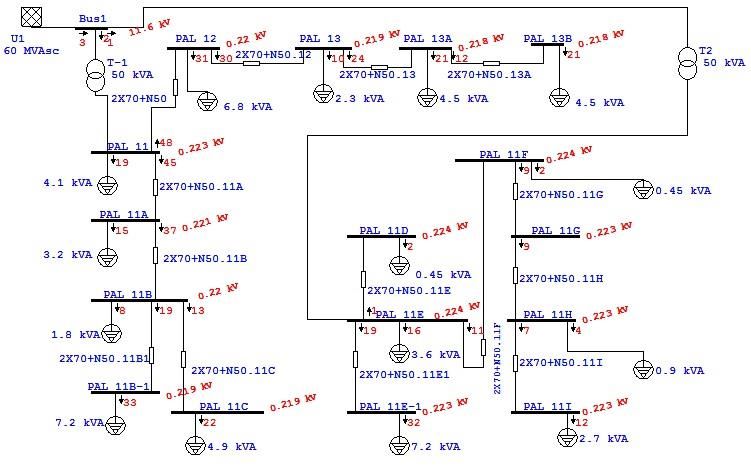
International Journal of Scientific and Research Publications, Volume 11, Issue 6, June 2021 302
ISSN 2250-3153
 3. 3 217 Volt 216 Volt
 4. 4 193 Volt 197 Volt
 5. D 183 Volt 192 Volt
 6. E 179 Volt 186 Volt
 7. F 168 Volt 183 Volt
 8. G 163 Volt 180 Volt
 9. H 156 Volt 175 Volt
 10. I 154 Volt 173 Volt

2.5 Modeling of Existing Network Circuits
 From Figure 1 regarding the condition of the existing network, circuit modeling can be made to make it easier to simulate the
measurement of voltage drop and electrical power losses through calculation formulas or through simulation calculations with the
ETAP program.

 Figure 2 Existing Network Circuit Modeling

 III. Result and Analysis

3.1 Arrangement of Line of Customer Home Connections
 This arrangement of house connections (SR) for the customer line is the main point in the repair plan at the case study
location. The SR series arrangement is depicted with a red line according to Figure 4.3 below. This SR series arrangement is in
accordance with the standards set by PLN that one JTR pole with a maximum of five customer service connections and one
customer service connection can be connected in series with a maximum of five customers, as in Figure 3.That way, voltage drops
and losses will be obtained on the connection house that fits the standard.

 This publication is licensed under Creative Commons Attribution CC BY.
http://dx.doi.org/10.29322/IJSRP.11.06.2021.p11439 www.ijsrp.org
International Journal of Scientific and Research Publications, Volume 11, Issue 6, June 2021 303
ISSN 2250-3153

 RUMAH KONSUMEN TENAGA LISTRIK

 I
 TARIKAN SR EKSISTING
 TARIKAN SR RENCANA
 PAL LISTRIK EKSISTING

 JTM 1 FASA EKSISTING
 PAL LISTRIK RENCANA

 JTM 1 FASA RENCANA

 T1-121/11I
 TRAFO EKSISTING
 TRAFO RENCANA

 SKUR EKSISTING
 SKUR RENCANA
 JTR EKSISTING
 JTR RENCANA

 T1-121/11H
 H
 :
 :
 :
 :
 :
 :
 :
 :
 :
 :
 :
 :
 :
 KETERANGAN :

 T1-121/11G
 T1-121/11F
 G
 JALAN BATURSARI IV

 F
 T1-121/11E-1

 E

 T1-121/11E
 JALAN BATURSARI III

 GAMBAR JTR SETELAH REKONFIGURASI

 D
 DESA BRUMBUNG KAB. DEMAK

 T1-121/11D
 T1-121/11C-1

 T1-121/11C
 4
 JALAN BATURSARI II

 3
 T1-121/11B
 2

 T1-121/11A
 T1-121/12

 1 T1-121/11
 T1-121/13

 JL. BATUR SARI RAYA MRANGGEN
 T1-121/13A
 JALAN BATURSARI IX
 U

 T1-121/13B

 Figure 3 Kondisi Jaringan Setelah Rekonfigurasi

3.2 Feasibility Study for Network Reconfiguration Using ETAP Simulation
 Feasibility Study on Voltage Drop
 The simulations of the feasibility of service voltages using ETAP 12.6.0 software are the same as the ETAP software
simulations carried out previously on the existing network of case study locations. The method of drawing poles and buses will also
be carried out the same as the simulation of the existing network. The loading factor is assumed to be the same as the loading when
the stress measurement is carried out at the case study location. So that with the same loading model, the network repair plan can
be known for the voltage drop.

 Figure 4 Service Voltage After Reconfiguration with ETAP Simulation
 From the simulation results above, a voltage table can be made in each house along with the percentage of voltage drop
generated in the network repair plan. For the percentage of voltage drop, it is obtained from a formula such as calculating the
percentage of voltage drop in the previous existing network, namely

∆V(%) = Vs - Vr x 100%
 Vs

 This publication is licensed under Creative Commons Attribution CC BY.
http://dx.doi.org/10.29322/IJSRP.11.06.2021.p11439 www.ijsrp.org
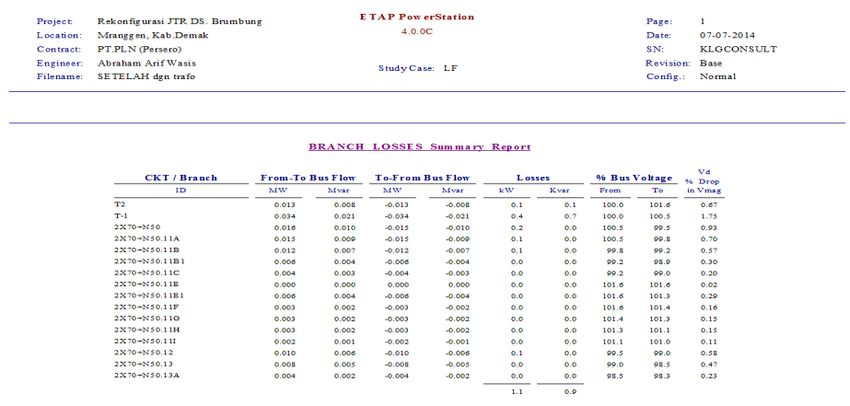
International Journal of Scientific and Research Publications, Volume 11, Issue 6, June 2021 304
ISSN 2250-3153
 Table 3 Home Voltage ETAP Simulation results
 Voltage Drop
 Voltage
 No House Code Percentage
 (Volt)
 (%)
 1. 1 223 0,8
 2. 2 221 1,7
 3. 3 220 2,2
 4. 4 219 2,6
 5. D 224 0,4
 6. E 224 0,4
 7. F 224 0,4
 8. G 223 0,8
 9. H 223 0,8
 10. I 223 0,8

3.3 Feasibility Study on Shrinkage
 The power loss feasibility study uses the same method as the voltage drop feasibility study above. The power loss feasibility
study uses a simulation with ETAP 12.6 software with data in accordance with the network reconfiguration that has been planned
in the previous section. The following are the results of the power loss simulation using ETAP 12.6 software:

 Figure 5 Power Loss Calculation Using the ETAP 12.6.0 Application

From the results of the power loss calculations on ETAP 12.6 according to Figure 4.5 above, it is known that the total power loss
in the network after reconfiguration is 1,100 Watts. However, because the author does not discuss transformer losses, the
shrinkage will only be 600 Watt, because it is reduced by 500 Watt transformer losses. If used as a percentage, the percentage of
power loss in the network regardless of transformer losses is 1.3%.

 Table 4 Comparison of Total Power Loss
 No. Power Loss Power Loss After
 Before Reconfiguration Reconfiguration
 1. 3.900 Watt 8,3 % 600 Watt. 1,3 %

It can be seen in Table 4, after reconfiguring the network, the amount of power loss has decreased to 1.3% and has met the
applicable standards.

 IV. CONCLUSION

 This publication is licensed under Creative Commons Attribution CC BY.
http://dx.doi.org/10.29322/IJSRP.11.06.2021.p11439 www.ijsrp.org
International Journal of Scientific and Research Publications, Volume 11, Issue 6, June 2021 305
ISSN 2250-3153
 Before the network reconfiguration was carried out, the magnitude of the voltage drop in Brumbung Village was 0.8% -
31.5% and the power loss was 8%, this was not in accordance with the standards set by PT PLN (Persero).
 Planning for network reconfiguration in Brumbung Village includes the addition of 10 new poles to get consumers closer
to the voltage source, enlarging the size of the network cable, expanding the 1-phase Medium Voltage Network, adding a 50KVA
1-phase distribution transformer, and reconfiguring Home Connections.
 After reconfiguring the network, the magnitude of the voltage drop according to the ETAP simulation, the voltage drop is
0.4% - 2.6% and the power loss is 1.1%, these results are in accordance with SPLN No.1: 1995 for a maximum voltage drop of 10%
and SPLN 72 : 1987 for power losses (losses) a maximum of 3.5%.

 REFERENCES
[1] Anonim. 1992. Standard Konstruksi Jaringan Distribusi Di Lingkungan Perusahaan Listrik Negara, Buku saku. Jakarta:
 PT. PLN (Persero).
 [2] Anonim. 2006. Perhitungan Losses. Jakarta: Pusdiklat PT. PLN (Persero).
 [3] Anonim. 2009. Materi Prajabatan Bidang Distribusi : Desain Kriteria Jaringan Distribusi. Jakarta : Pusdiklat PT. PLN
 (Persero).
 [4] Anonim. 2010. Buku 1 : Kriteria Desain Enjiniring Konstruksi Jaringan Distribusi Tenaga Listrik . PT. PLN (Persero): Jakarta.
 [5] Anonim. 2010. Buku 2 : Standar Konstruksi Sambungan Tenaga Listrik . PT. PLN (Persero): Jakarta.
 [6] Anonim. 2010. Buku 3 : Standar Konstruksi Jaringan Tegangan Rendah Tenaga Listrik . PT. PLN (Persero): Jakarta.
 [7] Kurniasih, Aisa Indra. 2013. Perencanaan Perbaikan Jaringan Dengan Perhitungan Losses Dan Simulasi Software Etap 7.5.0
 Pada Sambungan Rumah Tidak Standar Di Perumahan Tlogosari Semarang ”. Laporan Penelitian. Program Studi Diploma
 III Teknik Elektro Universitas Diponegoro Semarang.
 [8] Siregar. 2011. Study Perbaikan Faktor Daya Pada Sistem Radial 20 KV Analisis Menggunakan Etap. Laporan Penelitian.
 Jurusan Teknik Elektro Universitas Sumatra Utara.
 [9] Suartika, Made. 2010. Rekonfigurasi Jaringan Tegangan Rendah (JTR) Untuk Memperbaiki Drop Tegangan Di Daerah
 Banjar Tulangnyuh Klungkung. Jurnal Teknologi Elektro, Volume 9, Nomor 2. Bali:Universitas Udayana.
 [10] Sukmawidjaja, Maula. 2008. Perhitungan Profil Tegangan Pada Sistem Distribusi Menggunakan Matrix Admitansi Dan
 Matrix Impedansi Bus. Jurnal Teknik Elektro, Volume 7, Nomor 2, Jakarta : Universitas Trisakti.
 [11] SPLN 56-1. 1993. Sambungan Listrik Tegangan Rendah (SLTR). Jakarta : Departemen Pertambangan dan Energi Perusahaan
 Umum Listrik Negara.
 [12] SPLN 72. 1987. Spesifikasi Desain Untuk Jaringan Tegangan Menengah dan Jaringan tegangan Rendah. Jakarta :
 Departemen Pertambangan dan Energi Perusahaan Umum Listrik Negara.
 [13] SPLN 56. 1984. Sambungan Listrik. Jakarta : Departemen Pertambangan dan Energi Perusahaan Umum Listrik Negara.
 [14] SPLN 74. 1987. Standar Listrik Pedesaan. Jakarta : Departemen Pertambangan dan Energi Perusahaan Umum Listrik Negara.
 [15] SPLN 42. 1993. Kabel Pilin Udara Tegangan Pengenal 0,6/1KV (NFA2X-T/NFA2X/NF2X). Jakarta : Departemen
 Pertambangan dan Energi Perusahaan Umum Listrik Negara.
 [16] SPLN 1. 1995. Tegangan-Tegangan Standar. Jakarta : Departemen Pertambangan dan Energi Perusahaan Umum Listrik
 Negara.
 [17] Wardoyo, Julian Ardi. 2013. Studi Tentang Perencanaan Pembangunan Penyulang Pati 11 Untuk Memperbaiki Keandalan
 Jaringan Distribusi 20 KV Pati 1 Berdasarkan Kajian Kelayakan Operasi. Laporan Penelitian. Jurusan Teknik Elektro
 Politeknik Negeri Semarang.

 This publication is licensed under Creative Commons Attribution CC BY.
http://dx.doi.org/10.29322/IJSRP.11.06.2021.p11439 www.ijsrp.org
You can also read