Satellite observations of the space shuttle's main engine exhaust plume: Unexpected global-scale transport and polar mesospheric cloud formation ...
←
→
Page content transcription
If your browser does not render page correctly, please read the page content below
Satellite observations of the space shuttle’s main engine exhaust plume:
      Unexpected global-scale transport and polar mesospheric cloud formation

                                             Michael H. Stevens
                                           Space Science Division
                                          Naval Research Laboratory

GMU SSS 19 Mar 2013                                                               1 of 38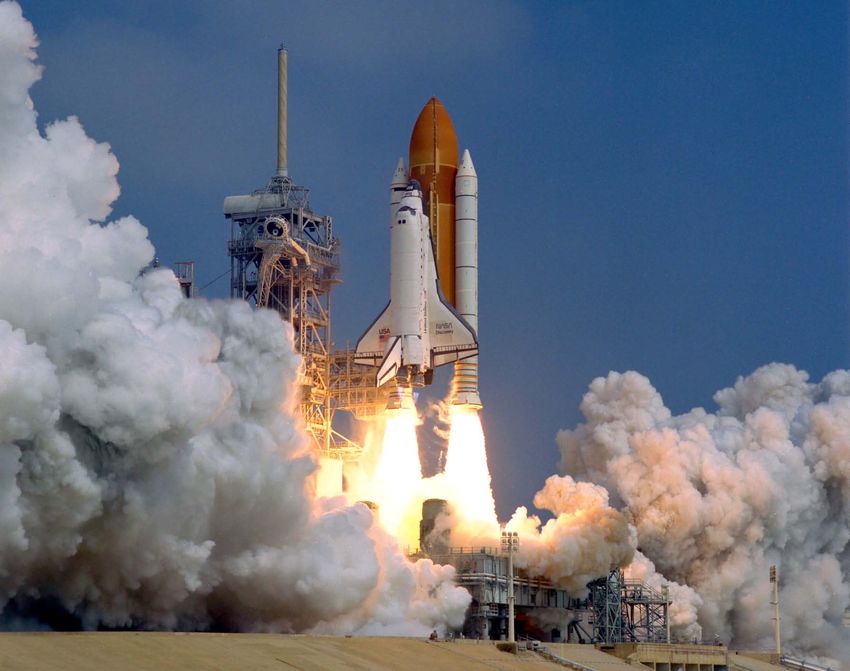
Many thanks to:
                      Stefan Lossow (Karlsruhe Institute of Technology)
                                   Robert R. Meier (GMU)
                               John Plane (Leeds University)

GMU SSS 19 Mar 2013                                                       2 of 38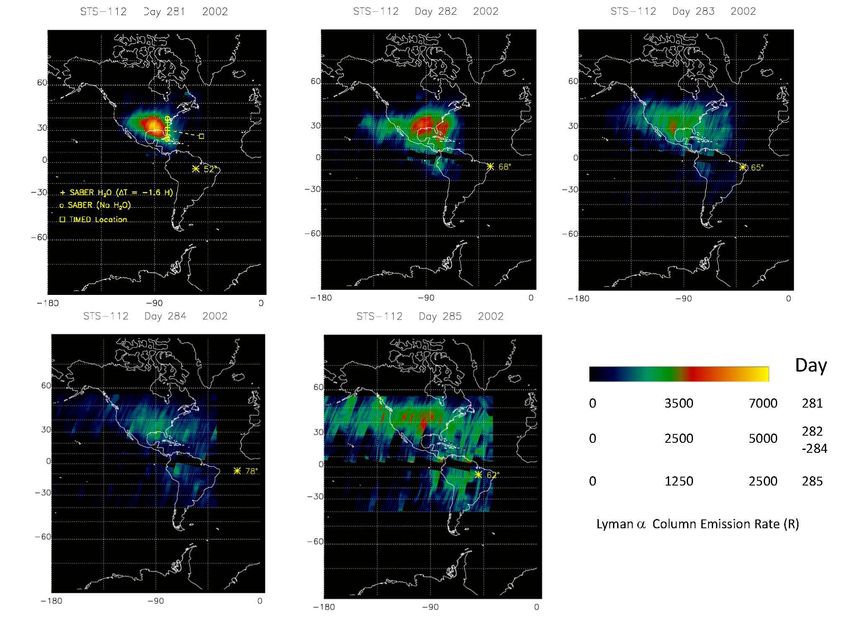
Outline
1) What are Polar Mesospheric Clouds and why should I care?
2) PMCs from the space shuttle’s main engine exhaust
3) Global-Scale Plume Transport and Diffusion
4) Summary and Future Work

GMU SSS 19 Mar 2013                                    3 of 38
1) What are Polar Mesospheric Clouds and why should I
     care?

GMU SSS 19 Mar 2013                                       4 of 38
Temperature Profile of the Earth’s Atmosphere

Polar Mesospheric Clouds
  (Noctilucent Clouds)
      Observed Here

GMU SSS 19 Mar 2013                                              5 of 38
Polar Mesospheric (Noctilucent) Clouds
Logan, UT (41.7° N)
June 22-23, 1999
Mike Taylor
• Normally appear in the polar summer mesosphere between 80-90 km
in the coldest part of the Earth’s atmosphere (130 K).
Composed of water ice and very sensitive to changes in their formation
environment (i.e. T, H2O).
First reported in 1885 but no record of them before this.
GMU SSS 19 Mar 2013 6 of 38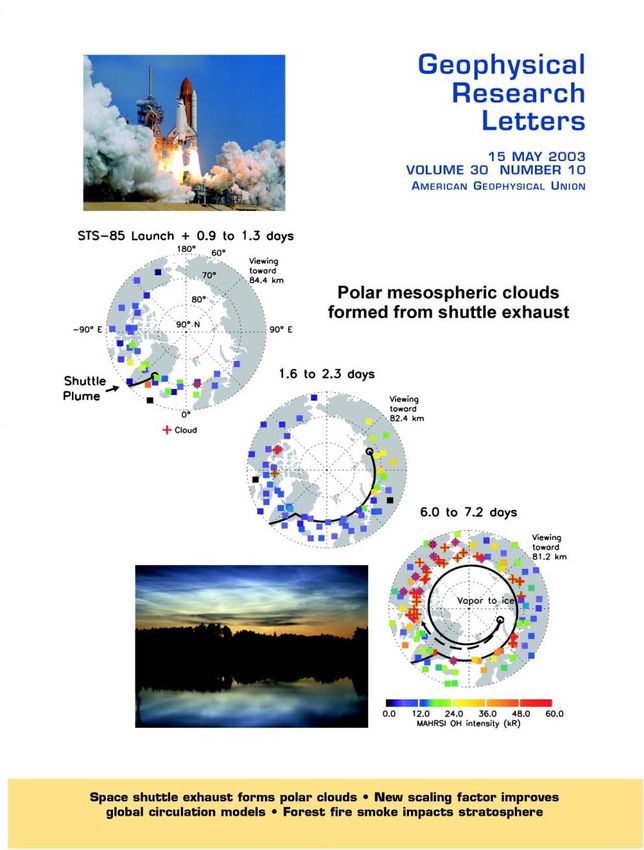
First Sighting of a Noctilucent Cloud

    Leslie, R., Nature, 32, 245, 1885 (16 July)

  Take home points:
  • NLCs distinguished by height (83 km).
  • Leslie gets credit for first sighting: First to publish.
  • Backhouse saw clouds earlier and often gets credit.
  • First sighting follows Krakatau eruption in May, 1883.
  • 8 days submission to print!
GMU SSS 19 Mar 2013                                            7 of 38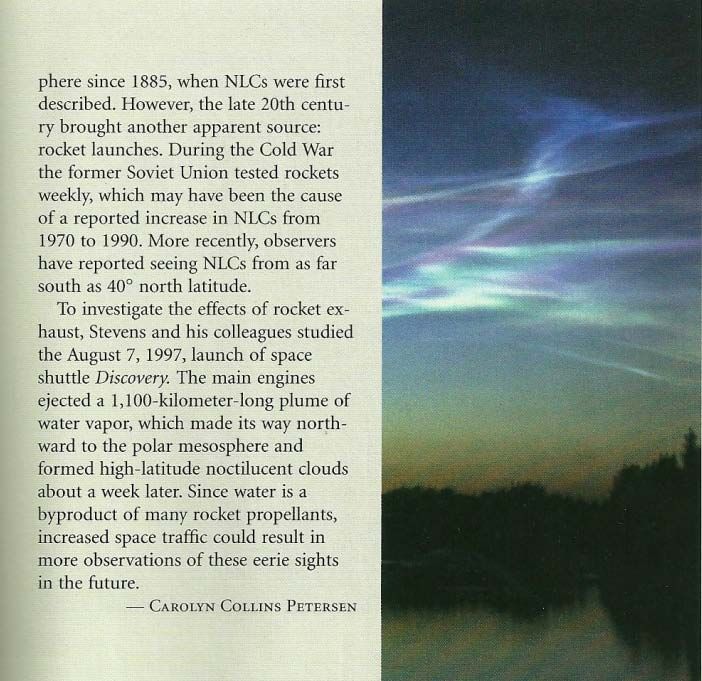
Historical Record of Annual NLC Observations
          Nights of NLC Observations

                                                             Fogle and Haurwitz [1973]

                                         Krakatau

       • NLCs were not observed before 1885
       • Apparent increase in NLCs in late 20th century until late 1960s.
GMU SSS 19 Mar 2013                                                                      8 of 38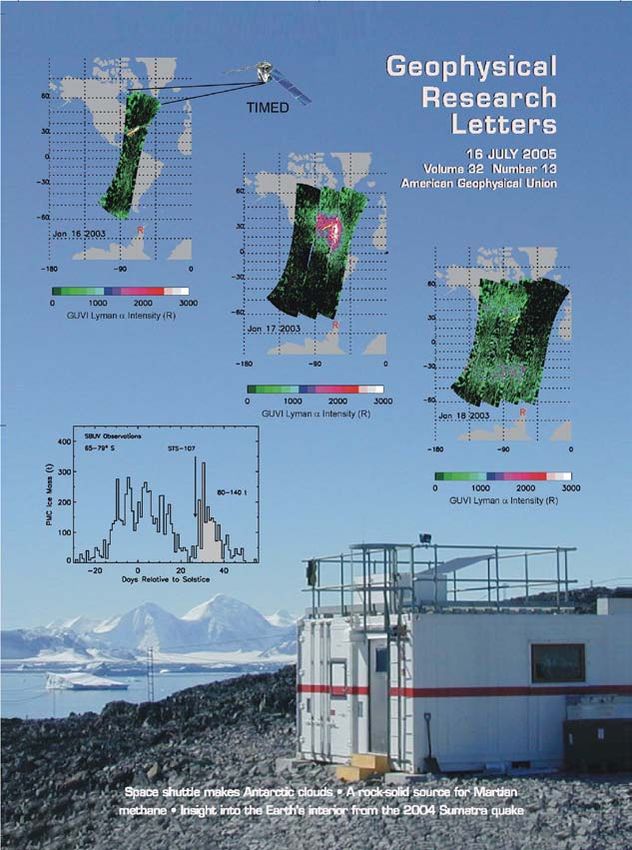
Is There a PMC/NLC Trend Since 1979?

                           54-64° N

• Solar cycle variation evident in all datasets.
• Reported Solar Backscatter UltraViolet (SBUV) PMC frequency trend is 1%/year [in
  black, Shettle et al., 2009].
• NLC trend for bright clouds (red: Kirkwood et al., 2008) not statistically significant.
• Weaker NLC trend (blue) may be due to improved observing techniques.
GMU SSS 19 Mar 2013                                                                9 of 38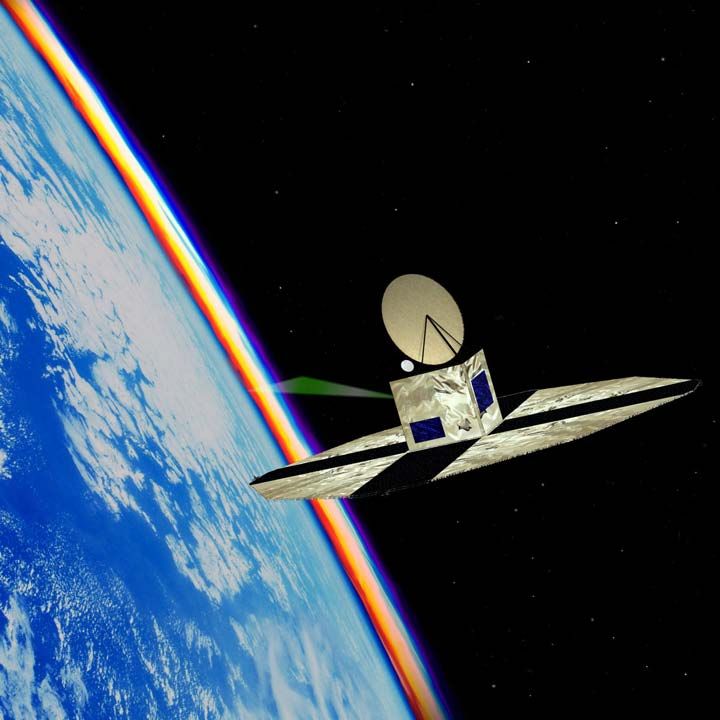
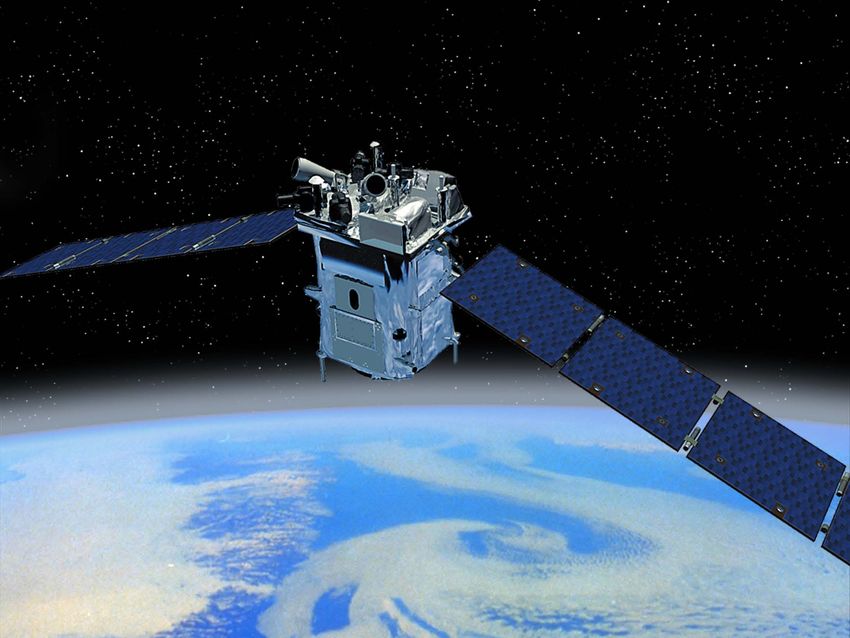
Are they indicators of climate change?

                                         Launched by NASA in 2007
                                        Goal: Why do PMCs form and
                                              why do they vary?
GMU SSS 19 Mar 2013                                            10 of 38
2) PMCs from the space shuttle’s main engine exhaust GMU SSS 19 Mar 2013 11 of 38
Temperature Profile of the Earth’s Atmosphere

       About 50% (300 t) of
      shuttle’s main engine
      exhaust injected here

 Polar Mesospheric Clouds
       Observed Here

GMU SSS 19 Mar 2013                                              12 of 38
700 t of Exhaust Available in External Tank at Launch GMU SSS 19 Mar 2013 13 of 38
Meier et al. (2011)

                 • 300 t H2O injected between 100-115 km altitude
                 • Solid rocket boosters released at ~40 km
                 • STS-107 has unusual profile because it did not go to the ISS
GMU SSS 19 Mar 2013                                                               14 of 38
Main Engine Shuttle Exhaust Injected off U.S. East Coast Previous studies considered effects of exhaust products between: • 300-400 km [e.g. Mendillo et al., 1988; Bernhardt et al., 2005] • 10-60 km [e.g. Jackman et al., 1998; Ross et al., 2004] • Here we consider the fate of 300 t of H2O in a narrow altitude region 100-115 km. GMU SSS 19 Mar 2013 15 of 38
Arctic PMCs from Shuttle Main Engine Exhaust

                                       • NRL’s Middle Atmosphere High
                                         Resolution Spectrograph Investigation
                                         (MAHRSI) measured OH solar resonance
                                         fluorescence in the upper atmosphere
                                         following launch of STS-85. OH is a proxy
                                         for H2O.

                                       • Bright OH intensities are observed in the
                                         Arctic 1-2 days after launch.

                                       • Late-season (14-AUG) PMCs are observed
                                         over North America a week after launch.

                                       • The amount of water in these PMCs is
                                         consistent with the amount in the shuttle
                                         plume.

               Stevens et al. [2003]
GMU SSS 19 Mar 2013                                                           16 of 38
SBUV data show shuttle PMCs can contribute
20% to a northern season of clouds
• Burst of PMCs following launch of STS-93 in July, 1999.
• Amount of ice in burst consistent with amount in shuttle plume [Stevens et al., 2005a]
GMU SSS 19 Mar 2013 18 of 38Antarctic PMCs from Shuttle Main Engine Exhaust
• TIMED/GUVI instrument images STS-107
plume by imaging H Lyman-α, created
from photodissociated H2O.
• Plume travels rapidly toward Antarctica
(44 m/s) in two days.
• Iron ablated by main engines observed
by lidar in Antarctica three days after
launch at 68 S.
• Burst of Antarctic PMCs subsequently
observed:10-20% of PMC mass for
season.
“We conclude that the evidence for an
important contribution to PMCs by shuttle
traffic calls into question any interpretation
of late 20th century PMC trends solely in
terms of global climate change.”
Stevens et al. (2005b)
GMU SSS 19 Mar 2013 19 of 38Summary of Shuttle Contribution to PMCs
• Reported PMC frequency trends are ~1%/year since 1979.
NLC trends for bright clouds not statistically significant since 1964.
• One shuttle main engine plume can produce 10-20% of PMCs for one
PMC season in either the Arctic or Antarctic. The shuttle operated
between 1981-2011.
• The shuttle’s contribution to any PMC trend or to inter-annual
variability is therefore potentially large, even ignoring the
contribution from all other space traffic.
GMU SSS 19 Mar 2013 20 of 383) Global-Scale Plume Transport and Diffusion GMU SSS 19 Mar 2013 21 of 38
Thermosphere
Ionosphere
                              SEE
Mesosphere
Energetics and
Dynamics                                         TIDI
satellite
(TIMED)

            SABER

                                              GUVI

• Launched December 7, 2001
• 630 km altitude, 74.1 deg inclination, 98 min period
• SABER scans limb at 10 wavelengths, including 6.8 µm for H2O
• Can detect H2O from shuttle plume in lower thermosphere
•GMU
  Observations
     SSS 19 Mar 2013
                     can yield insight to plume transport and vertical diffusion
                                                                             22 of 38
SABER Shuttle Plume Detections
• Shuttle plume detections based on avg. H2O
radiance profiles.
• Detection algorithm:
• Plumes exceed 4-sigma threshold
• Outliers above 94 km
• Must be two sequential outliers 2 km apart
GMU SSS 19 Mar 2013 23 of 38• Launched February 20, 2001
• Polar, sun-synchronous, near-terminator orbit at ~600 km altitude
• SMR scans limb at frequencies between 486 GHz and 581 GHz
• Can detect H2O from shuttle plume in lower thermosphere at 557
GHz
• Observations can yield insight to plume transport and vertical
diffusion
SMR
OSIRIS
GMU SSS 19 Mar 2013
Odin 24 of 38SMR Shuttle Plume Detections
• Day of Year 241 (29 Aug 2009)
• ~8 hrs after launch of STS-128 on same day
• Water vapor profiles subtracted from climatological average
• Residual plume scans are 3σ above geophysical variation
GMU SSS 19 Mar 2013 25 of 38Satellite Plume Observations
SABER SMR
By locating shuttle plumes this way we can quantify both the bulk transport
and the horizontal spreading.
GMU SSS 19 Mar 2013 26 of 38Launch Local Time Can Influence Direction of Motion All observations
Meridional Plume Transport vs. Model Results

                  STS-107 (Jan, 2003)

                      Plume observed 81 hrs later…

         -180         -100       0        100   180    -180   -100    0       100   180
                                Lon.                                 Lon.

General Circulation Model (GCM)                       GCM winds x 4 extend meridional
horizontal winds [Liu, 2007] cannot move              transport [Liu, 2007].
a shuttle plume on global-scale.

         Fast transport underestimated in GCM models. Something is missing.

GMU SSS 19 Mar 2013                                                                     28 of 38
Summarizing Observed Bulk Plume Transport • Launch local time plays a role in the direction and speed of transport. • Observed transport faster than GCM derived winds by factor of four or more. • Adjusting TIME-GCM tidal amplitudes upward to match observations yields meridional motion that can be consistent with plume observations [Liu, 2007; Yue and Liu, 2010]. GMU SSS 19 Mar 2013 29 of 38
Can models reproduce the
                      horizontal diffusion of the plume?

GMU SSS 19 Mar 2013                                        30 of 38
Thermosphere
Ionosphere SEE
Mesosphere
Energetics and TIDI
Dynamics
satellite
(TIMED)
SABER
GUVI
• GUVI observes H Lyman-α in the nadir.
• H Lyman-α created from photodissociation of shuttle H2O plume.
• Nadir images yield insight to horizontal diffusion of H.
GMU SSS 19 Mar 2013 31 of 38GUVI Observations
STS-112 Plume
Launch + 18 h Launch + 42 h Launch + 67 h
Max Width
~16,000 km
Launch + 91 h Launch + 115 h
Meier et al. (2011)Comparing Plume Width
against 2D Model
GUVI STS-107
• Center to Edge of Plume
Model width
• at τ = 0.1
Model width
• at 1/e of center column density
Meier et al. (2011)
Model/data agreement using
model width at τ=0.1 but only for first
few hours of plume evolutionDoes the shuttle plume diffuse
“anomalously”?
Suggested dependence:
r (t) = C1t3/2
r = plume radius (m)
t = time (s)
C1 = constant
GMU SSS 19 Mar 2013 34 of 38Spreading of Space Shuttle Plume
• Plume spreading faster than molecular diffusion would indicate but
not as fast as proposed by Kelley et al. [2009]
• Spreading is 20° latitude in less than a day and comparable to bulk
motion.
GMU SSS 19 Mar 2013 35 of 38Summary for Horizontal Plume Spreading • Molecular diffusion alone can generally explain horizontal spreading of atomic hydrogen (H) for first few hours of plume evolution, but model cannot simulate H beyond that. • Water vapor (H2O) observations by SMR and SABER up to 24 hours from launch indicate faster spreading than from molecular diffusion alone. • The combination of rapid bulk motion of H2O for daytime launches and rapid horizontal spreading gets the plume to the polar summer in less than a day. GMU SSS 19 Mar 2013 36 of 38
Summary
• Reported late-20th century PMC trends are
  ~1%/year or less.
• One shuttle launch can contribute 10-20% to
  a season of PMCs in Arctic or Antarctic.
• Rapid bulk plume transport is
  underpredicted by GCM winds by a factor of
  four or more.
• Molecular diffusion can reproduce plume
  spreading in first few hours, but a faster
  process dominates after that.
 • The combination of rapid bulk transport and
     rapid horizontal spreading can get the
     plume to the Arctic summer in less than a
     day.
GMU SSS 19 Mar 2013                              37 of 38
Future Work… • What types of waves are responsible for fast poleward transport of shuttle plumes? • How does the H2O at ~105 km get to ~80 km altitude to form clouds in the polar summer? Role of eddy diffusion? • What are the implications to chemistry and thermal balance within the plume? • What is the long term contribution to PMC trends and/or PMC inter-annual variability due to space traffic? GMU SSS 19 Mar 2013 38 of 38
You can also read