INSAR OBSERVATIONS OF NEW ZEALAND DEFORMATION: PAST, PRESENT AND FUTURE - IAN HAMLING, SIGRÚN HREINSDÓTTIR, LAURA WALLACE, NICO FOURNIER AND ...
←
→
Page content transcription
If your browser does not render page correctly, please read the page content below
InSAR observations of New Zealand
        Deformation: Past, Present and Future

Ian Hamling, Sigrún Hreinsdóttir, Laura Wallace, Nico Fournier and
others

                                                                     GNS Science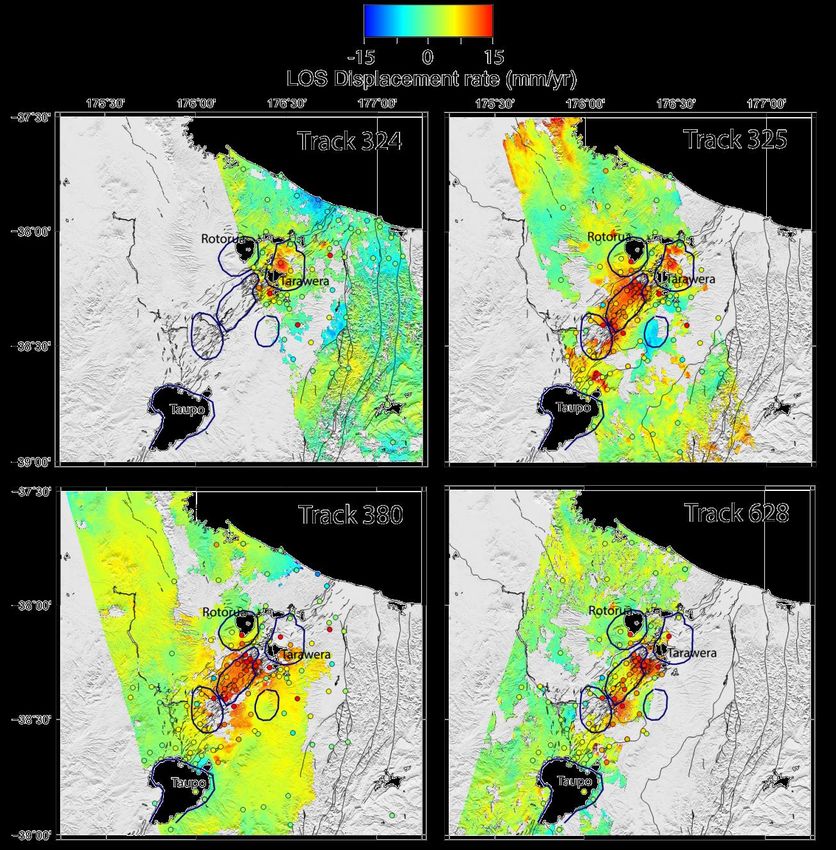
Outline:
• Satellite Radar Interferometry: the basics

• InSAR observations over New Zealand
  – 2013 Lake Grassmere earthquake
  – 2004 Manawatu Slow Slip Event
  – Subsidence along the Taupo Volcanic Zone

• Error considerations, new and future
  missions.

• Conclusions

                                               GNS Science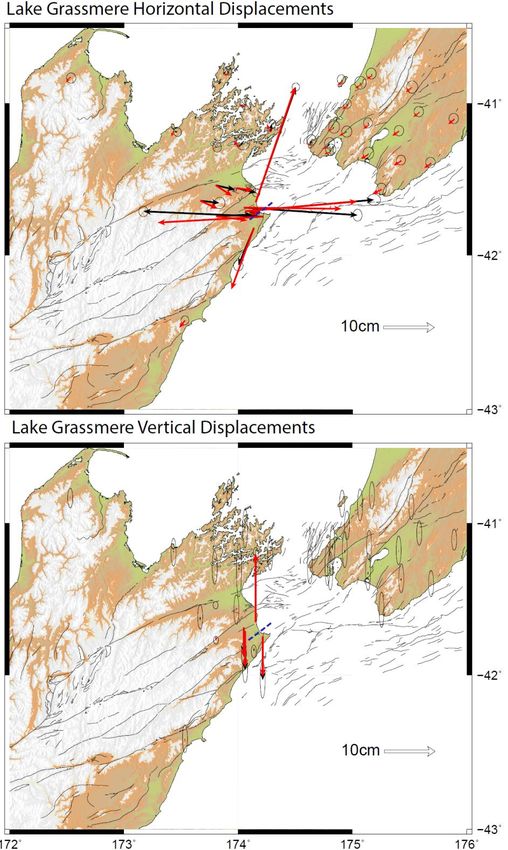
InSAR – how it works
The phase of the radar signal is the number of cycles of oscillation that the
wave executes between the radar and the surface and back again.
                    The total phase is two-way range measured in wave
                    cycles + random component from the surface

                     Round trip ~ 30 million wavelengths, BUT we don’t know
                     the exact number

                     For each pixel the collection of random path lengths
                     jumbles the phase of the echo – solved by
                     interferometry
780 km

                                                                            GNS Science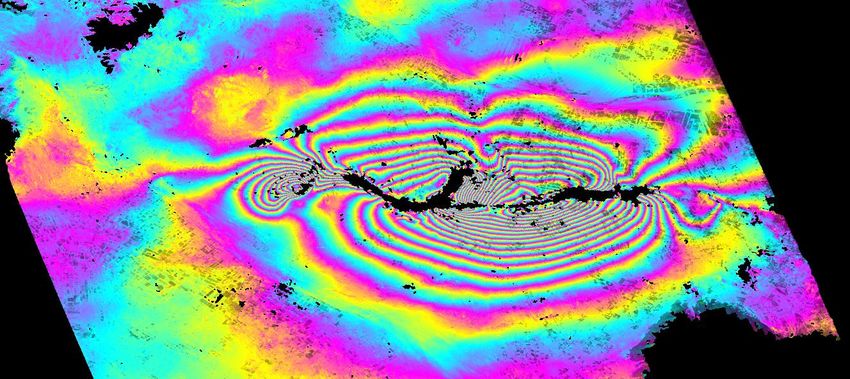
InSAR – how it works
Two radar images taken at times t1 and t2

                                            GNS Science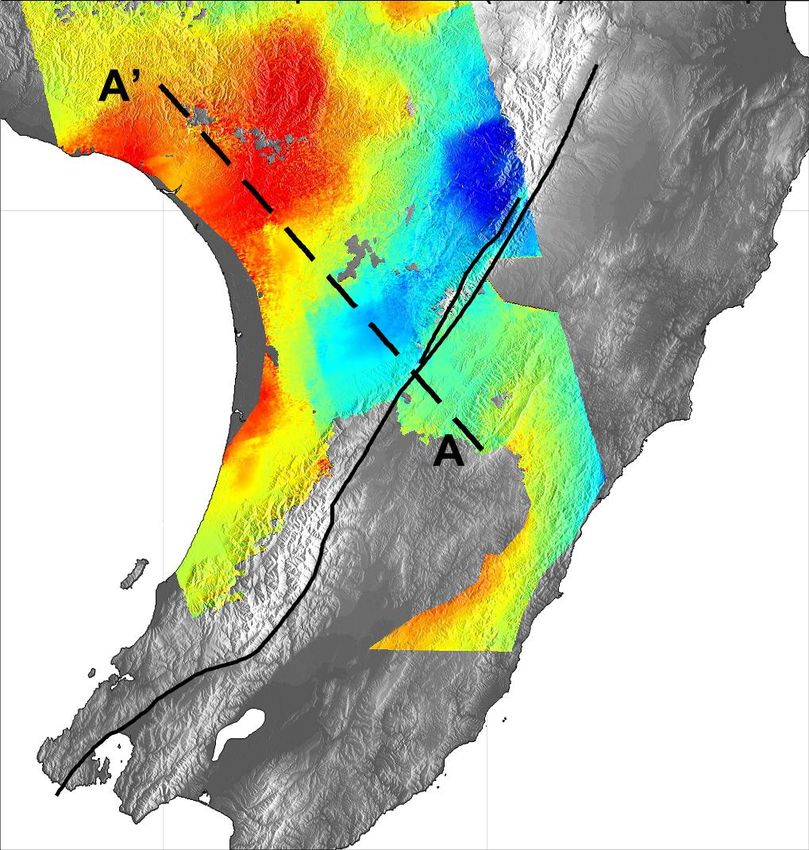
InSAR – how it works
Another two radar images taken at times t1 and t2 (after an earthquake)

                                                                          GNS Science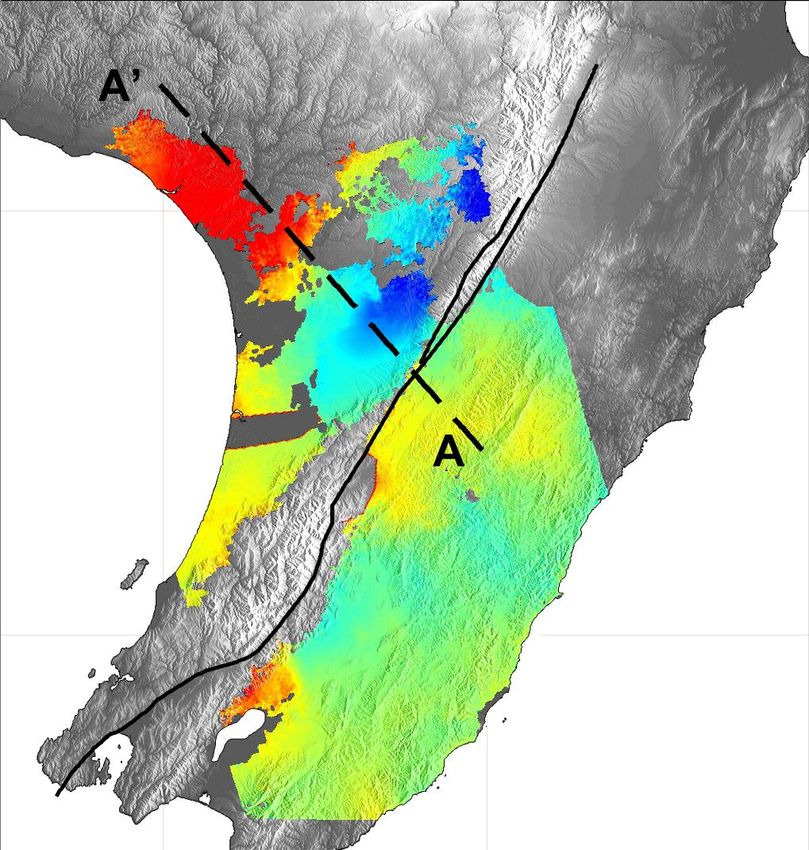
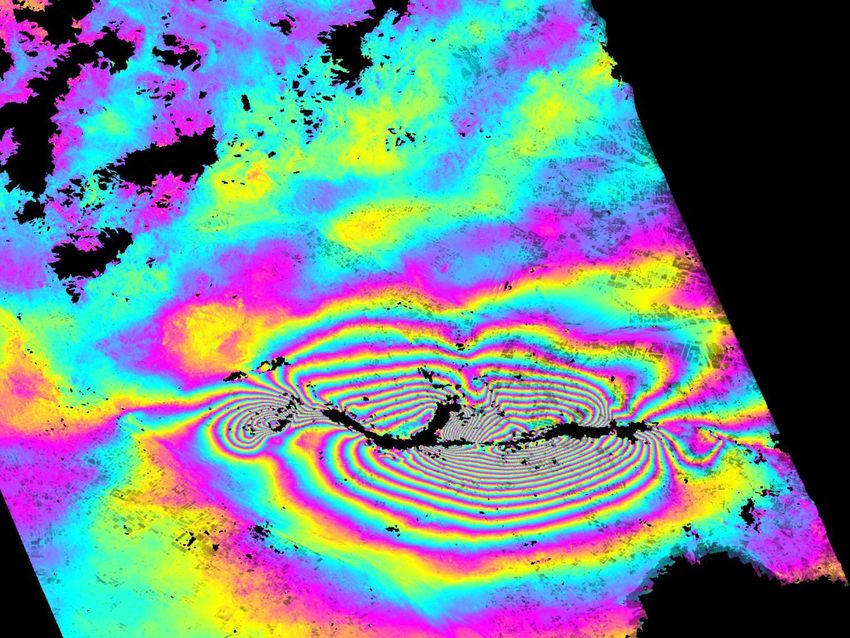
2010 Darfield Earthquake

                                                         9 (103.5 cm)

                                                         6 (69 cm)

                                                         1 (11.5 cm)

                                                         0 (0 cm)

ALOS interferogram 13th August – 28th September
Each fringe represents 11.5 cm (half a wavelength) of motion towards or away from the satellite.
                                                                                       GNS Science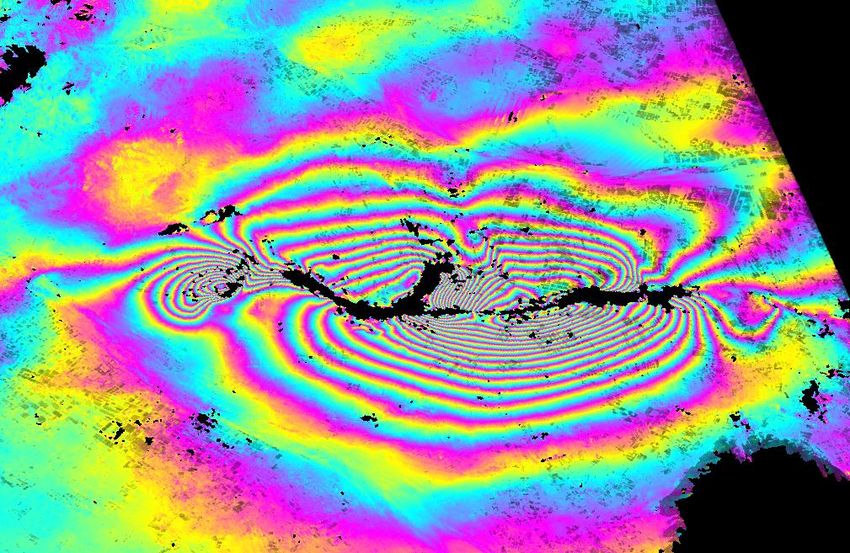
InSAR observations over New Zealand
  2013 Lake Grassmere earthquake

                                      GNS Science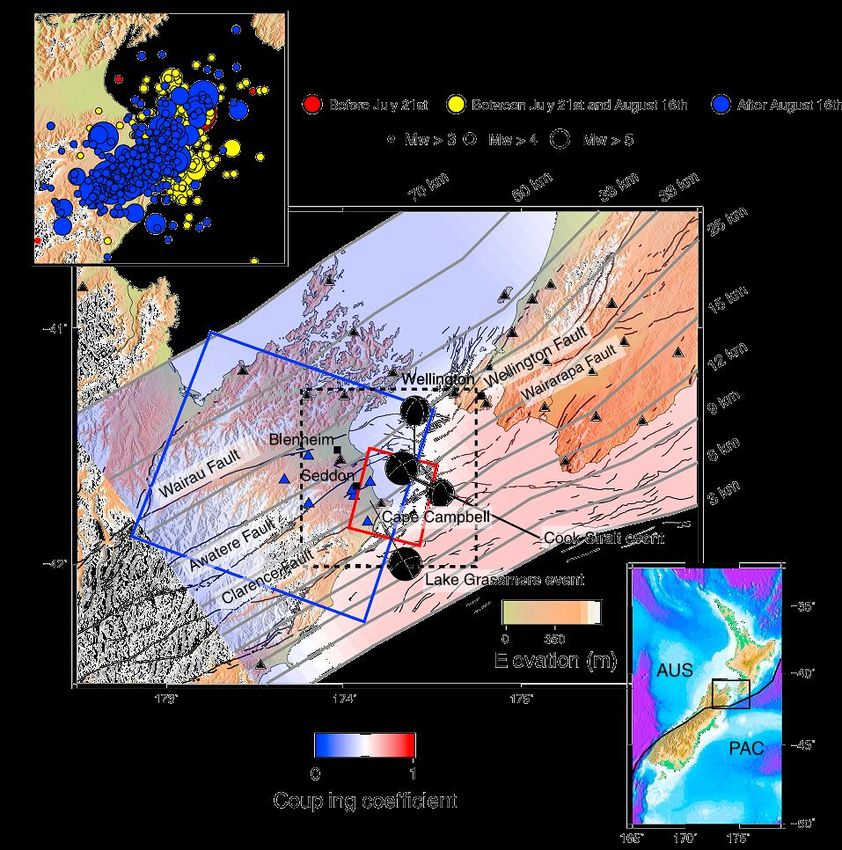
Cook Strait and Lake
Grassmere Earthquakes
•   Sequence began with 2
    foreshocks with Mw 5.7 and 5.8.

•   Mw 6.6 Cook Strait event
    occurred on 21st July and was
    followed by > 2500 Mw 2+
    earthquakes

•   16th August a second Mw 6.6
    event occurred beneath Lake
    Grassmere.

                                      GNS Science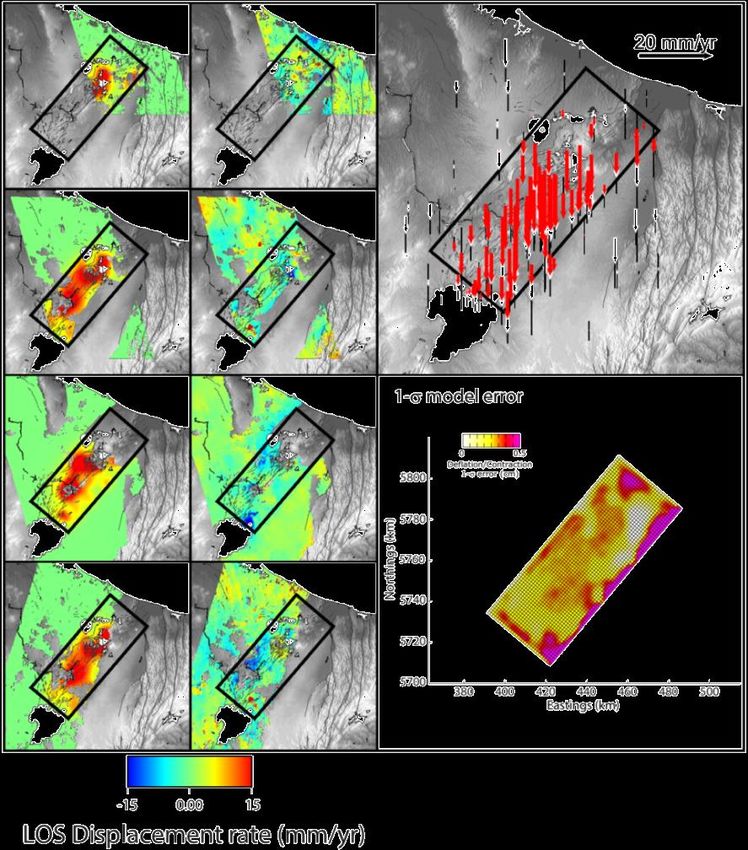
Lake Grassmere event

 Up to 26 cm of eastward and 15 cm uplift at
 campaign GPS near Lake Grassmere

 InSAR shows up to 25 cm of LOS change at
 Cape Campbell

                                               GNS Science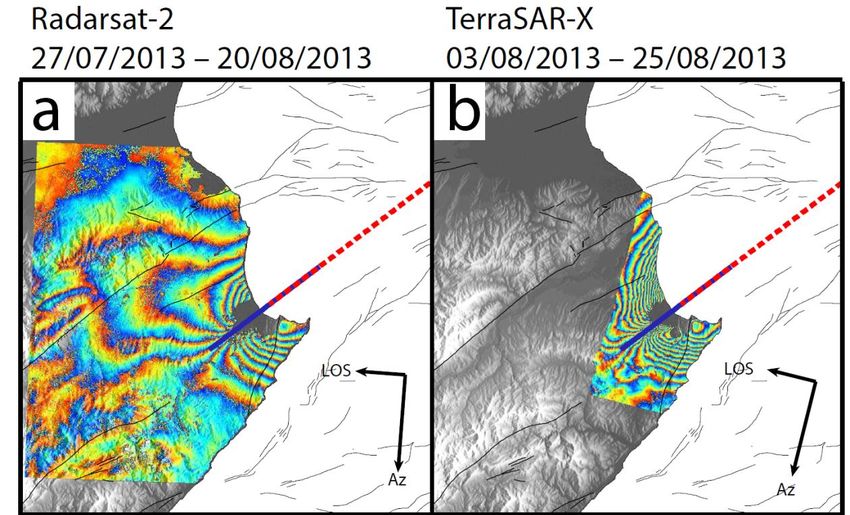
Lake Grassmere event

                       GNS Science
InSAR observations over New Zealand
2004 Manawatu Slow Slip Event
GNS ScienceSlow Slip Events
• SSEs have been
observed on many
subduction
margins including
Japan, Cascadia,
New Zealand and
Mexico
• In most regions
displacements are
too small to
observe with
InSAR.
Schwartz et al. 2007
GNS ScienceDeep Hikurangi SSEs
• Deep (25–60 km)
slow slip is observed
adjacent to the
deeply locked
portion of the
Hikurangi
subduction thrust
• These deep SSEs
last 1–1.5 years,
release moment
equivalent to
Mw ∼7.0, and occur
approximately every
5 years.. Wallace et al. 2012
GNS ScienceThe 2004 Manawatu SSE
• Began in February 2004 and
lasted until June 2005
• Largest offsets recorded at
TAKP with up to 40 mm of
uplift and eastward motion.
GNS ScienceData availability
15/10/2003-06/07/2005 03/11/2004-19/10/2005
GNS ScienceSubsidence
Uplift
GNS ScienceImplications
• The 1855 Wairarapa earthquake is
thought to have initiated on the
subducting slab before “jumping” onto
overlying fault.
• Stress analysis suggests that a rupture of
the deep portion of the margin would
promote failure of an event on the
Wellington fault.
GNS ScienceInSAR observations over New Zealand
Subsidence along the TVZ
GNS ScienceThe ups and downs of the TVZ: Geodetic observations of ground
deformation along the Taupo Volcanic Zone Ian Hamling, Sigrún Hreinsdóttir, Nico Fournier
Using ~80 interferograms across 4
satellite tracks we solve for best fitting
displacement rate for each pixel.
Displacement
Time
GNS ScienceThe ups and downs of the TVZ: Geodetic observations of ground
deformation along the Taupo Volcanic Zone Ian Hamling, Sigrún Hreinsdóttir, Nico Fournier
InSAR and GPS show up to 25 mm/yr
of subsidence along the length of the
TVZ between 2003 and 2011.
Up to 50 mm/yr of subsidence at
Wairakei geothermal field.
GNS ScienceThe ups and downs of the TVZ: Geodetic observations of ground
deformation along the Taupo Volcanic Zone
Assuming cooling of rhyolitic melt (2200 km/m3) into
granite (2700 kg/m3) would result in a ~20% volume
reduction.
Best fitting model suggests cooling and contraction of
~0.1 km3 of ryholite at 6 km depth
GNS ScienceWhat strain rate can we resolve from InSAR?
GNS ScienceHow do we achieve 1 mm/100km/yr??
Error Considerations
2 2
geom 2
topo 2
atmos 2
coh 2
sys 2
unw
• Orbital errors lead to long wavelength
ramps across scene - can mask
interseismic signals
• Can be removed by tying to GPS on
ground
• Should be minimal with new satellites with
more tightly controlled GPS orbits
GNS ScienceError Considerations
2 2
geom 2
topo 2
atmos 2
coh 2
sys 2
unw
B
topo dem
Rslant sin
Absolute σdem for SRTM in New Zealand ~ 5 m, 2.5 m of which is not
spatially correlated.
Bperp σtopo (40˚incidence)
50 m 0.5 mm
500 m 5 mm
1500 m 16 mm
GNS ScienceError Considerations
2 2
geom 2
topo 2
atmos 2
coh 2
sys 2
unw
Large source of error caused by distribution of water
vapour in the troposphere
Can be corrected using weather models but these
can introduce additional error.
Typically 25 mm over 100 km wavelength but can be
larger.
GNS ScienceError Considerations
2 2
geom 2
topo 2
atmos 2
coh 2
sys 2
unw
• Biggest source of noise is due to changing ground surface
• Worse at short wavelengths but can be averaged by multilooking
• Coherence is convenient measure
Im
Dfint
Re
GNS ScienceHow do we achieve 1 mm/100km/yr??
• Need to combine lots of observations in
timeseries analysis, stacking is not enough!
Perpendicular Baseline
Permanent Scatterers
Short Baseline Subsets (SBAS) Stacking
Time
• Assuming perfect coherence
Wright, Fringe 2011
(unlikely), need at least 5 years
of observations.
• New missions should make this
achievable in the future but it will
take some time.
Wright, Fringe 2011
GNS ScienceInSAR Current and future missions:
• TerraSAR-X and TanDEM-X launched in 2007 and
2010 .
• X-Band mission with resolutions varying from 0.25
– 40 m, revisit time of 11 days.
• Mission will be continued with TerraSAR-X2.
JAXA lauched ALOS-2 (L- 250 km
Band) earlier this year.
Started releasing data 25th ESA’s Sentinel-1a mission began data
November. dissemination in early October. Will
provide radar data over NZ every 6-12
days.
Radarsat-2 launched in Artiste's concept of the Nisar satellite. Courtesy NASA
2007 NASA plan an L-Band/S-Band
mission in 2020: NISAR
GNS ScienceConclusions
• Despite issues with decorrelation from
vegetation, InSAR observations of surface
deformation at a range of wavelengths is
possible in New Zealand.
• New missions will provide acquisitions every
~12 days with a potential latency of ~8 hours.
• With regular, long term acquisitions (5+ years), it
should be possible to measure velocity
gradients of 1 mm/yr/100km
GNS ScienceStress transfer onto overlying faults
• At base of fault (25-30 km) stresses are > 0.075 Mpa
• 95% of slip > 1 cm slip falls in regions where the coulomb stress change is >
0.01 Mpa.
GNS ScienceSide-Looking Airborne Radar
~l/L
e.g. l = 0.05 m
W = 10 m
~ 0.005 radians
If at 800 km height,
along-track footprint
~ 4 km
GNS ScienceSide-Looking Airborne Radar
Points on the ground can
only be resolved if they
are not within the same
beamwidth
So ...
Ra = sλ/L
Where s is the slant range
from the antenna to the
scattering point on the
ground.
Therefore for a satellite
where s ~850 km and L =
10 m the azimuthal
resolution is ~4 km!
How do we get 20 m
resolution?
GNS ScienceTrick – the Synthetic Aperture
All the radar echoes
that illuminate a given
patch of ground are
used to construct a
synthetic larger
antenna
Point Q is illuminated
throughout time
interval t1-t3. Distance
travelled over this
time is equal to beam
width of real aperture
radar.
GNS ScienceSynthetic Aperture Radar (SAR)
• Phase of a wave is invariant with
reference frame. As a result, the
frequency in a moving frame must
adjust to compensate for relative
velocity
• SAR makes use of measurements of
the range and Doppler shift of the radar
returns to locate ground points. The
signals from many returns are analysed
together to image ground elements
~5x20m in size, much smaller than
would be possible with a stationary
antenna of the same size - hence the
Synthetic Aperture.
GNS ScienceYou can also read