Separation of Continental Europe Synchronous Area on 8 January 2021 - Janusz Bialek Professor of Power and Energy Systems Newcastle University and ...
←
→
Page content transcription
If your browser does not render page correctly, please read the page content below

Separation of Continental Europe
 Synchronous Area on 8 January
              2021
                    Janusz Bialek
        Professor of Power and Energy Systems
          Newcastle University and Skoltech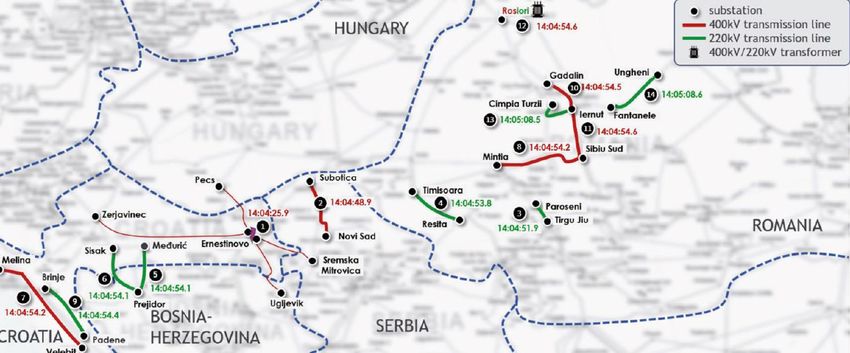
Outline

 • Description of the event
     • A trip of the busbar coupler in SS
       Ernestinovo (Croatia) triggered a cascade
       of line trips ending with a network split
 • Unanswered questions
 • Comparison with 2006 system separation

ENTSOE: “Continental Europe Synchronous Area Separation on 8 January 2021. Interim
Report” 26 Feb 2021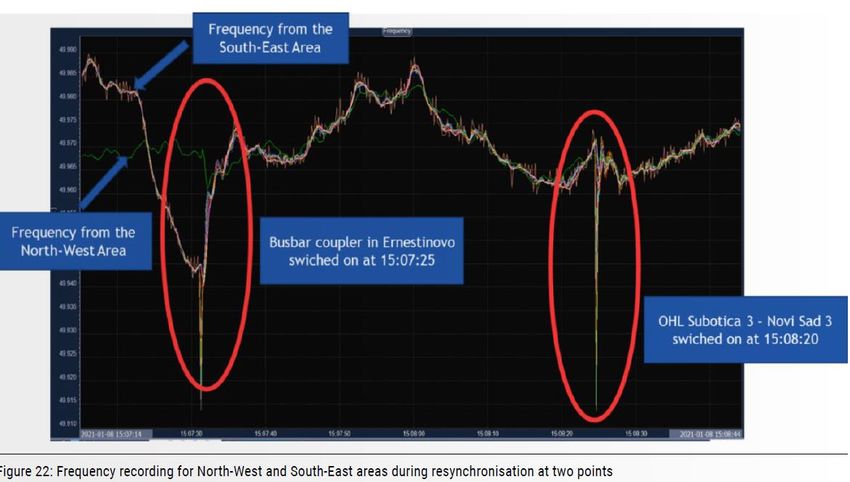
System conditions on 8 January 2021
• Slightly unusual loading situation:
    • low demand in the South due to warm weather and Orthodox
      holidays
    • higher demand in Central/Western Europe due to cold weather
    • Strong South->North power flows: 6.3 GW
• But not big differences (apart from ES–PT and CZ–PL) between day-
  ahead and realised market schedules (top)
• There were differences between scheduled and measured power
  flows (bottom) – but they were not abnormal and to be expected
• No unplanned unavailability of production units
• No planned maintenance works or unplanned outages in the network
    • grid topology was mapped correctly in the network models used
• In summary: nothing highly unusual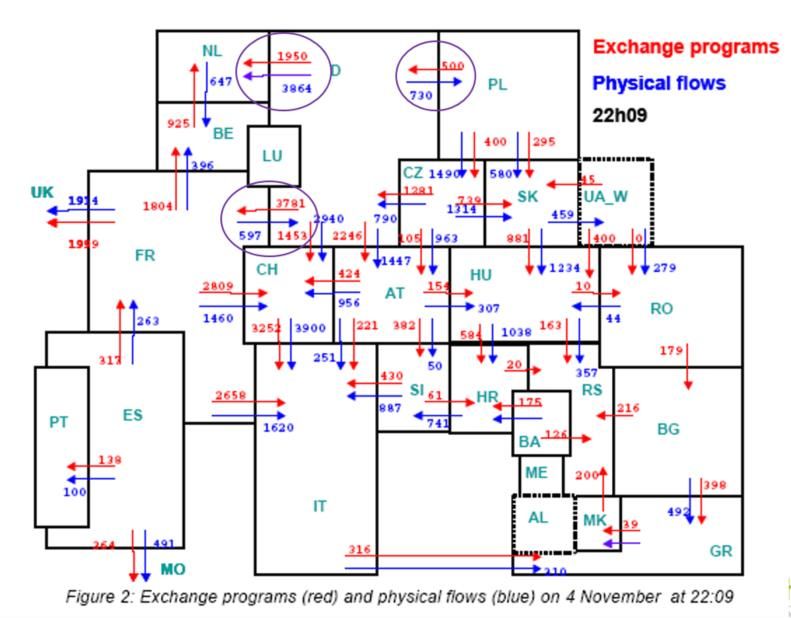
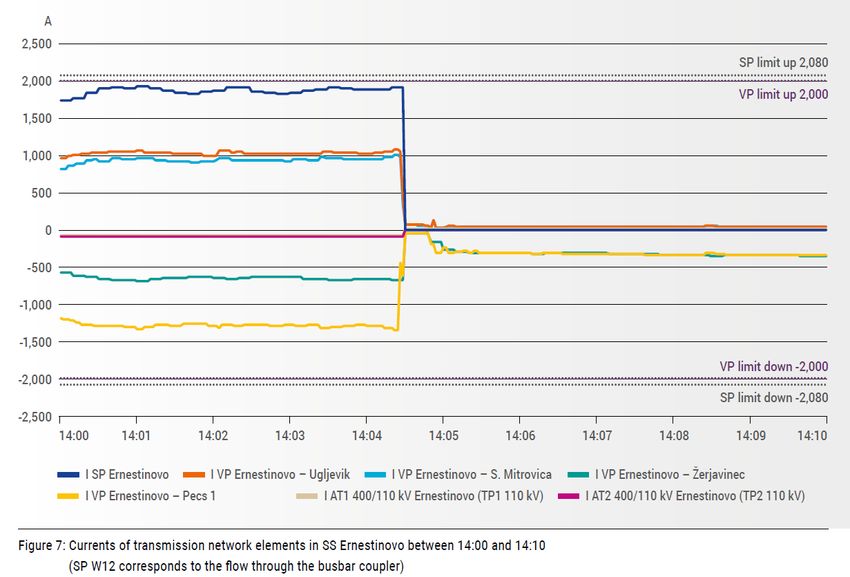
Croatian network
• The cascade was initiated by a busbar coupler trip in
  SS Ernestinovo
• (N-1) security analysis every minute using SCADA
• Good match between forecasted Intra-Day Congestion
  Forecast (ICDF) values and actual power flows in
  SS Ernestinovo
• A mismatch of only 100 MW (150 A) on the
  flow of the busbar coupler (vs the limit of 2080 A)
• The tripping of the busbar coupler was not
  included as a possible event in the n-1 contingency
  simulations
• Guideline on electricity transmission system operation
  (called ‘SOGL’) stipulates that it is up to individual
  System Operators to consider a trip of a busbar
  coupler in (N-1) security analysis
Busbar coupler trip in
  SS Ernestinovo

• The current was near the limit of
  2080 A
    • So the system was only
      marginally (N-0) secure!
    • Not clear why it was allowed if
      the flows were close to the
      predicted ones
• Busbar coupler trips at 14:04 on
  overcurrent protection
• Tripping of two 400/110 kV transformers and a separation of the two busbars in SS Ernestinovo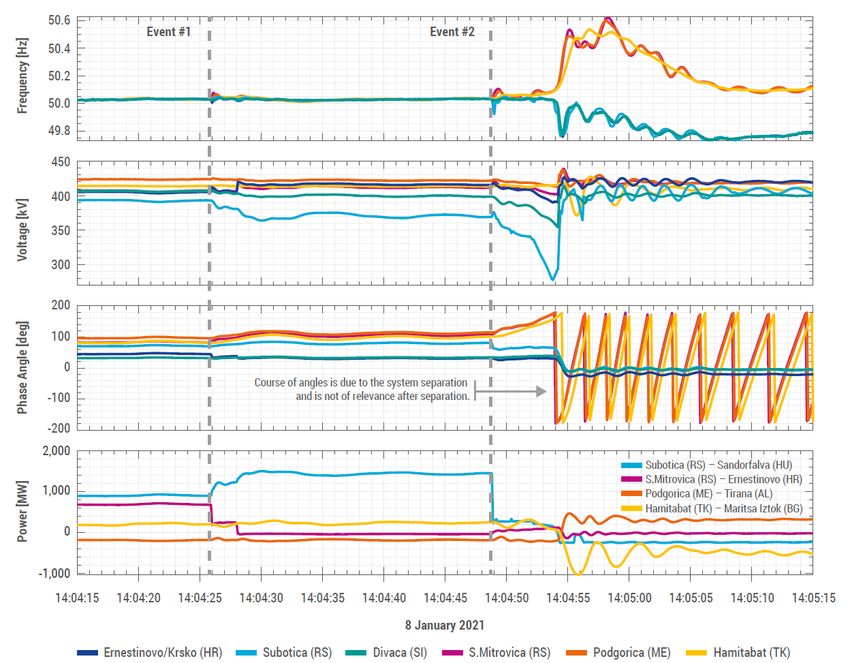
• A shift in power flows in neighbouring
  transmission lines.
• Cascaded trips of transmission lines on
  distance, out-of-step and power swing
  protection
• The CE power system splits up into two areas
  over approximately 20 seconds.
Trip of the
                                                                 Busbar         Subotica-Novi Sad
                                                                 coupler trip
        PMU recordings                                                          transmission line

• The system was already operating close to angular
  instability with voltage phase angle differences of close to
  90 degrees between Western Europe (Switzerland) and
  Eastern Europe.
    • Not clear why was it allowed to happen
• Event #1 already had a visible impact on the overall system
  stability. The small oscillations stabilised before the
  overload of the second element
• After event#2, the entire system reached the “point of no
  return” and the two areas started to separate from each
  other due to angular instability.
• Power deficit in the North-West (frequency drop) and
  power surplus in the South-East (frequency rise)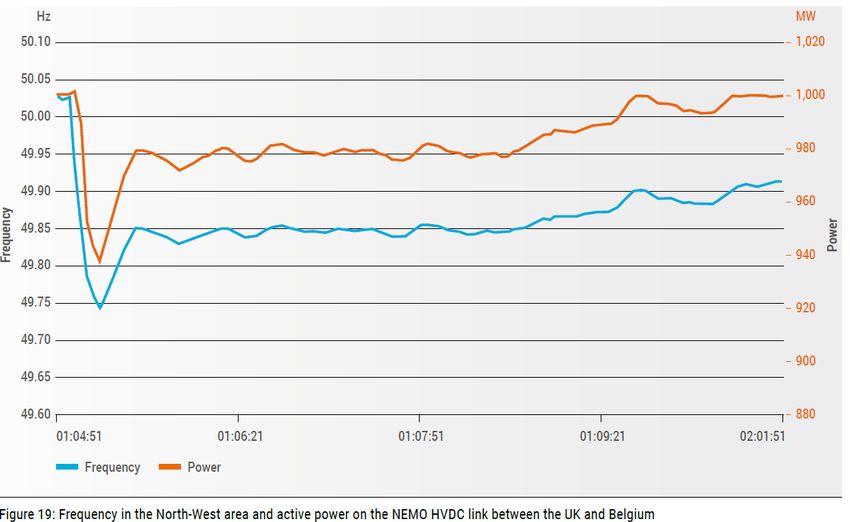
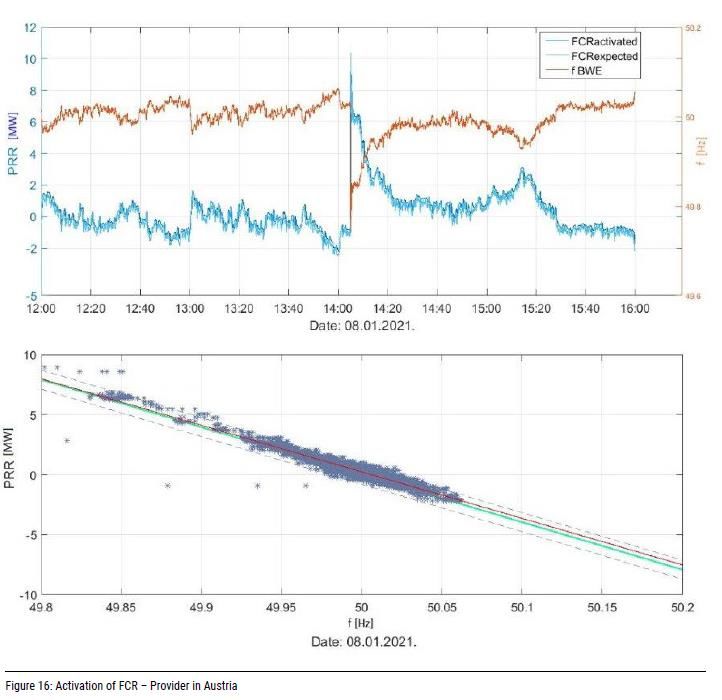
Frequency response: activation of frequency containment
     reserves (FCR)
• All generation units which participated in the primary
  control either decreased (South-East) or increased (North-
  West) their power generation
• By exceeding the 200 mHz limit, a high number of
  generation units changed their control mode to emergency
  control
    • activating additional reserves in the North-West area
    • decreasing their generation in the South-East area.
• Example of a provider in Austria – a nearly perfect droop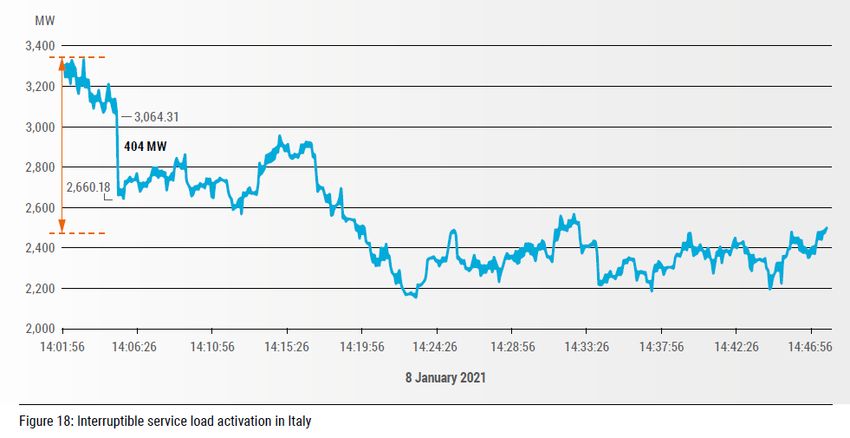
Activation of interruptible
loads in North-West

• Power deficit of 6.3 GW
• Shedding of 1.7 GW of automatic
  interruptible load in France and Italy
Disconnection of generation units or loads close to the
separation line
• Due to the high transients of voltage and frequency, a significant number of generation units and
  industrial or domestic loads were disconnected in both areas
• South-East:
    • approximately 1 GW of generation connected to the transmission system and 60 MW connected
      to the distribution system
    • 233 MW of the load tripped - mainly close to the separation line
• North-West:
    • 348 MW of generation tripped.
    • The total load disconnected was 70 MW:
         • 36 MW was located close to the separation line and disconnected due to extreme transients.
         • 34 MW tripped due to incorrect protection device settings
Disconnection of non-conforming generation units or
transmission elements
• South-East:
• Because of the over-frequency (in excess of 300 mHz), tripping of about 833 MW of non-conforming
dispersed generation connected to the transmission system and 687 MW embedded in the distribution
system
• North-West:
• several automatic disconnections took place, even very far from the system separation line, due to frequency
deviations outside the normal operation range of +/- 200 mHz.
• Due to incorrect protection settings, another 296 MW of generation tripped far from the separation line and
only based on the resulting 250 mHz frequency drop.
• Distributed generation with non-conforming disconnection settings (49.8 Hz) with a total of 295 MW
• The loss of the HVDC link between Santa Llogaia (Spain) and Baixas (France) occurred due to an erroneous
protection parametrisation of the auxiliary sources for a frequency threshold of 49.75 Hz.Support from other synchronous areas over HVDC links • The North-West area received 535 MW from the Nordic synchronous area and 60 MW from Great Britain.
Resynchronisation
Unanswered questions

• Large-scale involuntary load shedding was avoided due
  to interruptible loads, but why did a split happen in the
  first place?
• The loading situation was unusual but the predicted
  and realised market schedules were close
• Why was the system close to angular instability even
  before the coupler trip?
• Why was the system only marginally (N-0) secure as the
  busbar coupler current was close to the limit?
• Why wasn’t a trip of the busbar coupler deemed not
  dangerous so it was not included in (N-1) security analysis?
Comparison with 2006 system separation in Europe
                               • 15M households affected, 17.7 GW
                                 load shed
                               • Why did a disturbance in Northern
                                 Germany black out customers in
                                 Portugal, Spain and Italy?
Timeline • EON agrees to disconnect a 380 kV line in North Germany to let a ship pass – a routine request • The day before the event, the shipyard requests to bring forward disconnection by 3 hours • EON agrees but does not modify Day Ahead Congestion Forecast (DACF) distributed to all TSOs • Stronger than forecasted wind on the day, big differences between predicted and actual power flows
Timeline
• EON concludes empirically, without doing (N-1) analysis, that the outage would be still (N-1)
  secure (it wasn’t!)
• Disconnecting the line results in high power flows
• EON assess the situation empirically, without simulations (again!), and decides to couple a
  busbar in Landesbergen substation to reduce a line current by 80 A
• Result: the current increases by 67 A and the line trips
• Cascading line tripping resulting in separation into 3 regions with different frequencies
10 GW surplus
                                                                                                        51.4 Hz

• Western zone: 8.9 GW deficit
    • Drop of frequency caused tripping of 10.7 GW of
      generation
    • 60% of wind plants tripped (due to f < 49 Hz)
    • 30% of CHP tripped
                                                                          8.9 GW deficit
    • 16.7 GW load shed
                                                                          49 Hz
• North-Eastern zone: 10 GW surplus                                                                  0.8 GW deficit
                                                                                                     49.7 Hz
    • Initial rise of frequency halted by automatic
      frequency control and tripping of frequency-sensitive generation (mainly wind – 6.2 GW tripped)
    • As frequency started to drop, windmills started to reconnect automatically worsening the situation
• South East: 0.8 GW deficit
    • No load shedding activated
    • Subsystem (N-1) secure
Comparison between the 2006 and 2021 incidents
• Root causes of 2006 outage
• Operational mistakes by EON
• Lack of coordination between TSOs
• Lack of operational awareness of the external situation
• Significant changes have been implemented since 2006 to improve coordination and operational awareness: ENTSO-E
Awareness System (EAS)
• Similarities between the incidents:
• It was the busbar coupler that initiated the cascades: manual merging in 2006, automatic splitting in 2021
• North-South system separation along similar lines
• Differences
• Poor match in 2006, and a reasonably good match in 2021, between the predicted and actual power flows
• Smaller deficit (6.7 GW) of the West in 2021 than in 2006 (8.9 GW)
• Far less shedding of DG
• No large-scale involuntary load shedding in 2021 due to a lower deficit and automatic disconnection of
interruptible loadsSummary • A busbar coupler trip caused a system separation • It was (N-1) event but it had not been included in (N-1) security analysis • Involuntary load shedding was avoided due to activation of 1.7 GW of interruptible load shedding • Unanswered questions • Some similarity to a 2006 event - busbar coupler did it!
You can also read