Environmental Product Declaration - Vitro Minerals
←
→
Page content transcription
If your browser does not render page correctly, please read the page content below
Environmental Product Declaration
This document is a product-specific Type III Environmental Product Declaration (EPD) for thee Ground Glass Pozzolans
produced from E-glass at Vitro Minerals’ Jackson Plant, 95 Pinnacle Drive, Jackson, TN, 38301.
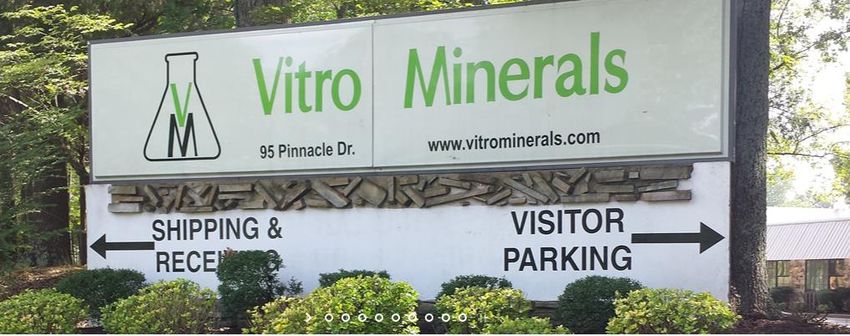
Vitro Minerals
95 Pinnacle Drive, Jackson, TN, 38301
(678) 729-9333 ▪ https://vitrominerals.com/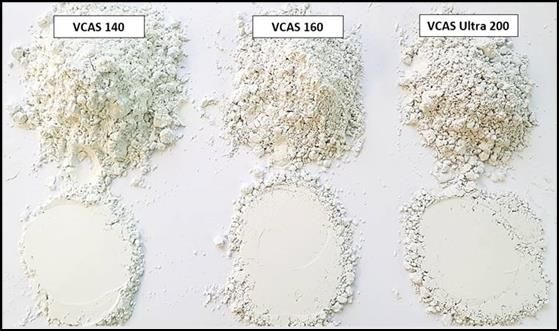
General Information This cradle to gate Environmental Product Declaration cover three ground-glass pozzolans produced by Vitro Minerals meeting the ASTM C1886 specification for Type GE Ground-Glass Pozzolan for Use in Concrete (ASTM, 2020). This study was conducted in accordance with ISO 14040 (ISO 14040, 2006), and 14044 (ISO 14044, 2006) and the requirements of the ISO 21930 (ISO 21930, 2017). ISO 21930 (ISO 21930, 2017) provides the core rules for the Type III Environmental Product Declaration (EPD) produced from this study. No PCR has been developed for ground-glass pozzolans meeting ASTM C1866 specification. Program Operator: ASTM International 100 Barr Harbor Drive Independent verification of the declaration PO Box C700 and data, according to ISO 14025: West Conshohocken, PA 19428-2959 ☐ internal external http://www.astm.org Third-party verifier: Thomas P. Gloria, PhD ▪ t.gloria@industrial-ecology.com Industrial Ecology Consultants 35 Bracebridge Rd. ▪ Newton, MA 02459-1728 (617) 553-4929 ▪ http://www.industrial-ecology.com EPD Owner: Vitro Minerals 95 Pinnacle Drive, Jackson, TN, 38301 (678) 729-9333 ▪ https://vitrominerals.com/ LCA and EPD Developer: Hossein Tavakoli hossein@climateearth.com Laurel McEwen laurel.mcewen@climateearth.com Climate Earth, Inc. 2150 Allston Way, Suite 320 ▪ Berkeley, CA 94704 (415) 391-2725 ▪ http://www.climateearth.com Date of Issue: February 1, 2021 (valid for 5 years until February 1, 2026) ASTM Declaration Number: EPD-166 Explanatory materials may be requested by contacting: Dewayne Robinson 731-695-2625 dewayne@vitrominerals.com
Product Description
Three ground-glass pozzolans were evaluated in this study: VCAS™ 140 and VCAS™ 160, and VCAS™ Ultra 200. Vitro
Mineral’s has branded their products VCAS™ Pozzolans (for Vitreous Calcium-Alumino-Silicate). These pozzolans
have low alkali content, consistent chemistry, and color. They are especially suited for white concrete applications
where they impart desirable benefits such as increased long-term strength and improved long-term durability of
concrete products. Each of these powders is produced from waste E-glass and meet the ASTM C1866 specification for
a Type GE Ground-Glass Pozzolan for Use in Concrete.

                                                            Table 1: Product specifications
                                    Product                     Particle Size (D50)1                     Brightness2
                                  VCAS™ 140                            12 microns                               87-89
                                  VCAS™ 160                            10 microns                               87-89
                                VCAS™ Ultra 200                         7 microns                               87-89

VCAS 160™ and VCAS™ 140 are commonly used in systems with low water/cement ratio and steam cured or warm
weather curing conditions where the lower reactivity associated with a 4000 Blaine product 3 is sufficient for the
application. VCAS™ 200 has a much finer particle size and has the reactivities normally associated with silica fume and
metakaolin with the advantage of being white in color. All VCAS™ grades exhibit approximately 10% lower water
demand than silica fume or metakaolin and can be used at cement replacement levels of up to 40%.

                                    Figure 1: Type GE ground-glass pozzolan product types covered in study4

Production of VCAS 160™, VCAS™ 140 and VCAS™ 200 starts with the primary sizing of the waste E-glass. This feed
stock is then finely ground and processed through high efficiency classifiers to produce a fine white powder with
quality assured physical properties. The consistent chemical composition and tightly controlled particle size
distribution offers excellent repeatability of properties in concrete applications.

Declared Unit: 1 metric ton of ground-glass pozzolan

Product Components: 100% E-glass

1
  D50: The portions of particles with diameters smaller and larger are 50%.
2
  VCAS pozzolans are whiter than white cement and will not discolor decorative concrete.
3
  Blane number refers to particle size distribution.
4
  For further description see https://vitrominerals.com/products/recycled-glass-powders/vcas-white-pozzolans/
System boundary
This study is cradle-to-gate covering A1-A3 stages of the life cycle as illustrated in Figure 3.
• A1 – Raw Material Supply (upstream processes): Extraction, handling, and processing of the materials
(including fuels) used in the production of glass powder.
• A2 – Transportation: Transportation of these materials from the supplier to the ‘gate’ of the Jackson, TN
Plant.
• A3 – Manufacturing (core processes): Manufacturing of the product including, grinding, packaging and
waste handling and treatment.
Figure 2: Life-cycle stages and modules
Note: MND = module not declared; X = module included.
Except as noted above, all other life cycle stages as described in Figure 1 are excluded from the LCA study. The
following processes are also excluded from the study:
1. Production, manufacture, and construction of manufacturing capital goods and infrastructure.
2. Production and manufacture of production equipment and material, delivery vehicles.
3. Personnel-related activities (travel, furniture, office supplies).
4. Energy and water use related to company management and sales activities that may be located either within
the factory site or at another location.
The main processes included in the system boundary are illustrated in Figure 3.
Figure 3: System Boundary for studyElectricity impacts are calculated based on electricity provided at the grid of the state of Tennessee provided by US EI database (Long Trail Sustainability, 2020). The resource mix for the state of Tennessee is: 44.4% nuclear, 25.7% coal, 16.4% natural gas, 11.9% hydro, 1.2 wood chips, 0.2% solar, and
Life Cycle Impact Assessment Results
                         Table 2:Cradle to Gate (A1-A3) impact results per metric tonne for each ground-glass pozzolan
                                                                                                                          VCAS-
                           Impact Assessment                                Unit         VCAS-140         VCAS-160
                                                                                                                         Ultra200
     Global warming potential (GWP)5                                       kg CO₂ e          95.8             119          150
     Depletion potential of the stratospheric ozone layer      (ODP)6     kg CFC-11 e     8.12E-06          1.02E-05     1.30E-05
     Eutrophication potential (EP)4                                         kg N e           0.25             0.31         0.40
     Acidification potential of soil and water sources (AP) 4              kg SO2 e          0.46             0.57         0.71
     Formation potential of tropospheric ozone      (POCP) 4                kg O₃ e          4.74             5.67         6.90
    Resource Use
    Abiotic depletion potential for fossil resources (ADPfossil)           MJ, NCV          1,072            1,327        1,664
    Renewable primary energy resources as energy (fuel),       (RPRE)*7    MJ, NCV           145              177          219
    Renewable primary resources as material,       (RPRM)*5                MJ, NCV            0                0            0
    Non-renewable primary resources as energy (fuel),     (NRPRE)* 5       MJ, NCV          2,507            3,140        3,974
    Non-renewable primary resources as material (NRPRM)* 5                 MJ, NCV            0                0            0
    Consumption of fresh     water5                                          m3              3.22             3.90         4.80
    Secondary Material, Fuel and Recovered Energy
    Secondary Materials, (SM)* 5                                              kg            1,000            1,000        1,000
    Renewable secondary fuels, (RSF)* 5                                    MJ, NCV            0                0            0
    Non-renewable secondary fuels      (NRSF)* 5                           MJ, NCV            0                0            0
    Recovered energy,    (RE)* 5                                           MJ, NCV            0                0            0
    Waste & Output Flows
    Hazardous waste disposed*5                                                kg              0                0            0
    Non-hazardous waste      disposed*5                                       kg              0                0            0
    High-level radioactive   waste*5                                         m3           7.77E-07          9.82E-07     1.25E-06
    Intermediate and low-level radioactive waste*5                           m3           3.75E-06          4.73E-06     6.03E-06
    Components for     reuse*5                                                kg              0                0            0
    Materials for   recycling*5                                               kg             0.25             0.25         0.25
    Materials for energy recovery*5                                           kg          2.02E-02          2.02E-02     2.02E-02
    Recovered energy exported from the product system*5                       MJ              0                0            0
Life cycle impact assessment (LCIA) results are relative expressions and do not predict impacts on category
endpoints, the exceeding of thresholds, safety margins, or risks.
EPDs are comparable only if they comply with this document, use the same sub-category PCR where applicable,
include all relevant information modules and are based on equivalent scenarios with respect to the context of
construction works
LCA Interpretation
Most glass powder impacts come from the A3 life cycle stage. Electricity from the grinding operation is the primary
source of global warming potential (GWP) impacts for this stage.

* Emerging LCA impact categories and inventory items are still under development and can have high levels of uncertainty that
preclude international acceptance pending further development. Use caution when interpreting data in these categories.

5
  Calculated as per U.S. EPD TRACI v2.1, with IPCC 2013 (AR 5)
6
  Calculated as per U.S. EPA TRACI v2.1 (EPA, 2014)
7
  Calculated as per ACLCA ISO 21930 Guidance (ACLCA, 2019)
You can also read