Scanning ARM Cloud Radar-Advanced-Velocity Azimuth Display Value-Added Product - DOE/SC-ARM-TR-209 - EE Clothiaux T Toto K Lamer M Oue
←
→
Page content transcription
If your browser does not render page correctly, please read the page content below
DOE/SC-ARM-TR-209

Scanning ARM Cloud Radar—Advanced—Velocity
Azimuth Display
Value-Added Product

EE Clothiaux   K Johnson
T Toto         P Kollias
K Lamer        SE Giangrande
M Oue

January 2018
DISCLAIMER

This report was prepared as an account of work sponsored by the U.S.
Government. Neither the United States nor any agency thereof, nor any of
their employees, makes any warranty, express or implied, or assumes any
legal liability or responsibility for the accuracy, completeness, or
usefulness of any information, apparatus, product, or process disclosed, or
represents that its use would not infringe privately owned rights. Reference
herein to any specific commercial product, process, or service by trade
name, trademark, manufacturer, or otherwise, does not necessarily
constitute or imply its endorsement, recommendation, or favoring by the
U.S. Government or any agency thereof. The views and opinions of
authors expressed herein do not necessarily state or reflect those of the
U.S. Government or any agency thereof.
DOE/SC-ARM-TR-209

Scanning ARM Cloud Radar—Advanced—
Velocity Azimuth Display
Value-Added Product

EE Clothiaux, Pennsylvania State University
K Johnson, Brookhaven National Laboratory
T Toto, Brookhaven National Laboratory
P Kollias, Stony Brook University
K Lamer, Pennsylvania State University
SE Giangrande, Brookhaven National Laboratory
M Oue, Stony Brook University

January 2018

Work supported by the U.S. Department of Energy,
Office of Science, Office of Biological and Environmental Research
EE Clothiaux et al., January 2018, DOE/SC-ARM-TR-209

                  Acronyms and Abbreviations
AGL            above ground level
ARM            Atmospheric Radiation Measurement
DOE            U.S. Department of Energy
ENA            Eastern North Atlantic
HSRHI          horizon-to-horizon range height indicator
NetCDF         Network Common Data Form
SACR           Scanning ARM Cloud Radar
SACR-ADV-VAD   Scanning ARM Cloud Radar-Advanced-Velocity Azimuth Display
VAD            Velocity-Azimuth Display
VAP            value-added product

                                            iii
EE Clothiaux et al., January 2018, DOE/SC-ARM-TR-209
Contents
Acronyms and Abbreviations ...................................................................................................................... iii
1.0 Introduction .......................................................................................................................................... 1
2.0 SACR HSRHI Input Data ..................................................................................................................... 1
3.0 Algorithm and Methodology ................................................................................................................ 2
3.1 Velocity Azimuth Display (VAD) Technique.............................................................................. 2
3.2 Algorithm Flow ............................................................................................................................ 2
4.0 Output Data .......................................................................................................................................... 4
5.0 Summary............................................................................................................................................... 4
6.0 Example Plots ....................................................................................................................................... 4
7.0 References ............................................................................................................................................ 6
Figures
1 Schematic representation of SACR HSRHI scan. .................................................................................. 1
2 Flowchart describes the processing of a single SACR HSRHI scan input data file. .............................. 3
3 Quicklook image produced by the SACR-ADV-VAD VAP for ARM’s Eastern North Atlantic
(ENA)-C1 observatory on 20170415. .................................................................................................... 6
Tables
1 Input variables. ....................................................................................................................................... 2
2 Major output variables from SACR-ADV-VAD.................................................................................... 4
ivEE Clothiaux et al., January 2018, DOE/SC-ARM-TR-209
1.0 Introduction
Spatial distribution of horizontal winds is an important meteorological property to understand mesoscale
and cloud scale dynamics of cloud and precipitation systems. The most popular wind measurement is
performed by soundings. The sounding observation is generally conducted 1-4 times per day, which may
not be enough to observe detailed in-cloud structure.
Doppler weather and cloud radars can perform frequent measurements of radial velocities of
cloud/precipitation particles in clouds. The weather radar community has historically used the Velocity-
Azimuth Display (VAD) technique to retrieve in-cloud wind properties (direction and speed) from radial
velocity (e.g., Lhermitte and Atlas, 1961).
The U.S. Department of Energy (DOE) Atmospheric Radiation Measurement (ARM) Climate Research
Facility’s Ka- and W-band Scanning ARM Cloud Radars (SACRs) collect volume observations of mean
Doppler velocity with horizon-to-horizon range height indicator (HSRHI) scans every 30-60 minutes. The
SACR ADVanced Velocity-Azimuth Display (SACR-ADV-VAD) Value-Added Product (VAP) extends
the VAD technique to cloud radar observations. The VAP provides time series of vertical profiles of in-
cloud wind fields at higher temporal and vertical resolutions, which can augment sounding wind
measurements.
2.0 SACR HSRHI Input Data
The HSRHI scan strategy consists of six horizon-to-horizon scans spaced by 30 degrees in azimuth
(Kollias et al., 2014). This strategy is typically repeated every 30-60 min and thus the temporal resolution
of the product will be ~30-60 min. While the product could be created using either Ka- or W-band SACR
observations, so far only Ka-band data have been used.
Figure 1. Schematic representation of SACR HSRHI scan (based on Figure 3 of Kollias et al., 2014).
The SACR-ADV-VAD VAP may be run using calibrated SACR data as input (kasacrcorhsrhi*.c1
datastreams) or uncalibrated SACR data (kasacrhsrhi*.a1). When processing calibrated data, SACR-
ADV-VAD produces kasacradvvad*.c1 output products. When processing uncalibrated data, SACR-
1EE Clothiaux et al., January 2018, DOE/SC-ARM-TR-209
ADV-VAD produces kasacradvvad*.c0 output products. Note, relative calibration offsets do not impact
the quality of the VAD products. However, select velocity dealiasing and associated retrieval quality
control measures to ensure accurate VAD estimates are only available within 'c1' product streams. The
'c0' versions are available on an expedited timetable and are based on uncorrected SACR data. As a result,
they may reflect some additional noisiness and velocity aliasing in faster wind speeds.
Table 1. Input variables.
Input Variables
kasacrcorhsrhi*.c1 kasacrhshri*.a1
mean_doppler_velocity_corrected mean_doppler_velocity
reflectivity_corrected reflectivity
snr snr
spectral_width spectral_width
nyquist_velocity nyquist_velocity
radar_beam_width_h radar_beam_width_h
sweep_end_ray_index sweep_end_ray_index
sweep_start_ray_index sweep_start_ray_index
antenna_transition antenna_transition
azimuth azimuth
elevation elevation
fixed_angle fixed_angle
altitude_agl altitude_agl
velocity_unfolding_flag
3.0 Algorithm and Methodology
3.1 Velocity Azimuth Display (VAD) Technique
The traditional VAD technique uses radial velocity measurements at a constant elevation angle and a
constant range through azimuth from 0° to 360°. In a region of homogeneous wind flow, the observed
radial velocity would exhibit a sinusoidal pattern when plotted versus azimuth at a fixed elevation and
constant height above the ground. The sinusoid’s maximum amplitude is equal to the horizontal wind
speed and the phase location indicates the wind direction. The offset of the sinusoid from zero velocity is
a measure of vertical hydrometeor motion.
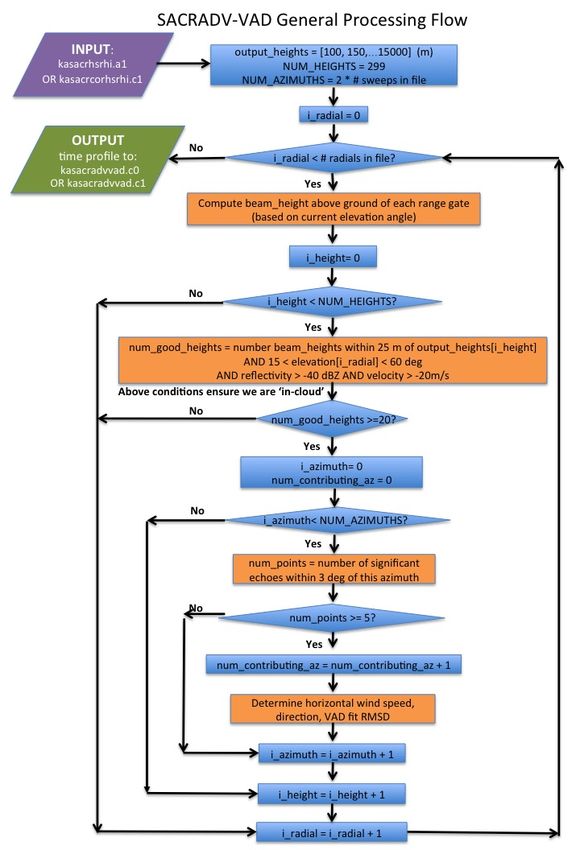
3.2 Algorithm Flow
In the SACR-ADV-VAD application of the technique, we typically have at most 12 azimuth points
contributing data to the algorithm (see Figure 1) from the endpoints of the six horizon-to-horizon scans.
The SACR-ADV-VAD process is straightforward, pulling in a full day of HSRHI scan input files and
outputting the product in a single file for each day. No input other than the HSRHI data is required. Each
HSRHI scan file provides the measurements needed to produce a single time profile of in-cloud
horizontal wind speed and direction as a function of height. Figure 2 presents a flowchart of the
algorithm.
2EE Clothiaux et al., January 2018, DOE/SC-ARM-TR-209
Figure 2. Flowchart describes the processing of a single SACR HSRHI scan input data file. For each
processing date, there will typically be many HSRHI input files, so this algorithm would be
repeated for each input file, producing one output time profile for each input HSRHI file.
3EE Clothiaux et al., January 2018, DOE/SC-ARM-TR-209
4.0 Output Data
This VAP outputs a daily NetCDF file containing one time profile of cloud-level horizontal wind speed
and direction derived from each HSRHI scan sequence performed on that date. (Note that this could result
an irregular time stamp.) This product is produced at a 50 m height resolution, for heights from 100m to
15000m AGL.
Table 2. Major output variables from SACR-ADV-VAD.
Datastream kasacradvvad fields
horizontal_wind_magnitude_at_cloud_level (time, height)
horizontal_wind_direction_at_cloud_level (time, height)
vad_fit_rmsd (time, height)
number_az_angles (time, height)
5.0 Summary
The SACR ADVanced Velocity-Azimuth Display (SACR-ADV-VAD) product is intended to
complement infrequent soundings by providing profiles of horizontal wind speed and direction in cloud.
The Velocity Azimuth Display (VAD) technique was historically used to retrieve wind field properties
using weather radars (Lhermitte and Atlas, 1961). This VAP relies on SACR radial mean Doppler
velocity observations corrected for aliasing, producing a daily NetCDF file containing profiles of cloud-
level horizontal wind speed and direction derived every time the HSRHI scan strategy is performed.
6.0 Example Plots
Quicklook images are produced for each day of SACR-ADV-VAD processing. Figure 3 presents a
sample output.
4EE Clothiaux et al., January 2018, DOE/SC-ARM-TR-209
5EE Clothiaux et al., January 2018, DOE/SC-ARM-TR-209
Figure 3. Quicklook image produced by the SACR-ADV-VAD VAP for ARM’s Eastern North
Atlantic (ENA)-C1 observatory on 20170415. The top image is number of azimuth angles.
The middle image is wind speed and the bottom image is wind direction.
7.0 References
Kollias, P, N Bharadwaj, K Widener, I Jo, and K Johnson. 2014. “Scanning ARM cloud radars. Part I:
Operational Sampling Strategies.” Journal of Atmospheric and Oceanic Technology 31(3): 569-582,
doi:10.1175/JTECH-D-13-00044.1.
Lhermitte, RM, and DA Atlas. 1961. “Precipitation motion by pulse Doppler.” Proceedings of the 9th
Weather Radar Conference, Boston, American Meteorological Society, Boston, Massachusetts, 498-503.
6You can also read