Active Sustainable Travel - a Best Buy for Public Health - SPT Travel Plan Seminar Influencing Travel Choices
←
→
Page content transcription
If your browser does not render page correctly, please read the page content below
Active Sustainable Travel – a
     Best Buy for Public Health

             SPT Travel Plan Seminar
            Influencing Travel Choices
                  Thursday 21st February 2013

Fiona Crawford
Public Health Programme Manager
Glasgow Centre for Population Health
Policies, evidence and expert opinion
Let’s Make Scotland More Active (2003)
“All children and young people, including children with disabilities, should
 take part in at least one hour a day of physical activity. This physical
 activity should include physical education, play sports, exercise, dance,
outdoor activities, active travel and support to be active in their daily
tasks at home, at school and in the community.”

Five Year Review of "Let's Make Scotland More Active”
(2009)
“The review group believes the creation and provision of environments
that encourage and support physical activity offers the greatest
potential to get the nation active.”
Foresight (2007)
 Walking and cycling in the course of daily life are an important
 component of population activity levels. …….
  And……….
 Tackling obesity has striking similarities with tackling climate change.
 Both need whole societal change with cross governmental action and
 long term commitment.

World Health Organisation (1999)
….adverse health effects of transport fall disproportionately on the most
vulnerable groups in our societies. These groups include people with
disabilities; the elderly; the socially excluded; children and young people;
and people living and working in areas of intensified and cumulative air
 pollution and noise.
CO2 Air
emissions pollution
Physical activity
Osteoporosis
Injuries
And by the way…
Social capital
Infrastructure costs
“…. The solid facts are that walking and cycling benefit health
  while motor vehicles damage health. Walking and cycling need
  to be prioritised in transport planning; compact cities that
  minimise vehicle journeys need to be prioritised in economic
  and land-use planning; public transport must be significantly
  improved, while car travel is reduced; and leadership is needed
  from politicians, industry and ‘civil society.’”
   Social Determinants of Health, 1999
Obesity and Quality of Life
Scotland Performs National Indicator
Increase the proportion of journeys to work made
by public or active transport

“Essentially, we want to encourage a shift from the car,
particularly for short journeys, across the whole population.
Not only will this reduce congestion and improve health by
reducing harmful emissions, it will enable people in
Scotland to live longer and healthier lives by making it
easier to incorporate physical activity into daily routines.”

Scotland Performs Website
http://www.scotland.gov.uk/About/scotPerforms/indicators/publicTransport
Progress

•Transport accounted for 26% of total Scottish
emissions in 2007 - a rise of nearly 10% since
1990
•Transport’s share of total Scottish emissions
increased by a greater amount in 2007 than in
all previous years
Source: Scottish Government. Carbon Account for Transport No. 2:
2010 Edition. Edinburgh: Scottish Government, 2010
www.scotland.gov.uk/Publications/2010/03/11091112/0
National Trends in School Travel
                         Scottish trends for travel to and from school (pupils aged 5 to 16) 1985-2006
                                                 Source : National Travel Survey

    80

    70

    60

    50

                                                                                                                                Walking
                                                                                                                                Bus
%

    40
                                                                                                                                Car

    30

    20

    10

    0
         1985 / 1986   1989 / 1991   1992 / 1994   1995 / 1997          1998 / 2000   2002 / 2003   2004 / 2005   2005 / 2006
                                                                 Year
National Travel to Work Trends
Usual means of travel to work in Scotland, 1966-2001
Source: Census
100%
12
90% 15
20
24 24
80%
Other (e.g. taxi)
Foot
70%
Bicycle
Motor Cycle
60%
21 Car
29 Bus
46 59
50% 68
Train
40%
30%
43
20% 35
25
18
10% 12
0%
1966 1971 1981 1991 2001Mode of Travel by Income
Pedestrian Child Casualties
                          Rates of pedestrian child casualties (5-15 year olds) by deprivation, Glasgow and Clyde Valley, 1996-
                                                                    2000 to 2002-2006
                                                                Source: Police Statistics 19

                   600

                   500

                                                                                                                                  Least Deprived
                   400                                                                                                            2
Rates per 100000

                                                                                                                                  3
                                                                                                                                  4
                                                                                                                                  5
                   300
                                                                                                                                  6
                                                                                                                                  7
                                                                                                                                  8
                   200                                                                                                            9
                                                                                                                                  Most deprived

                   100

                    0
                         1996-2000    1997-2001      1998-2002     1999-2003     2000-2004     2001-2005      2002-2006
                                                                     Year
Adult Road Traffic Casualties
Admissions to hospital following RTAs among adult (15+) pedestrians by deprivation quintiles,
Scotland, 1996/99 - 2005/08, Rolling 3 year totals shown as rates per 100,000 population
Source: SMR01, ISD Scotland
100.0
90.0
80.0
70.0
Rate per 100,000
60.0 Most Affluent
Quintile 2
50.0 Quintile 3
Quintile 4
40.0 Most Deprived
30.0
20.0
10.0
0.0
96/99 97/00 98/01 99/02 00/03 01/04 02/05 03/06 04/07 05/08
YearSafety
Pedestrian Safety
• For pedestrians involved in a vehicular crash
  – 5% are killed at 20 mph
  – 50% are killed at 30 mph
  – 95% are killed at 40 mph

• Two thirds of all crashes where pedestrians
  involved are killed or seriously injured (KSI)
  occur on roads with a speed limit of 30 mph or
  less
Impacts of 20mph Zones
    • Good evidence of effectiveness

         – Introduction of mandatory 20mph zones in
           London led to significant reduction in road
           casualties

         – 50% drop in number of KSI children

         – Reduction of casualties among cyclists also
           greater in children and in KSI
Grundy et al. Effect of 20 mph traffic speed zones on road injuries in
London, 1986-2006: controlled interrupted time series analysis. BMJ
2009;339:b4469
“By far the best value for money is currently coming from spending on ‘smarter choices’ (travel planning, car-reduction policies, telecommunications as alternatives to some travel, etc), local safety schemes, cycling schemes, and the best of local bus and some rail quality and reliability schemes.” (House of Commons Transport Select Committee, 2010)
What is Cycling Worth?

If x people cycle y distance on most
days, what is the value of the health
benefits that occur as a result of the
  reduction in mortality due to their
         increased activity?

  (WHO Health Economic Tool for Cycling)
What is Cycling Worth in Glasgow?
Glasgow cycle counts at all cordon sites around the city, 2009- 2012
Source: Land & Environmental Services, Glasgow City Council
4000
3500
Over £4 million 3713 2009 2010 2011 2012
3335
3000
2500
estimated annual
2776
2957 2905
2438
2664
2680
2000
1500
benefit in 2012
1000
500
0
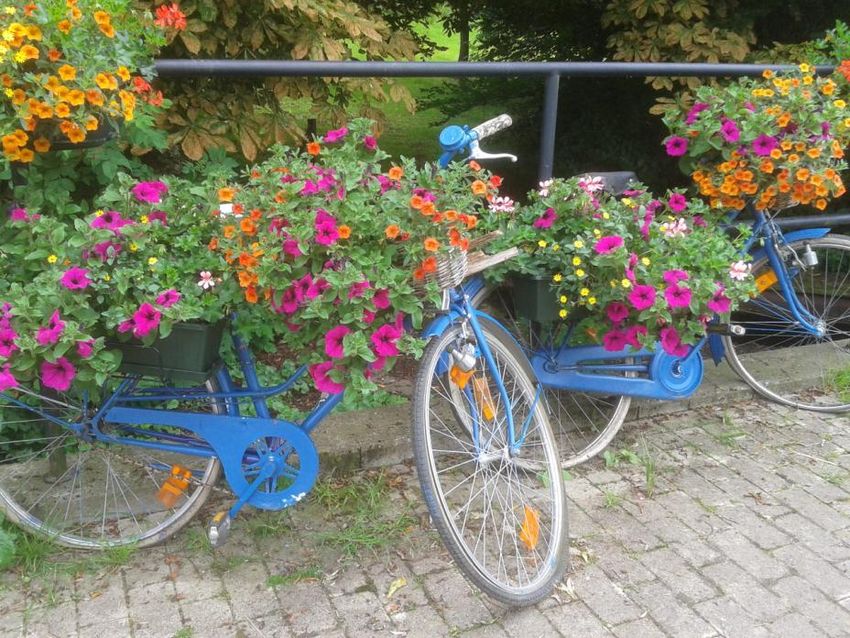
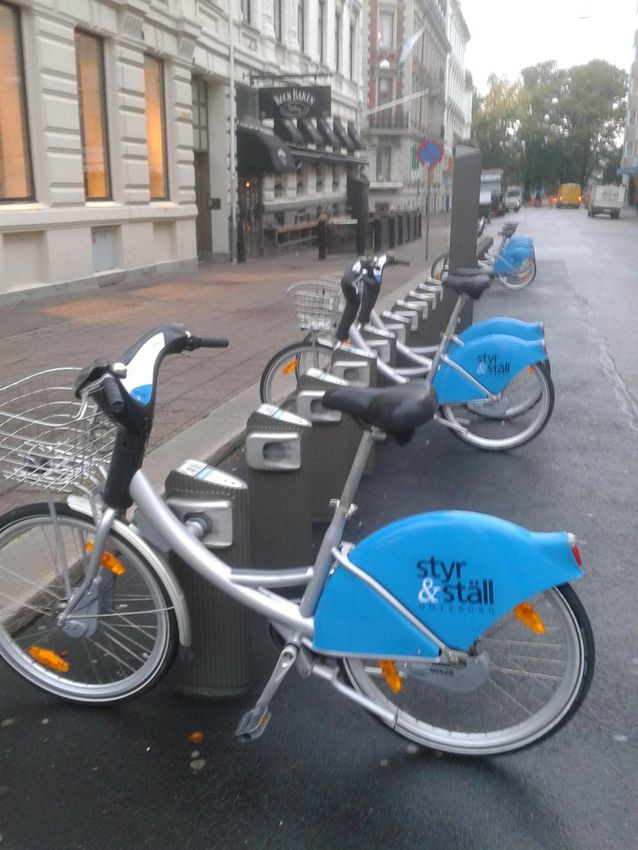
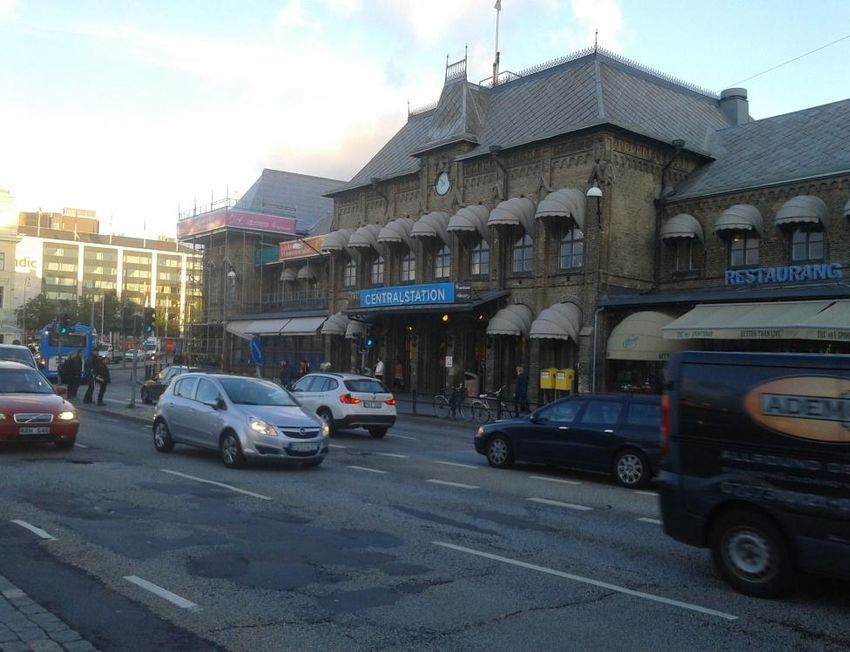
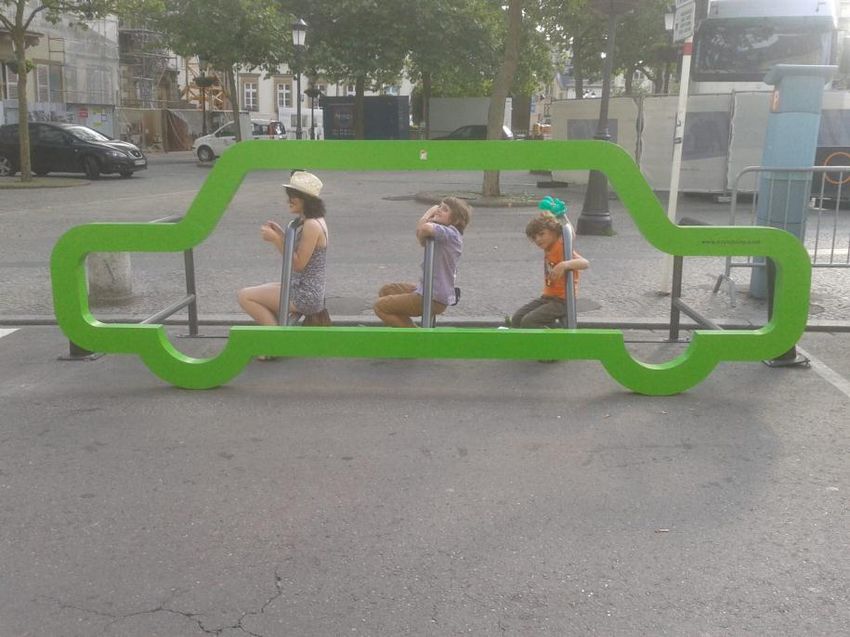
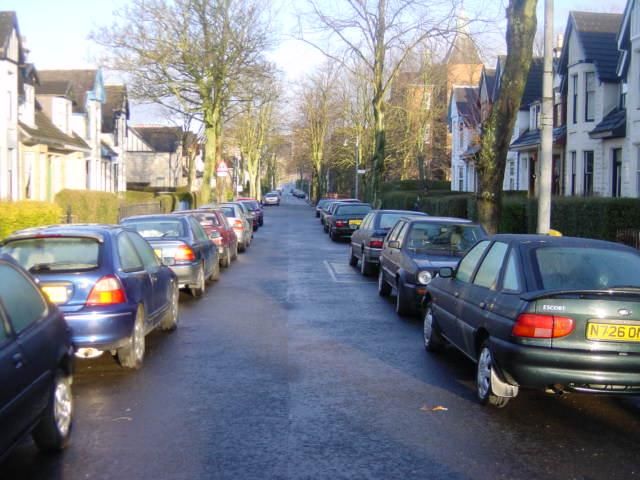
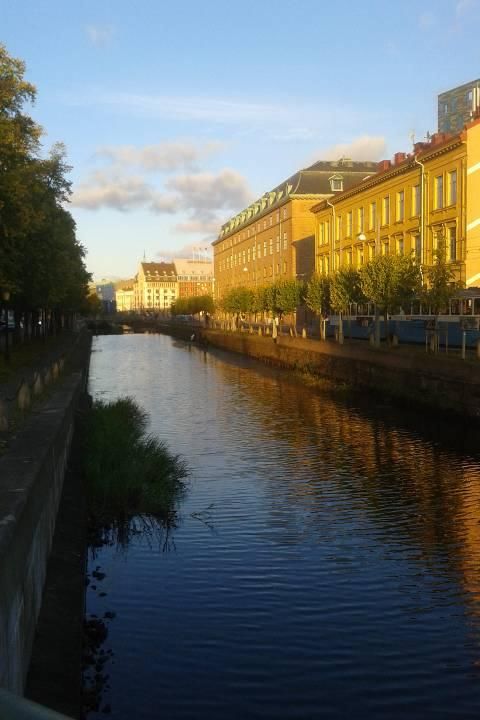
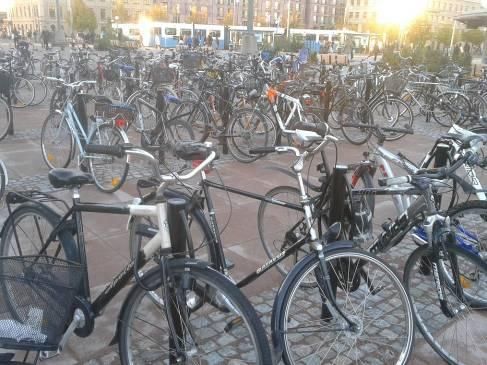
To City From CityActive Travel - A Tale of Two Cities
http://www.europeinminiature.com
Civilising the Streets
To Sum Up
• Robust evidence base for health benefits of active
  sustainable travel

• Clear strategic commitment to active sustainable
  travel but less evidence of change on the ground

• Many (but not all) trends moving in the wrong direction

• Single outcome agreements - have they helped/can
  they help?
Let’s Really Get a Move On…

• Rhetoric into reality on the ground

• Support local ‘smarter choices’ work

• Creativity

• Bravery
Acknowledgements

•   Transport and Health Advisory Group
•   Bruce Whyte (GCPH)
•   Pete Seaman (GCPH)
•   Mark Livingston (University of Glasgow)

More information on our website
http://www.gcph.co.uk/
Thanks
You can also read