COVID Model Projections - BC COVID-19 Modelling Group
←
→
Page content transcription
If your browser does not render page correctly, please read the page content below
August 6, 2021
                                                                              BC COVID-19 Modelling Group

COVID Model Projections
                              August 6, 2021

         BC COVID-19 Modelling Group

          Given the rapidly changing COVID-19 situation in BC,
                      this is an intermediate report
  (only updated data slides are included - see July 28 report for details).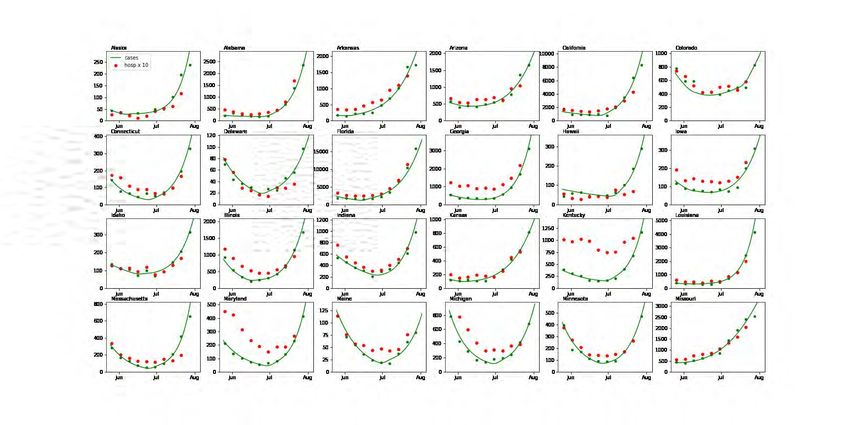
August 6, 2021
                                                                   BC COVID-19 Modelling Group

About BC COVID-19 Modelling Group
                                                    Contributors to report
                                                    Eric Cytrynbaum (UBC, co-editor)
                                                    Sarah Otto (UBC, co-editor)
                                                    Dean Karlen (UVic and TRIUMF)
                                                    Caroline Colijn (SFU)
                                                    Jens von Bergmann (MountainMath)
                                                    Rob James (evidently.ca)
                                                    James Colliander (UBC and PIMS)
                                                    Daniel McDonald (UBC)
                                                    Paul Tupper (SFU)
                                                    Daniel Coombs (UBC)
                                                    Elisha Are (SFU)
                       https://bccovid-19group.ca   Bryn Wiley (UBC)

        Independent and freely offered advice,
       using a diversity of modelling approaches.                                          2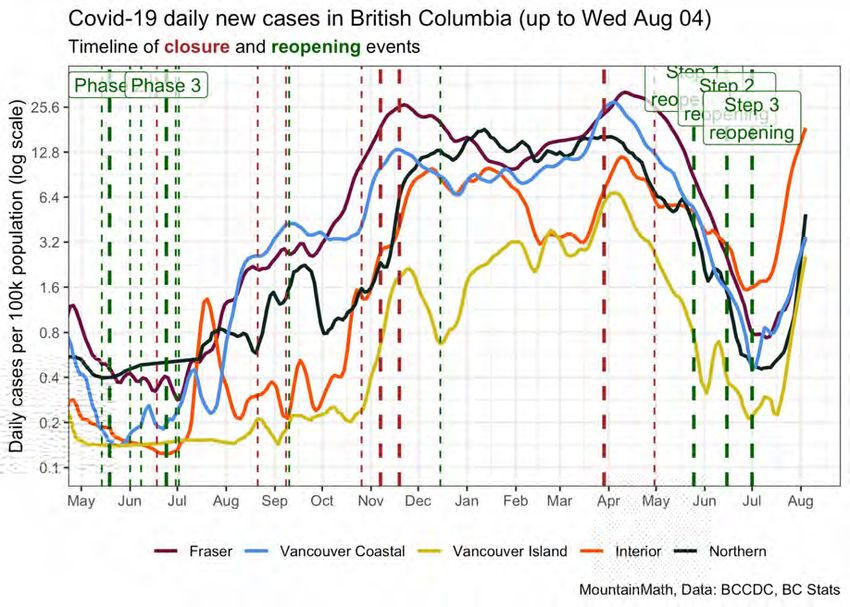
August 6, 2021

State of the COVID-19 Pandemic in BC                                                                                                             BC COVID-19 Modelling Group

                                                                                                                             April 2021: BC bent down
                                                                                                                           the COVID-19 curve following
                                                                                                                             March 30 “circuit breaker”

                                                                                                                                     Cases are showing strong and
                                                                                                                                           sustained growth
                                                                                                                                        after Step 3 reopening.

                                                                                                                       COVID-19 is now spreading
                                                                                                                     rapidly in BC, echoing growth of
                                                                                                                          Delta in other regions.

Source (J. von Bergmann) Case data from BC COVID-19 Database (http://www.bccdc.ca/health-info/diseases-conditions/covid-19/data). Vertical lines give dates of
public health measures (major as thick lines, minor as thin lines). Grey dots are raw case counts, grey lines is cases abused for weekly pattern, black STL trend line and   3
blue fitted periods of constant exponential growth.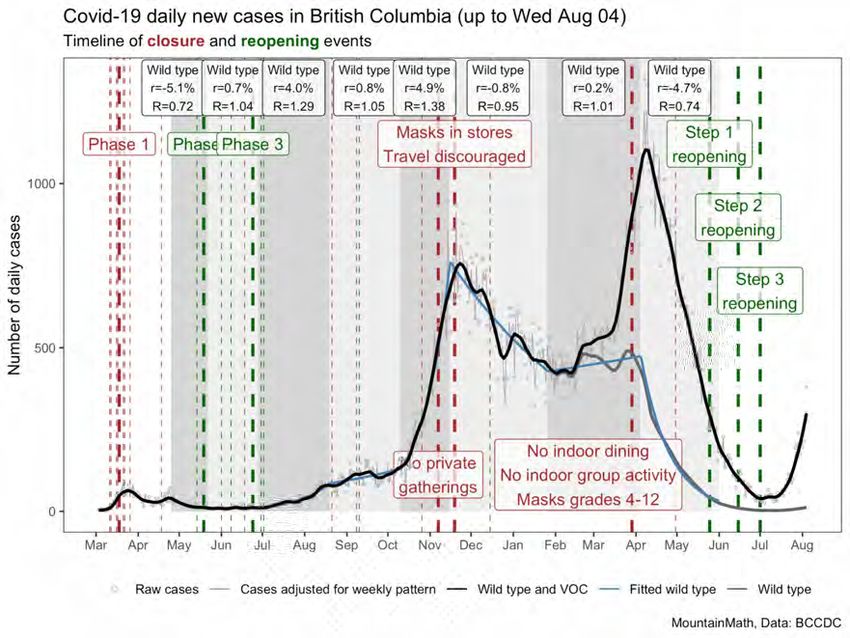
August 6, 2021

State of the COVID-19 Pandemic in BC                                                                                                             BC COVID-19 Modelling Group

                                                                                                                     First-dose vaccination % of total population:
                                                                                                                     Interior Health: 66.4%
                                                                                                                     Northern Health: 58.3%
                                                                                                                     Fraser Health: 70.3%
                                                                                                                     Vancouver Coastal: 80.8%
                                                                                                                     Vancouver Island: 71.9%
                                                                                                                     BC: 72.9%

                                                                                                                        All Health Authorities are
                                                                                                                      showing strong and sustained
                                                                                                                                 growth.

                                                                                                                                   Recent rise in case
                                                                                                                                      numbers is in
                                                                                                                            Interior Health Authority is now
                                                                                                                               echoing in all other HAs.

Source (J. von Bergmann) Case data from BC COVID-19 Database (http://www.bccdc.ca/health-info/diseases-conditions/covid-19/data). Vertical lines give dates of
public health measures (major as thick lines, minor as thin lines). Grey dots are raw case counts, grey lines is cases abused for weekly pattern, black STL trend line and   4
blue fitted periods of constant exponential growth. Vaccination % by Health Authority from the BCCDC Dashboard, with BC population 2021 projections.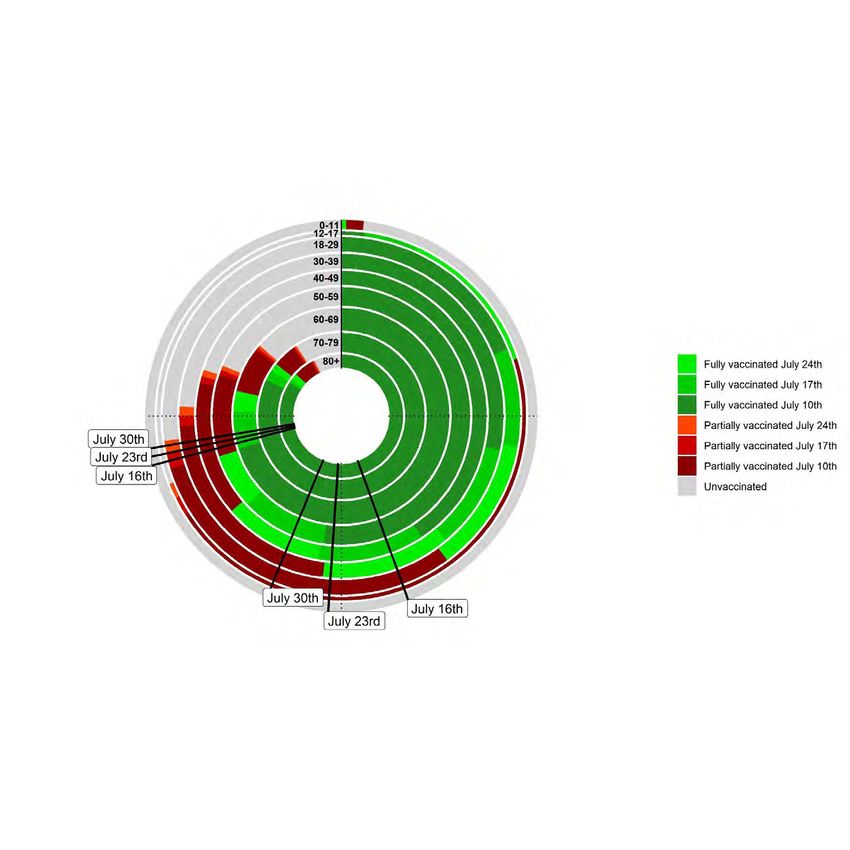
August 6, 2021
                                                                                                                                    BC COVID-19 Modelling Group
  Previous model fits to BC data (July 28 report)
            BC                                                Fraser
                                                                           alpha+gamma: -11% / day
                                                                           delta: +8% / day
                                                                           → +19% / day swing

                                                                                                                   BC data fits are consistent
                                                                                                                   with the pattern seen in
                                                                                                                   Europe and US states, where
          alpha+gamma: -9% / day
          delta: +9% / day
                                                                                                                   the combination of relaxation
          → +18% / day swing                                                                                       and the emergence of delta
                                                                                                                   has produced large swings in
                                                                                                                   daily growth rates.
            Interior                                          Vancouver Coastal
                                                                           alpha+gamma: -11% / day                 The proportion of cases due
                                                                           delta: +6% / day
                                                                           → +17% /day swing
                                                                                                                   to delta may differ from these
                                                                                                                   fits since the fits assume
                                                                                                                   constant behaviour.

          alpha+gamma: -8% / day
          delta: +12% / day
          → +20% / day swing

                                                                                                                                                            5
Source (D. Karlen). See www.pypm.ca. These models have no age structure. Fits include past vaccination schedule.
August 6, 2021
                                                                                                                                   BC COVID-19 Modelling Group
  Model fit update with recent BC data
           BC                                             Fraser                                     Vancouver Coastal
                              delta: +9% / day                               delta: +7% / day                       delta: +6% / day

         Interior                                    Vancouver Island                                   Northern
                      delta: +11% / day                                    delta: +7% / day                        delta: +14% / day

                                                                                                                                                           6
Source (D. Karlen). See www.pypm.ca. These models have no age structure. Fits include past vaccination schedule.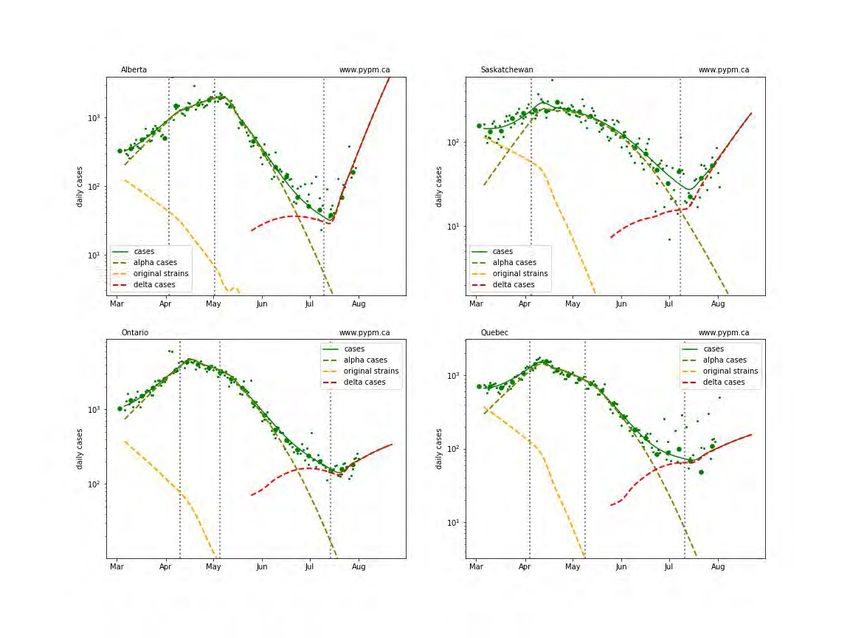
August 6, 2021
                                                                                                                                 BC COVID-19 Modelling Group

  Earlier model fits for other provinces, showing recent data
         Alberta                                                Manitoba

                                                                                                                   Recent data are compared
                                                                                                                   to earlier model projections
                                                                                                                   for 4 provinces.

                                                                                                                   The decline in case rates
                                                                                                                   agrees with the projections
         Ontario                                               Quebec                                              from a month earlier, with
                                                                                                                   the exception of Alberta,
                                                                                                                   where a significant uptick
                                                                                                                   in case rate is seen in the
                                                                                                                   past week.

                                                                                                                                                         7
Source (D. Karlen). See www.pypm.ca. These models have no age structure. Fits include past vaccination schedule.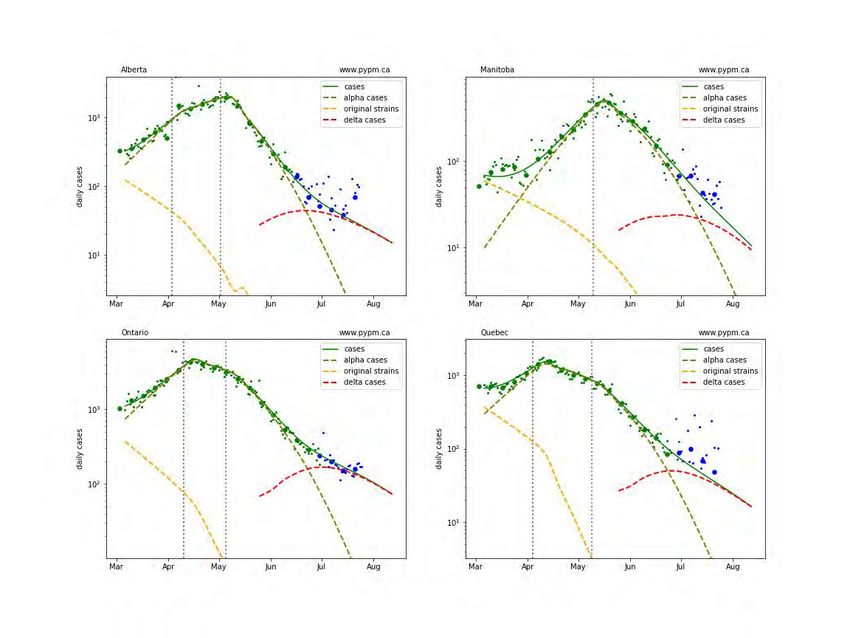
August 6, 2021
                                                                                                                   BC COVID-19 Modelling Group

      Update for other provinces
         Alberta                                                 Saskatchewan
                                 delta: +14% / day

         Ontario                                               Quebec

                                                                                                                                           8
Source (D. Karlen). See www.pypm.ca. These models have no age structure. Fits include past vaccination schedule.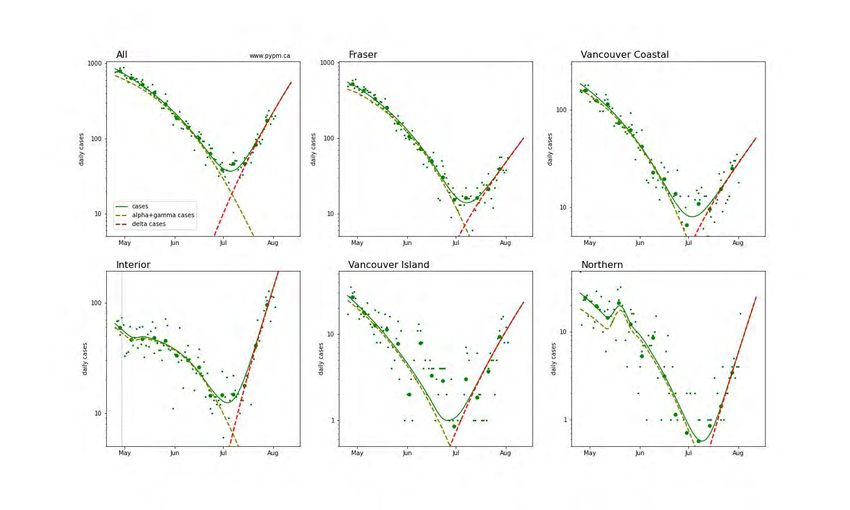
August 6, 2021
                                                                                                                                                         BC COVID-19 Modelling Group
   Delta trends in Alberta
    Delta is now the most common Variant of Concern in Alberta (left), making up 99% of the variants and 76% of
    all cases (projections for August 6th). The seven-day average case number has now risen to nearly 200, up
    from under 50 the month before (right). Delta cases have recently risen rapidly (blue; doubling time ~7-8
    days), underlying the rise in overall case numbers.

          Daily selective advantage of Delta                                         Daily growth rate of Delta
          s = 0.15 {95% CI: 0.14–0.17}                                               r = +0.090 {95%CI: 0.085–0.094}

                                                                                                                                        Total cases
                                                                                                                                        (gray shading)

                                                                                                                                            Delta cases
                                                                                                                                            (blue dots)*
                                                                                                                                             *Recent Delta numbers are
                                                                                                                                             underestimated, as variants
                                                                                                                                             are still being typed.

Source (S. Otto). Data from source file https://www.alberta.ca/stats/covid-19-alberta-statistics.htm#variants-of-concern (accessed August 5, using data through August 3).
Uses a maximum likelihood approach, with binomial sampling among VOC to estimate s for Delta relative to other VOC (mainly Alpha) and with Poisson sampling to                        10
estimate r for Delta. Curves are fits within the 95% CI for s and initial proportion (left) or for r and initial number (right). r and s change over time and their averages shown.
August 6, 2021
                                                                                                                                              BC COVID-19 Modelling Group

  What are the projected hospital numbers?
                      BC
        Daily cases

                                                                                                                                                     If cases
                                                                                                                                                   continue to
                                                                                                                                                        rise,
                                                                                                                                                 hospitalization
                                                                                                                                                  and ICU are
                                                                                                                                                   expected to
                                                                                                                                                 follow suit with
   Hospital & ICU
    occupancy

                                                                                                                                                  a short delay.

                                                                                                                                                                     11
Source (D. Karlen). See www.pypm.ca. This model has no age structure and use a constant rate of infections entering hospital (teal) and ICU (magenta).
August 6, 2021
BC COVID-19 Modelling Group
Hospitalization rates rise with cases (USA)
US is in a Delta wave, and hospital admissions (red) are rising with increasing case rates (green), despite high vaccination levels.
Daily cases and hospital admissions (x 10)
12August 6, 2021
BC COVID-19 Modelling Group
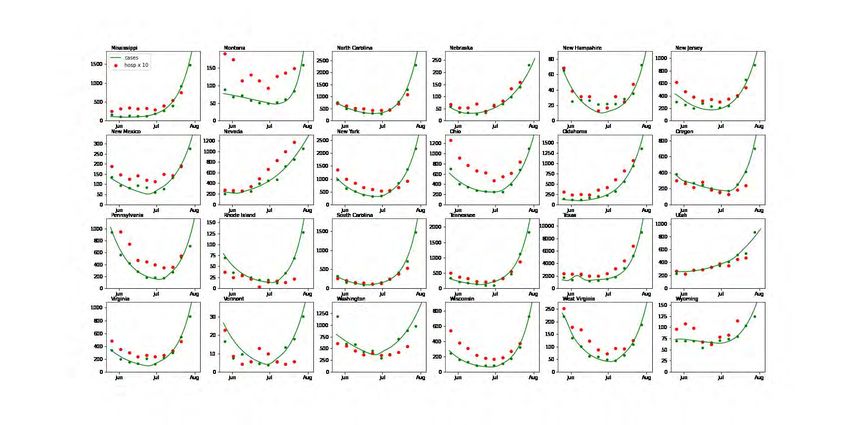
Hospitalization rates rise with cases (more states)
US is in a Delta wave, and hospital admissions (red) are rising with increasing case rates (green), despite high vaccination levels.
Daily cases and hospital admissions (x 10)
13August 6, 2021
BC COVID-19 Modelling Group
Closing the circle: Vaccination status by age
July 30th update includes data through July 24th, 2021
Slow progress on 1st doses: Fast progress on 2nd doses:
Fraction of BC’s population with Fraction of BC’s population who
at least one vaccine shows slow are fully vaccinated has been
growth, rising ~1% per week. rising ~8% per week.
Source (B. Wiley). Design by Blake Shaffer (https://blakeshaffer.shinyapps.io/app_vaccines/) BC Vaccination data from
https://health-infobase.canada.ca/covid-19/vaccination-coverage/, with area of each circle segment proportional to BC’s population in that age class. BC 2021 Population 14
projections for vaccination percentages from BC Stats: https://www2.gov.bc.ca/gov/content/data/statistics/people-population-community/population/population-projectionsAugust 6, 2021
BC COVID-19 Modelling Group
Closing the circle: Vaccination status by age
July 30th update includes data through July 24th, 2021
If vaccines were 100% effective:
Herd immunity if R0~6-7
{
Herd immunity if R0~5-6
{
Herd immunity if R0~4-5
{ Herd immunity: the level of
immunity in a population at which
a disease starts to decline*
→ (1-f) R < 1 where f is level of immunity
Reproductive number (R):
R0 for B.1.617.2 (Delta) number of new cases per case,
unknown but has been called R0 in the absence of any
estimated to be ~7*. control measures.
Source (B. Wiley). Design by Blake Shaffer (https://blakeshaffer.shinyapps.io/app_vaccines/) †https://bccovid-19group.ca/post/april-2021-report/ 15
*Burki (2021) Lancet. ✧Typically assumes no or minimal control measures.August 6, 2021
BC COVID-19 Modelling Group
Vaccination helps
Community Health Service Areas (CHSA) with higher vaccination rates have significantly lower daily case
counts in BC. Communities that are 70% vaccinated have five times higher rates of COVID-19 cases than
those with 90% vaccination.
Average daily case rate/100,000
(July 9 - 22)
p = 0.0013
permutation test
Vaccination % in CHSA
(at least one dose, 12+)
Source (S. Otto). BCCDC data portal’s surveillance dashboard data; see maps for regions
http://www.getvaccinated.gov.bc.ca 16
that would most benefit from community vaccination drives (accessed August 5, 2021)August 6, 2021
BC COVID-19 Modelling Group
Final messages
Recent growth in cases is predominantly in communities with lower vaccination rates,
with many communities in the Interior Health Authority at higher risk.
Delta (B.1.617.2) has been rising relative to other variants, consistent with a ~10%
growth advantage per day compared to Alpha.
Delta case growth has been extremely rapid in many other jurisdictions. There are now
clear signs of similar growth in BC.
Communities with lower vaccination rates are seeing five times as many cases as those
with higher levels of vaccination.
To reduce the growth of cases, we encourage continued use of masks in indoor public
settings, reduced exposure to poorly ventilated and crowded indoor environments, and
vaccination by all those who are able.
17You can also read