The Colorado Ultraviolet Transit Experiment
←
→
Page content transcription
If your browser does not render page correctly, please read the page content below
The Colorado Ultraviolet Transit
        Experiment (CUTE):
           A cubesat to study the
          most extreme exoplanets

@CuteCubeSat
                 Kevin France – University of Colorado
                    APAC Meeting, 15 March 2021
Extrasolar Planets:
Nplan(2021) Replace w/
~4300 Confirmed Venus transit
~200 Nplan(1999)
Radial Velocity Transits
Direct Imaging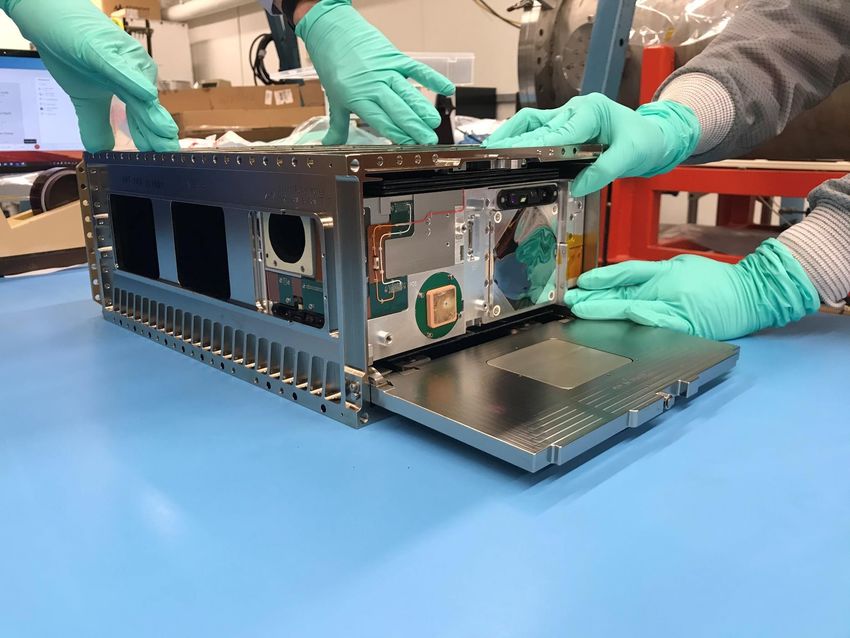
Hot Jupiter                        Super-Earth

WASP-18b, solar-type host          GJ 832c, red dwarf host
M ~ 10 MJ, R ~ 1.1 RJ              M sin(i) ~ 5.2 ME, R ~ 1.5 RE
a ~ 0.02 AU                        a ~ 0.16 AU
Teff ~ 2400 - 3100 K               Teff ~ 230 - 280 K
           (Hellier et al. 2009)                  (Wittenmyer et al. 2014)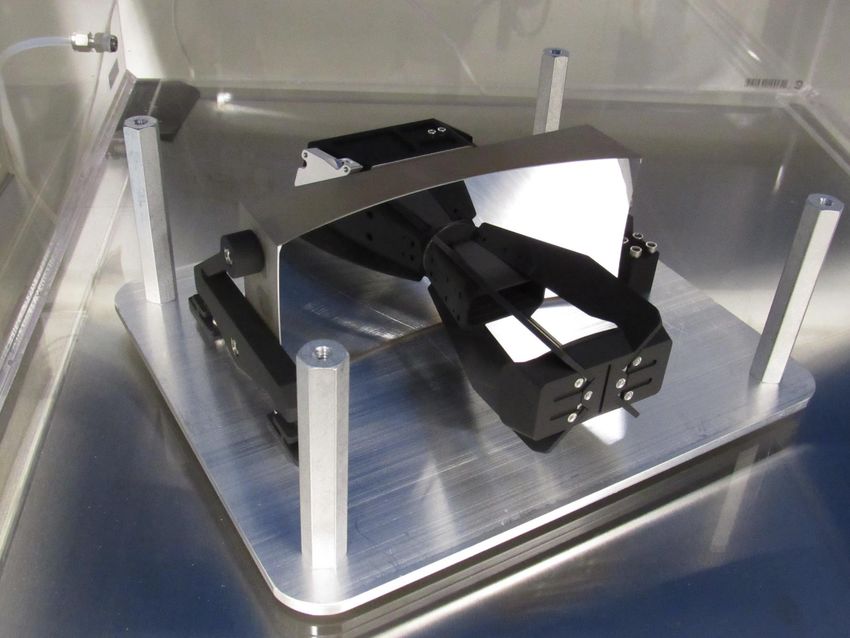
ATMOSPHERIC ESCAPE, NEAR AND FAR

                  •Escape alters ~all planetary
                  atmospheres

                  •The high-energy stellar emission
                  dominates atmospheric
                  photochemistry, ionization, and
                  heating

                  •Exoplanets are laboratories for
                  studying extreme mass loss that
                  no longer operates in the solar
                  system

                        Figure courtesy of
                        Paul Rimmer - Cambridge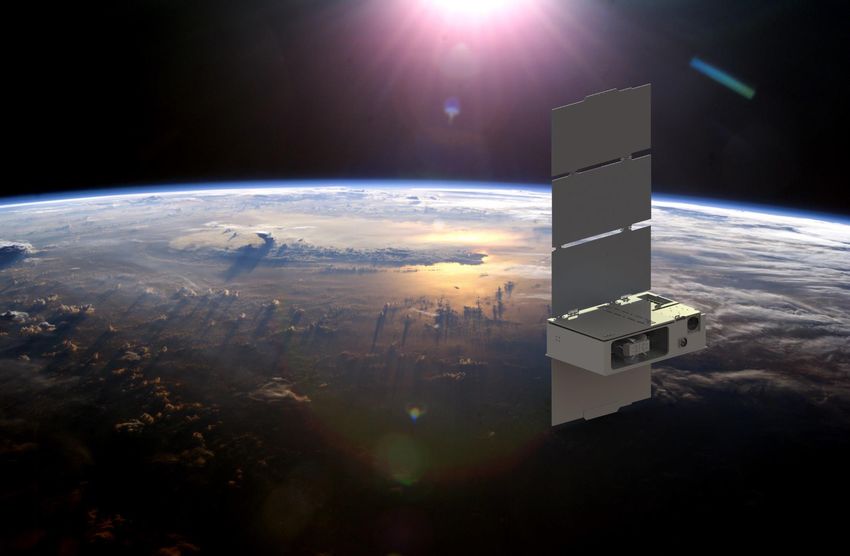
HOT JUPITER ATMOSPHERES
•EUV heating driving mass-loss from short-period planets
•Most spectacular example has been on the short-period
      Neptune-mass planet GJ 436b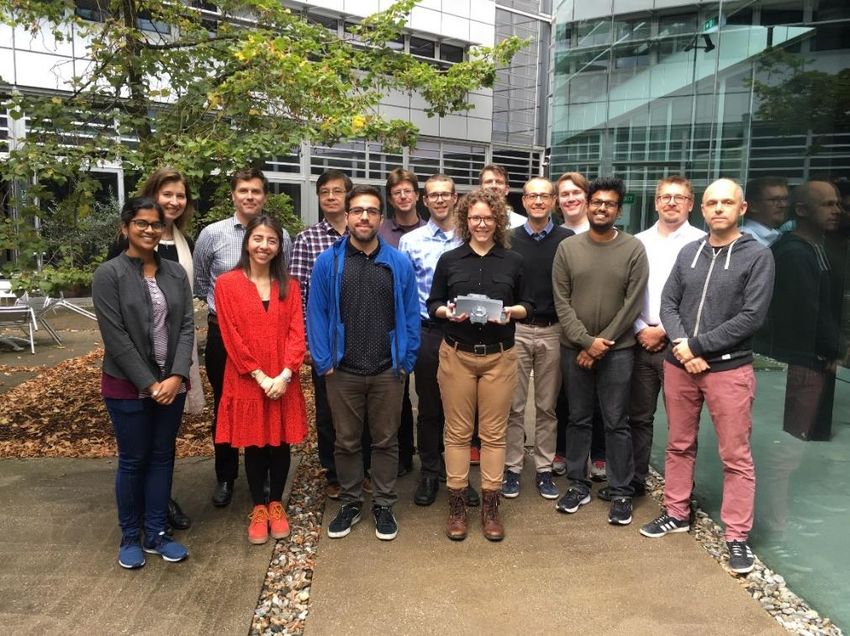
EXOPLANET ATMOSPHERES
•Narrow-band/spectroscopic transit analysis can probe
absorption by specific atmospheric constituents

                                                   Occultation
                                                    Depth =
                                                    (RP / R*)2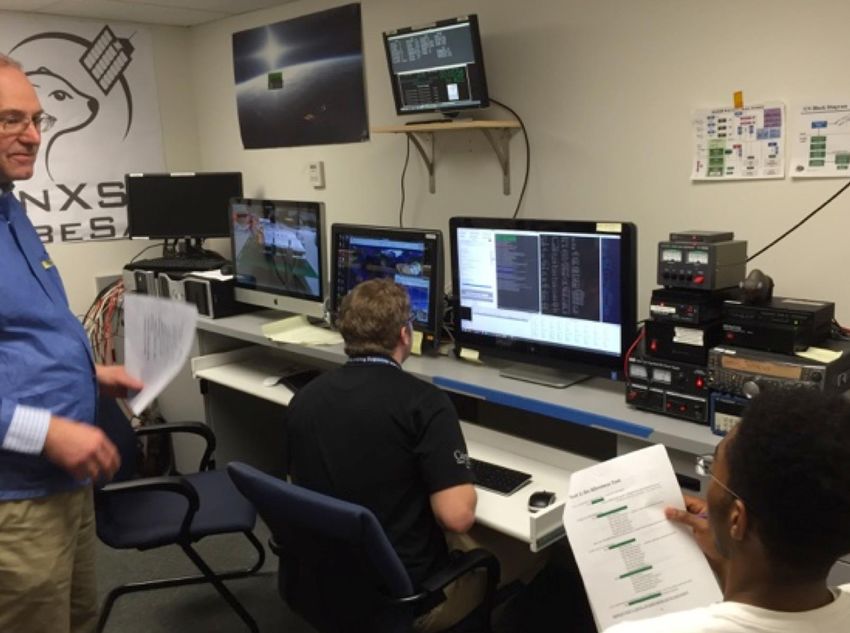
EXOPLANET ATMOSPHERES
•Narrow-band/spectroscopic transit analysis can probe
absorption by specific atmospheric constituents

                                                     Occultation
                              Atmosphere               Depth =
                                                     (RP(λ) / R*)2

                                           Transit Spectroscopy:
                                           in-transit vs. out-of-transit

                                           •Composition
                                           •Temperature structure
                                           •Velocity flows
                                           •Mass-loss rates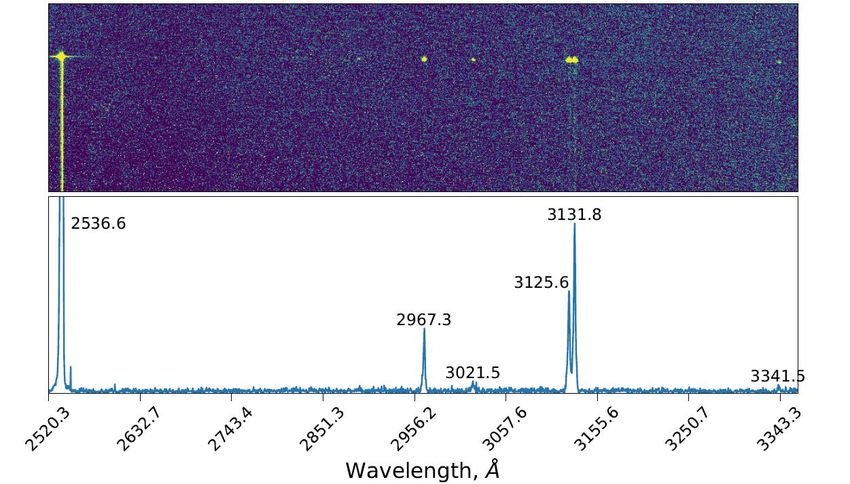
Transit Spectroscopy of Short-period Planets
•EUV heating driving mass-loss from short-period planets
•Most spectacular example has been on the short-period
      Neptune-mass planet GJ 436b

          Hydrogen escaping from the upper atmosphere of GJ436b
              (Kulow et al. 2014; Ehrenreich et al. 2015; Bourrier et al. 2016; Lavie et al. 2017)

                               Transit depth ~ 50% (!)
Extreme Exoplanet Atmospheres: challenges
•For the ~half-dozen Hot Jupiters measured with
Hubble, we often find conflicting results, even on the
same planet!

•: time-variability in the star(?), planetary mass-loss
rate (?), or apples-vs-oranges observations and data
reduction algorithms

Extreme Exoplanet Atmospheres: challenges
•Often discrepant results: time-variability in the star(?),
planetary mass-loss rate (?), or apples-vs-oranges
observations and data reduction algorithms

•Sample size of mass-loss measurements ~6, early-
ingress ~1, late-egress ~2

•Stellar baseline for transit
       measurements

•Self-consistent modeling framework
Extreme Exoplanet Atmospheres: challenges
•Often discrepant results: time-variability in the star(?),
planetary mass-loss rate (?), or apples-vs-oranges
observations and data reduction algorithms
•Sample size of mass-loss measurements ~6, early-
ingress ~1, late-egress ~2
•Stellar baseline for transit
measurements
•Self-consistent modeling frameworkExtreme Exoplanet Atmospheres: challenges
•Often discrepant results: time-variability in the star(?),
planetary mass-loss rate (?), or apples-vs-oranges
observations and data reduction algorithms
→ multiple, consecutive transits, single data pipeline
•Sample size of mass-loss measurements ~6, early-
ingress ~1, late-egress ~2
→ dedicated platform = more data
•Stellar baseline for transit
measurements
→ 0.25 phase coverage
•Self-consistent modeling framework
→ state-of-the-art, physically self-consistent modelsColorado Ultraviolet Transit
Experiment (CUTE)
University of Colorado:
Kevin France (PI), Brian Fleming (PS), Arika Egan,
Rick Kohnert (PM), Nicholas Nell, Stefan Ulrich,
Nick DeCicco, Ambily Suresh, Wilson Cauley
United States:
Tommi Koskinen (UofA), Matthew Beasley
(SwRI), Keri Hoadley (Caltech/Iowa)
Europe:
Jean-Michel Desert (Amsterdam), Luca Fossati
(ÖAW), Pascal Petit (UdeT), Aline Vidotto (TCD)CUTE: A NEW APPROACH TO ATMOSPHERIC
MASS-LOSS MEASUREMENTS
Survey of ~12-24 short-period
transiting planets around
nearby stars:
1) Atmospheric mass-loss
rates
23
2) Escaping atmosphere
compositionCUTE: A NEW APPROACH TO ATMOSPHERIC
MASS-LOSS MEASUREMENTS
• Most detections of atmospheric mass loss
have been carried out in the FUV, Lyα (e.g.
Vidal-Madjar+ 2004, 2013, Linsky+ 2010,
Ben-Jaffel+ 2007, 2013, Kulow+ 2014,
Ehrenreich+ 2015, Bourrier et al. 2018)
• Controversial interpretation due to low-S/N
and uncertain chromospheric intensity
distribution (e.g., Llama & Shkolnik 2015).
• The NUV has a more uniform,
mainly photospheric, intensity
distribution AND an overall brighter
background for transit observations, ~50-
1000x brighter. 24
Llama & Shkolnik 2015, 2016CUTE: A NEW APPROACH TO ATMOSPHERIC
MASS-LOSS MEASUREMENTS
• Most detections of atmospheric mass loss
Source: SDO have been carried out in the FUV (e.g. Vidal-
Madjar+ 2004, 2013, Linsky+ 2010, Ben-
Jaffel+ 2007, 2013, Kulow+ 2014, Ehrenreich+
2015, Bourrier et al. 2018)
• Controversial interpretation due to low-S/N
CUTE:
and uncertain chromospheric intensity
NUV Transit
distribution (e.g., Llama & Shkolnik 2015).
Spectrophotometry
• The NUV has both a more
uniform, mainly photospheric,
Krivova et al. 2006 intensity distribution AND an
overall brighter background for
transit observations, ~50-1000x
25
brighter.CUTE: A NEW APPROACH TO ATMOSPHERIC
MASS-LOSS MEASUREMENTS
• Brighter stellar flux enables
spectroscopy in a correspondingly
smaller platform
• Spectroscopy required to isolate
escaping gas species
WASP-121b; Sing et al. 2019
26Astronomy with Cubesats: Dedicated
Mission Architecture
30 cm
• CUTE: First NASA grant funded UV/O/IR astronomy cubesat
• Halosat X-ray cubesat (P. Kaaret, Univ. Iowa)
20 cm
• More widely used in Earth observing, education,
and solar physics (e.g. CSSWE, MinXSS – Mason et al. 2017)
6U
6U
10 cm
28
ASTERIA - JPL
France et al. (2020)Astronomy with Cubesats: Dedicated
Mission Architecture
CUTE:
11.0 cm x 23.7cm x 36.2 cm
Family Size Cheerios
available on Walmart.com:
7.8 cm x 23.9 cm x 34.4 cm
29
France et al. (2020)CUTE Telescope
Source: Nu-Tek Precision Optics See CUTE design overview in Fleming et al. (2018)
Geometric clear area for a Geometric clear area for a 20 x 8
9cm Cassegrain: AT ~ 47 cm2 cm Cassegrain: ACUTE ~ 140 cm2
CUTE ~ 3 x more collecting area
30
France et al. (2020), Egan et al. (2020)CUTE Science Instrument See CUTE design overview in Fleming et al. (2018), Egan et al. (2018)
CUTE Telescope (Flight)

                                                                      33

    See CUTE design overview in Fleming et al. (2018); Egan et al. (2018)
CUTE Telescope (Flight)
35
See CUTE design overview in Fleming et al. (2018); Egan et al. (2018)CUTE Telescope (Flight)
36
See CUTE design overview in Fleming et al. (2018); Egan et al. (2018)CUTE Operations: Student Ops Team
38Student & PI Training Opportunities
Suborbital Research Programs: end- Hands-on training in
to-end mission experience space hardware
Dr. Ambily Suresh Arika Egan Prof. Kevin France
Stefan Ulrich Nick DeCicco Prof. Brian Fleming
CUTE Science Team, Oct 2019Integrated CUTE Science Instrument
40
See CUTE design overview in Fleming et al. (2018); Egan et al. (2018)CUTE Spacecraft: Blue Canyon Technology
41
See CUTE design overview in Fleming et al. (2018); Egan et al. (2018)CUTE Spacecraft Testing
43
See CUTE design overview in Fleming et al. (2018); Egan et al. (2018)CUTE End-to-End Testing
46
See CUTE design overview in Fleming et al. (2018); Egan et al. (2018)CUTE End-to-End Testing
Instrument Sensitivity:
Aeff = AT R5 εgrat QED = 20-25 cm2
47CUTE Measured Performance
Flight
Components
Instrument Sensitivity:
50
Aeff = AT R5 εgrat QED = 20-30 cm2
R ≈ 2000CUTE Predicted Science Data
CUTE will achieve >3σ detections of transits as low as 0.1% depth for the brightest
targets. Transit depths < 1% for all baseline targets with 5+ lightcurves per target.
Continuum transit sensitivity to 0.7% depth for median target over 1 transit
51
= Capable of detecting geometric transit and atmospheric transitCUTE Predicted Science Data
CUTE will achieve >3σ detections of transits as low as 0.1% depth for the brightest
targets, and < 1% for all baseline targets with 5+ lightcurves per target:
Continuum transit sensitivity to 0.7% depth for median target over 1 transit
52
= Capable of detecting geometric transit and atmospheric transit
Egan et al. (2020)CUTE Status
53CUTE
Sept 2021
54CUTE Status
• Proposed ROSES D.3 APRA - March 2016
• Selected February 2017, funded July 2017
• Science Team face-to-face meetings:
Oct 2017, Nov 2018, Oct 2019, (Dec 2020)
• Assembly, test, calibration: almost complete
• Environmental Testing: April/May 2021
• Launch Late Q3-2021
• 8 Month Baseline mission:
• 12 exoplanetary systems, 6-10 transits each
• 12 – 20 additional systems in 12 month
extended mission 55
@CuteCubeSatEND
CUTE Example Target Visibility List

PI – France
You can also read