Where is the happy transit rider? Evaluating satisfaction with regional rail service using a spatial segmentation approach
←
→
Page content transcription
If your browser does not render page correctly, please read the page content below
Where is the happy transit rider? Evaluating satisfaction with
      regional rail service using a spatial segmentation approach

                                           Emily Grisé
                                           School of Urban Planning
                                           McGill University
                                           Suite 400, 815 Sherbrooke St. W.
                                           Montréal, Québec, H3A 0C2
                                           Canada
                                           Tel.: 514-398-4058
                                           Fax: 514-398-8376
                                           E-mail: emily.grise@mail.mcgill.ca

                                           Ahmed El-Geneidy
                                           School of Urban Planning
                                           McGill University
                                           Suite 400, 815 Sherbrooke St. W.
                                           Montréal, Québec, H3A 0C2
                                           Canada
                                           Tel.: 514-398-4058
                                           Fax: 514-398-8376
                                           E-mail: ahmed.elgeneidy@mcgill.ca

                                             October 2017
For Citation Please use: Grisé, E., & El-Geneidy, A. (accepted). Where is the happy transit rider?
Evaluating satisfaction with regional rail service using a spatial segmentation approach. Transportation
Research Part A: Policy and Practice.

                                                                                                           1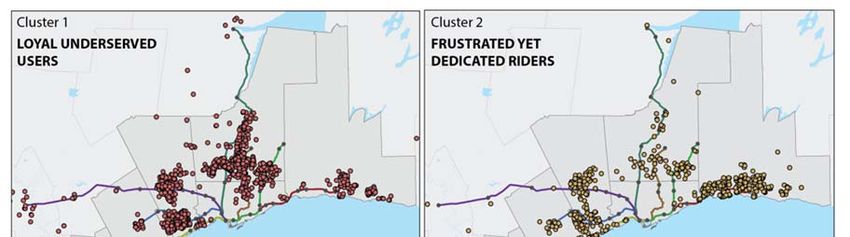
ABSTRACT
Public transit agencies are delivering transport services in a rapidly changing and highly
competitive transportation market. Ensuring rider’s satisfaction in such an environment has led
several public transit agencies to adopt different marketing strategies. For example, market
segmentation analyses are commonly employed by transit agencies to identify groups of users,
which are subsequently used as a base for developing policies and strategies aimed at improving
customer satisfaction. However, previous studies adopting this market segmentation approach
have predominantly ignored spatial and contextual factors related to the transit network and the
built environment of where a user resides, resulting in network-wide policies that are difficult to
implement especially for agencies with scarce resources. This study presents a new segmentation
approach that incorporates spatial and contextual factors in addition to other rider’s preferences
and satisfaction levels with commuter rail service in the Greater Toronto and Hamilton Area,
Canada. Including these factors in a market segmentation analysis has enabled us to recommend
service interventions at a local and finer scale compared to previous studies, while at the same
time providing the greatest impact on a specified segment of riders. This research provides
transit planners and policy makers with a spatial segmentation approach, which can be used to
maximize the benefits of service improvements intended to increase satisfaction with public
transit among certain groups of users in a region.

Keywords: Customer satisfaction; Market segmentation; Spatial analysis; Public transit

                                                                                                 2
INTRODUCTION
Delivering high quality, affordable, and efficient urban public transport service that is equally
beneficial to all residents is a major feat that cities are striving for globally. Transit agencies are
continuously determined to achieve a balance between economic efficiency of the provision of
service and delivery of a desired level of service. The success of a transit agency can be
measured by the number of satisfied passengers using the service and who will continue to use
the service in the future (1). Accordingly, regular monitoring of customers’ perception of service
through the collection of customer satisfaction surveys is one of the most widely used and
recognized tools in the industry to directly capture the customers’ perception of service quality
(2; 3). Customer satisfaction is a subjectively measured quality of service indicator, which is
perceived as an important determinant of a users’ travel demand (4). Improvements in
passengers’ satisfaction is generally associated with higher levels of consumer loyalty (5), and
customers who are satisfied with the service are more likely to continue to use transit at the same
or a higher level of frequency, and positive experiences with service are likely to be
communicated to friends and family (3).
        In order to design and prioritize transport strategies that can improve service quality,
considerable research has been conducted to identify which service attributes have the strongest
influence on the overall assessment of service quality (1; 2; 6-8). However, transit agencies must
acknowledge that there are different groups of transit riders, who have different needs and
expectations (9-11). Traditionally, transit market research has categorized transit users as either
captive or choice riders according to their vehicle access and travel behaviour (12-14). While
more recent research started to segment the market further by incorporating additional factors
such as attitudes and personal motivations, travel behavior and trip details and socio-
demographic information in order to develop more specific policy recommendations targeted
towards each group (15-18). Yet such an approach to market segmentation leads to the
generation of system-wide policies that require an abundance of resources to implement, while
only the targeted segment of the market will benefit from this policy.
        Transit agencies with scarce resources need to prioritize strategies in certain areas in the
region that can target concentrations of certain segments of riders, or to allow agencies to
prioritize service interventions in areas where high proportions of socially vulnerable individuals
that are dependent on transit service. Accordingly, this study builds off the current practice of
public transit market segmentation by incorporating spatial and contextual factors, related to
where each user lives and the service they frequently use, in addition to satisfaction levels and
personal characteristics. This approach generates geographically sensitive segments of users
where policies can be applied to target a certain segment of the transit market either due to its
need or due to its level of satisfaction. This study uses customer satisfaction survey data
collected from commuter train users in the Greater Toronto and Hamilton Area (GTHA), Canada
to demonstrate this new geographically sensitive public market segmentation approach. It also
shows the value of implementing such an approach through recommending service interventions
at a local and finer scale compared to previous studies.

                                                                                                     3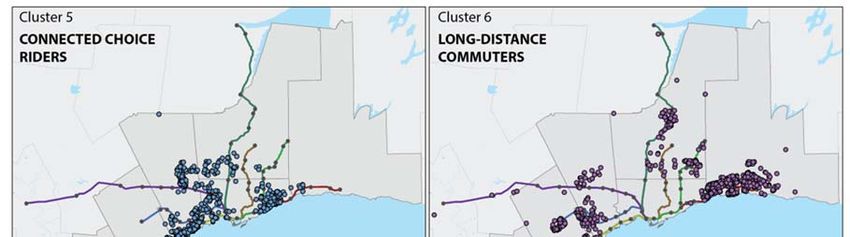
The following section of this paper provides a detailed review of literature relevant to
customer satisfaction and market segmentation approaches. Next, the case study and data
included are described, which is followed by an outline of the statistical methods applied to
geographically segment users in our sample. This is followed by the results of the geographically
sensitive segmentation analysis. Lastly, a discussion of policy recommendations specific to each
segment is demonstrated in an effort to show how a transit agency with scarce resources can
increase satisfaction through targeting policies in certain areas in a region that are dominated by
a specific group of users.
LITERATURE REVIEW
Various public transit agencies are trying to be competitive in the rapidly changing transportation
market through applying market-oriented strategies. Market-oriented strategies are employed by
these agencies to ensure ridership retention through increases in customer satisfaction (19).
Customer satisfaction as defined by Anderson (20) is the difference between a customers’
perceptions and expectations of the service they received. Accordingly, high customer
satisfaction results when service performance meets or exceeds the customers’ expectations or
desired standard of service. However, developing valid and accurate constructs of service quality
is complicated by the fact that a customers’ evaluation of quality is a rather elusive concept to
measure, which is particularly complicated by intangible service attributes (21). Intangible
service attributes in the public transit market include safety, comfort and cleanliness, whereas
factors such as service reliability or on-time performance are more tangible measures of service
quality. Accordingly, the measurement of service quality remains challenging for public transit
agencies (2), which is exacerbated by research that indicates that the perception of service
quality and the relative importance of service attributes vary among groups of users (9). The
heterogeneity among individuals and the differences among attitudes towards transit or personal
desires requires the use of segmentation analyses that accounts for travelers attitudes and
behaviours (10).
         Segmentation analyses are employed by transit agencies to identify different types of
users who have similar characteristics, and the resulting segments of users can serve as a base for
future marketing strategies (22). At its most basic, segmentation analyses categorize people
according to socio-demographic variables and transport use, however these measures have been
found to oversimplify the market (23). Psychological factors, such as perceptions, attitudes and
habits, have shown to be important factors for understanding travel behavior (24), and users’
perception of service quality has been linked to continued use of a service (25). Building off this
knowledge, Krizek and El-Geneidy (12) employed a market segmentation approach to uncover
groups of both users and non-transit users that have similar travel habits and preferences towards
public transit. The authors identified captive and choice transit riders who were distinguished by
their frequency of use and identified recommendations for how to market transit service most
effectively to increase satisfaction among each group. Tyrinopoulos and Antoniou (26)
segmented respondents by their sex to evaluate differences in perceptions and the relative
importance of service attributes between these groups. More specific to satisfaction levels among
                                                                                                 4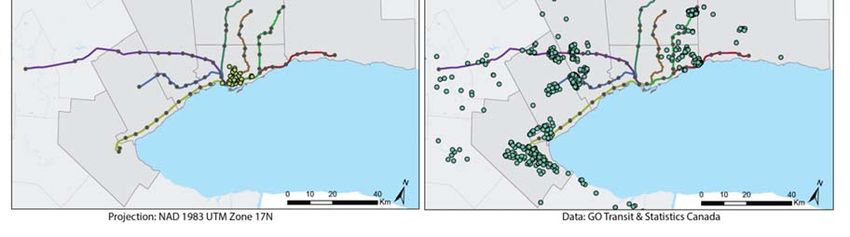
users of a suburban commuter rail service, De Ona et al. (27) categorized types of users
according to their frequency of use and travel time in a typical day. Following the identification
of groups of users, the authors applied a classification and regression tree approach to identify
which service characteristics have the most significant influence on overall service quality. This
approach to evaluating the relative importance of service characteristics among stratified groups
of users has been applied in other contexts (17).
        Lastly, Abenoza, Cats and Susilo (28) segmented current and potential public transit
users across Sweden according to socio-demographics, travel patterns and accessibility measures
(job accessibility and accessibility to amenities). Then the authors determined the proportion of
each segment found regionally and the relative importance of key service attributes specific to
each segment, and satisfaction levels with public transit performance. Similar to research by
Diana (29) who considered population density when analyzing satisfaction levels of multimodal
travelers, individuals residing in smaller, low-density regions expressed higher levels of
satisfaction than those in larger urban areas, which include cities with more extensive networks
and more frequent service. Abenoza, Cats and Susilo (28) speculated that this is a result of
factors affecting service attributes in urban regions such as congestion, crowding and stress
levels. However, Diana (2012) suggested that more conclusive results could have been drawn
from incorporating information regarding individuals’ mobility patterns when using public
transport.
        The real value of market segmentation for transport agencies lies in its ability to be
translated into achievable strategies to increase satisfaction levels among different groups.
However, a limitation of the literature discussed above is the ability to recommend targeted
interventions across the transit network, or where to prioritize service improvements, which is
crucial information for transit agencies with limited resources. Accordingly, in this study we will
build on the segmentation strategies employed in previous research by including detailed data
related to where each user lives, and information on the service they frequently use. To the best
of the authors’ knowledge, this level of detail, regarding spatial and contextual factors, has not
been applied for the segmentation of transit users in the past to spatially target interventions and
policy recommendations for improved service quality and customer satisfaction.

DATA
Data used in this study was collected by GO Transit, the regional public transit provider for the
Greater Toronto and Hamilton Area (GTHA). GO Transit consists of a network of commuter
trains and a regional bus service, covering an 11,000-square-kilometer area, which carries over
271,000 people daily, as of 2015. Around 80% of GO Transit customers use the train network.
As shown in Figure 1, GO Transit offers service along seven rail corridors, and currently has 62
stations where the majority of stations are located in suburban or semi-rural areas. Go Train
service is predominantly structured to bring passengers from all seven train lines into Union
Station in the morning (which is a major intermodal transportation hub located in the heart of
downtown Toronto) and bring passengers back to the suburbs during the evening commute.
                                                                                                  5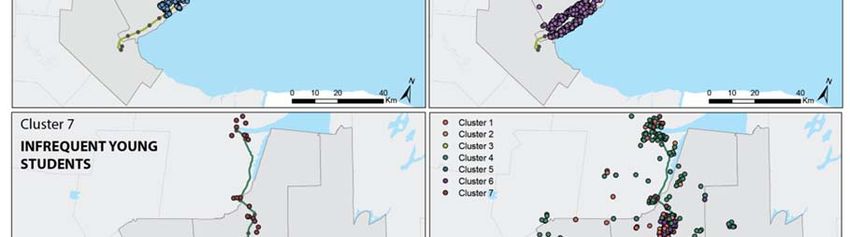
Figure 1. GO Transit Train system map

         GO Transit conducts quarterly surveys to measure customer satisfaction and loyalty
among existing users. These surveys were administered through either paper surveys or online.
Only customers who have travelled on a GO Train or GO Bus in the last year were asked to
complete the survey. GO Transit provided the results of eight years of surveys, of GO bus and
train users, although in this study, only users who stated using the GO Train in the past year were
included in our sample. GO Transit’s customer satisfaction survey is designed to ask customers
about their overall experience with GO Transit over the past year, in other words all satisfaction
responses were designed to be derived from a users’ collective experience with transit over the
past year. The survey began with broad questions about the users’ overall satisfaction with GO
Transit, their loyalty to GO Transit, satisfaction with GO Train service, and satisfaction levels
with specific service attributes, and lastly personal characteristics. The initial sample of train
users was 16,902, however over time the questionnaire was modified, consequently, only surveys
with questions that were asked in a consistent manner and that contained our questions of interest
were used for further analysis. This provided us with a final sample size of 4,750 complete
responses, of data collected between 2011 and 2016.

                                                                                                 6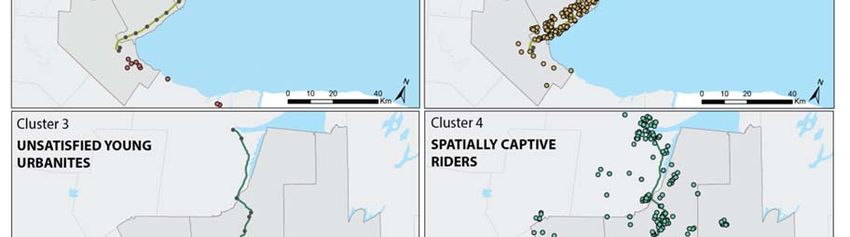
The goal of this study is to demonstrate how a geographically sensitive segmentation
exercise of GO Train users can be conducted, according to each train users’ travel behavior,
satisfaction levels, personal and socio-demographic characteristics, and geographic and
contextual factors. Using each respondents’ home postal code, the following geographical
variables were collected: distance to Union Station (the heart of downtown), distance from a
users’ home to the nearest GO Train (commuter train) station, average morning peak train
service frequency of that nearest train station, accessibility to parking spaces and occupancy
rates, job accessibility within 45 minutes by transit, and the average commute distance of the
Census Tract where each user lives.
         Union Station, as shown in the GO Transit system map (Figure 1), is the convergence
point of all the train lines, and was therefore used as the reference point for the distance to
downtown variable considered in the analysis. Approximately 95% of GO Train customers travel
to or from Union Station (30), which characterizes travel patterns on the GO Train network. The
network distance between the residence of each GO train user in the survey and the nearest train
station along the line he or she uses to commute was measured and linked to the morning peak
frequency of that station. Peak frequency was determined using schedules obtained from the
General Transit Feed Specification (GTFS) (April 2017 schedule). Peak frequency is defined as
the number of trains passing through each station in an hour during the morning peak period (6
AM until 9 AM).
         Station access has been previously found to be an important driver of satisfaction with
rail trips (31; 32). Park-and-ride facilities are a critical component of GO Transit’s service,
considering that stations are located in suburban and semi-rural locations with stop spacing
reaching between 4 to 6 km (33). As a result, approximately 67% of users accessed a GO Train
station by driving and parking in 2015 (34). Accordingly, we constructed a measure of
accessibility to parking spaces. This measure is derived by identifying the 3 closest stations
within 10 km of each user’s residence, and calculating the average capacity and utilization rates
of these parking lots. Monthly parking capacity and utilization rate data for years 2010 to 2016
were provided by Metrolinx, and this data were averaged across the years to contextualize
parking availability for different users. A 10 kilometer cutoff was chosen since termini stations
have been found to draw passengers from distances of 10 km and greater, although stations
located in denser neighbourhoods closer to downtown Toronto typically have smaller catchment
areas (33). Furthermore, Iacono, Krizek and El-Geneidy (35) found that the threshold distance
for transit trips with auto access was 10 kilometers, and that few users would access train stations
from farther distances.
         The next geographic variable we considered in the analysis was accessibility to jobs by
transit. Two main data sources were used, the 2011 National Household Survey (NHS)
commuting flows data provided by Statistics Canada, and the most recent GTFS data provided
by each transit agency in the GTHA. A cumulative accessibility measure at the census tract (CT)
level was calculated to determine the number of jobs an individual can reach by public transit
within 45 minutes of travel. Travel time data across the GTHA were calculated using GTFS data

                                                                                                  7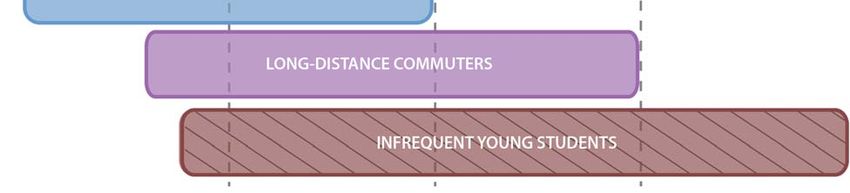
extracted from GO Transit, and the 10 local transit agencies which operate in the GTHA. Travel
time for four departure times were calculated: 7:00, 7:15, 7:30 and 7:45 AM, and the lowest
travel time was selected for each CT pair. We selected the minimum travel time largely for cases
where a train operates on an hourly or twice-hourly basis, and since waiting time is built into the
travel time calculation, this would significantly overestimate travel time in these cases. Within
the travel time calculation, access, in-vehicle travel time, and egress times are included, however
walking was the only mode considered for access to stations, which might underestimate
accessibility levels for individuals who drive to train stations. Using these travel times, the
number of jobs accessible by GO Transit (only) and regional transit (including GO Transit)
within 45 minutes were then calculated for each CT. The final variable included in our analysis,
was the average commute distance of each CT, which was calculated using the 2011 NHS
commuting flows data.
         These contextual variables were selected to describe and capture differences in where
users live across the GTHA and what level of service and public transit options are available
which might impact satisfaction levels. From the customer satisfaction survey, we know how
frequently each person travels by GO Train on an average week, and at what time of day they
typically travel and whether trips are commonly made on weekdays or weekend. While we do
know which train corridor each user is most frequently traveling on, we do not know where they
most often travel, and how this may impact a users’ overall satisfaction with GO Transit service.
ANALYSIS
In this study, a two-step approach to segment different groups of users within the study sample
according to their travel behavior, satisfaction levels, personal and socio-demographic
characteristics, and contextual variables was used. First, a factor analysis was used to derive
factors of related survey questions and geographic data. Second, K-means cluster analysis was
employed to group respondents into similar groups. This method, which is also known as factor-
cluster analysis is described in further detail in the following sections, and the resulting clusters
are described and mapped to allow for further analysis of each group of users.
Factor Analysis
Factor analysis, or more specifically Principle Component Analysis (PCA), is a commonly used
statistical technique to identify factors of related questions or data, from a large set of data that
contains questions with a relatively high correlation among responses. It is often used in studies
working with large survey data (23; 26; 36), as it helps researchers to evaluate and identify
patterns of how different variables relate to one another, and therefore reduces the number of
variables analyzed. In this study we linked the various contextual characteristics to each rider’s
response and included these geography specific variables in the factor analysis alongside the
questions from the satisfaction survey.
         Varimax rotation was used to derive factors, and the criteria, eigenvalues greater than
one, was selected to determine the number of suitable factors. Variables that did not group with
other questions were removed. Six factors resulted from the PCA, and the name of each factor,

                                                                                                   8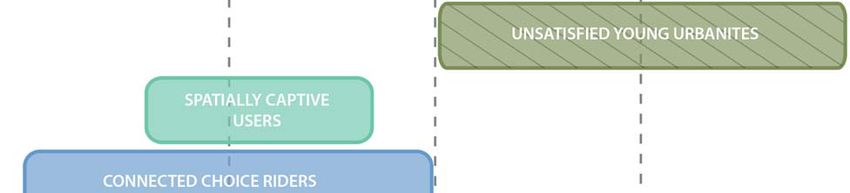
included variables and factor loading are presented in Table 1. These six factors collectively
explain 61% of the variance in the original values. To interpret factor loadings, the closer the
absolute value is to 1, the stronger the relationship between the variable and the factor as a
whole.
       As seen in Table 1 some contextual factors were grouped together like the accessibility to
jobs variables, while others were grouped with some satisfaction question like the satisfaction
with parking availability and parking occupancy near the residence of the user. The factor
loadings for each factor was then saved giving each surveyed person a score that represents his
answer to a question or his contextual characteristics or a combined score for both. These factor
loadings were then used in the next section to generate different groups of commuter train users.

TABLE 1. Results from the Principle Component Analysis
      Factors                          Survey Question or Variable                              Loading
                   How satisfied are you with your personal safety in train stations?            0.818
                   How satisfied are you with the cleanliness of stations (other than Union
                     Station)?                                                                      0.789
                   How satisfied are you with GO Train stations overall?                            0.585
  1. Satisfaction  How satisfied are you with helpful and friendly staff (at train stations
 with service and    other than Union Station)?                                                     0.770
  train stations   How satisfied are you with helpful and friendly staff (Union Station)?           0.752
                   How satisfied are you with the lighting in the parking lots?                     0.786
                   How satisfied are you with your personal safety in the parking lots?             0.778
                   How satisfied are you with helpful and friendly staff (on-board trains)?         0.729
                   How satisfied are you with the cleanliness on board trains?                      0.700

                                                                                               9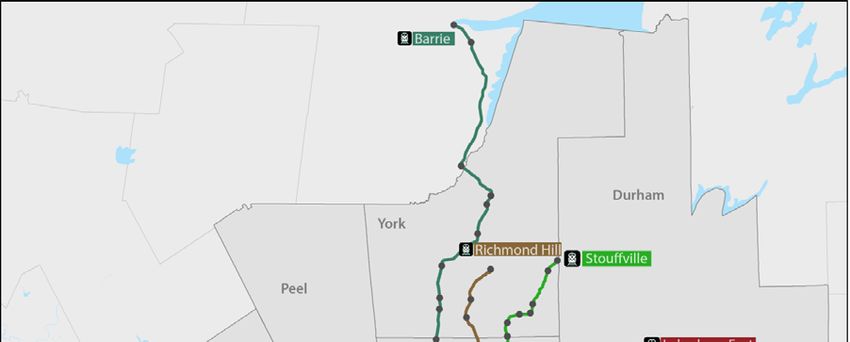
How satisfied are you with the temperature on trains?                                                 0.646
                    How satisfied are you with communication of service delays?                                           0.588
                    How satisfied are you with sufficient fare inspections?                                               0.564
                    How satisfied are you with availability of seats?                                                     0.437
                    How likely you will be to recommend GO transit to a friend/colleague?                                 0.795
   2. Loyalty and   How likely you will be to continue to take GO Transit?                                                0.698
overall GO Train How would you rate your level of satisfaction with GO Transit overall?                                   0.787
     satisfaction   How satisfied are you with GO Train service overall?1                                                 0.763
                    How satisfied are you with trains running on time?                                                    0.622
  3. Accessibility  Number of jobs accessible within 45 minutes by regional transit service.                              0.941
  and commuting Number of jobs accessible within 45 minutes by GO train service only.                                     0.915
      behaviour     Average commuting distance of census tract.                                                          -0.595
                    Hourly GO Train frequency during the morning peak (6 - 9 AM).                                         0.757
4. Level of service Accessibility to parking spaces.                                                                      0.711
                    Ratio of regional transit accessibility and accessibility by GO transit.                             -0.629
                    What is your total household income before taxes? (Over $100,000)                                     0.656
5. Financial status
                    What time of day do you typically board your GO train? (Peak periods:
    and personal
                       before 8:30 AM, 3:30 PM to 5:30 PM)                                                               0.614
 travel behaviour
                    What is your current employment status? (Student)                                                    -0.593
   6. Satisfaction  Average parking occupancy at nearest 3 stations within 10km.                                          0.820
with parking and
       parking
     occupancy      How satisfied are you with the availability of parking spaces?                                       -0.479

Cluster Analysis
Using the six factors described above, K-means cluster analyses were performed with the intent
to uncover how these factors combine to identify different types of users. This method of
segmentation is common in previous literature (12; 16; 37; 38). Using the K-means cluster
analysis in the Statistical Package for the Social Sciences (SPSS), the scores of the six factors
were used to generate geographically sensitive groups or clusters of different users, based on the
distance and similarity among factor scores. To determine the most appropriate number of
clusters, we tested a range of cluster values from four to ten clusters. We also tested different
combinations of variables within the factor analysis and removed select variables that were
perceived to dominate the cluster formation, especially from a geographical perspective, such as
distance to Union Station. Furthermore, because our sample contains surveys collected between
2011 and 2016 we checked for bias among clusters, to ensure that a cluster was not dominated by
responses from one survey year. We concluded that seven distinct and recognizable clusters of

1
 Please note, that satisfaction with GO Transit overall is referring customers to the entire transit network including
bus and train service, while this question is specific to GO Train service.

                                                                                                                    10
GO Train riders existed in our sample, according to their respective scores on various
components such as satisfaction levels, socio-demographic characteristics and geographic
location.
The seven clusters are presented in Figure 2, where the bars represent the relative value
of the six factors described in Table 1, and below the percentage of users found in the cluster is
displayed. The bars describe whether these users are positive or negative towards a factor. For
example, unsatisfied young urbanites score very highly in the accessibility and commuting
behaviour factor, as these users live in neighbourhoods with very high accessibility to jobs by
public transit. Before describing these seven clusters in greater detail, the home postal code of
users in each of the seven clusters is displayed in Figures 3 and 4.
Figure 2. Clusters derived from principle component analysis
11Figure 3. Home location of users in clusters 1 - 4
12Figure 4. Home location of users in clusters 5 -7, and an overview map of all users segmented
by cluster
In the following section we will be describing the main characteristics of each cluster and
the type of recommendations that can be derived from understanding the levels of satisfaction
among different factors. Furthermore, where these recommendations can be implemented in the
region is discussed, to show the value of including geographic information to a transit market-
segmentation approach and how it can lead to more geographically sensitive policies.
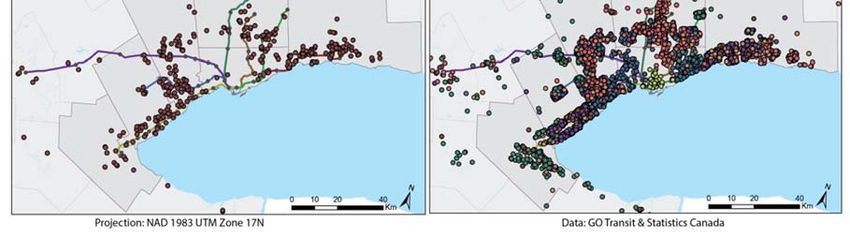
Cluster 1: Loyal underserved users
Loyal underserved users (24% of the sample) are characterized by their positive perception of
train stations, including the cleanliness of stations, personnel, and personal safety at train
stations. With regards to service characteristics on-board trains, these users are very satisfied
with the cleanliness and personnel. Where service improvements are needed for these riders are
on-time performance (mean of 7.9 out of 10), seat availability (mean of 6.6 out of 10) and
communication of delays (mean of 7.4 out of 10). Loyal underserved users are among the most
frequent users of GO Train service, where 99% of these users commute at peak times during the
week. Stated future usage among these riders is very high (mean of 9.2 out of 10), and these
13respondents are very likely to recommend the GO Train service to family or friends (mean of 8.5
out of 10).
On average these users live 37 km from Union Station, and live approximately 5 km from
a train station with low morning peak frequency (2.6 trains an hour). Interestingly, this cluster
contains 77% of respondents who most regularly use the Richmond Hill corridor, which is the
only corridor to most cleanly fit into one cluster. The ratio between accessibility to jobs by GO
Transit and all regional transit service is 3.6, which indicates that the GO Transit service is well
integrated with the local transit service. In other words, these users can reach significantly more
jobs if they combine GO Transit service with local transit service. In terms of parking, these
users on average have access to 2870 parking spaces within 10 km, however parking at nearby
stations are almost at capacity. During the study period, the average parking occupancy of these
stations was 93%, which compared to other clusters is the highest parking occupancy rates. The
oversaturation in parking lots experienced by these users is reflected in their very low score for
satisfaction with available parking (mean of 5.9 out of 10).
Recommendations:
A major improvement to these users’ satisfaction levels, is to alleviate dissatisfaction with
parking availability. Sustainable means of decreasing the demand for parking would include
increasing the number of riders who access the station via local transit service, walking, cycling
or car-pooling. Perhaps, while the regional transit accessibility is well integrated with the GO
network, there are currently barriers preventing more users from using transit, such as
inconvenient connections, or the cost of the regional transit service in addition to the GO Transit
fare, while parking is free. Poorly timed connections between local public transit and GO Train
service would be exacerbated by the low service frequency. Other barriers that may prevent
alternative means of station access include poor cycling and walking infrastructure, or a lack of
secure bicycle parking.
Cluster 2: Frustrated yet dedicated riders
Frustrated yet dedicated riders (14% of the sample) are highly dissatisfied with service
characteristics and stations. Most notably, very low satisfaction with seat availability (mean of
4.9 out of 10), communication of delays (mean of 4.6 out of 10), personal safety in parking lots
(mean of 4.6 out of 10) and on-time performance (mean 6 out of 10) were reported by these
users. Accordingly, overall satisfaction scores of train service are low (mean of 6.3 out of 10),
and these riders are the least likely to recommend the service to others. Despite the very low
satisfaction levels expressed by this group, they are still highly likely to continue to use the
service in the future (mean of 8.4 out of 10). A major concern expressed by these users is their
level of satisfaction with available parking spaces, with the lowest mean value of all clusters
(mean of 4 out of 10). These users have very high access to parking spaces, with a mean value of
4939 spaces within 10 km, and during the study period these parking lots had occupancy rates of
approximately 89%. In comparison to cluster 1, with the highest parking occupancy rates but
significant lower access to parking spaces (2870), these users are least satisfied with available
14parking, which can potentially be explained by their higher accessibility to parking spaces.
Living in proximity to stations with such high volumes of parking spaces, potentially prevented
these users from considering other means of accessing stations. Frustrated yet dedicated riders
are very frequent users of GO Train service, who travel at peak times. The level of service
experienced by the frustrated yet dedicated riders is an average of 4.3 trains per hour during the
morning peak.
Recommendations:
To increase satisfaction and loyalty among these riders, considerable efforts are needed to
address crowding, safety, communication of delays and available parking. The majority of these
users frequently take the Lakeshore East Line, and would benefit from the introduction of short
turn trains at peak hours, in order to reduce the levels of crowding along busy train corridors.
Cluster 3: Unsatisfied young urbanites
Unsatisfied young urbanites make up 1% of the study sample and are distinguished by their
proximity to Union Station, their low levels of satisfaction and loyalty, and demographic
characteristics. These users are concentrated in downtown Toronto, and live an average distance
of 3.4 km from Union station. These users have the highest levels of accessibility to jobs by GO
Transit and all regional transit service. Unsatisfied young urbanites tend to be infrequent users
who mostly travel at off-peak times, and travel the least of all clusters during the weekday
(65%). Perhaps, their high access to transit service in Toronto, which is operated by the Toronto
Transit Commission (TTC), would fulfil their daily travel needs for those who live and work in
downtown, and GO Transit would allow for efficient inter-regional transit for other trip
purposes.
Relative to other users, the unsatisfied young urbanites express low levels of loyalty, and
satisfaction with train stations and service characteristics. Namely, these users express low levels
of satisfaction with fare inspections (mean of 7 out of 10), communication of delays (mean of 7
out of 10), and on-time performance (7.4 out of 10). Their likelihood of future usage is low
relative to other groups (mean of 8.3 out of 10), and are moderately likely to recommend service
(7.8 out of 10). The relatively low levels of loyalty expressed by these users may be a result of
their loyalty to TTC service, making GO Transit their secondary mode of travel by public transit.
Accordingly, better integration of these transit services may strongly impact these users,
including fare integration. Currently, riders pay full fares for both TTC and GO Transit, which
may deter these users from making shorter trips by GO Transit due to the high costs incurred by
users. Fifty-six percent of unsatisfied young urbanites are under the age of 35, mostly with a
household income of less than $50,000. Furthermore, 14% of these users stated their
employment status as student.
Recommendations:
Frequency of travel among this group and satisfaction levels would likely increase from higher
levels of service at off-peak hours and weekends as well as greater service frequency for reverse
15commuters. Go Train service is structured to bring passengers from all seven train lines into
Union Station in the morning and bring passengers outwards to the suburbs during the evening
commute. Since these users live close to Union Station, GO Train service is potentially not
meeting their travel needs. Furthermore, fare integration with the TTC may increase the ridership
among these young urban travelers, and would likely attract potential riders to GO Transit.
Cluster 4: Spatially captive users
Spatially captive users (16% of the sample) are distinct from other clusters as they live in areas
with the lowest levels of job accessibility by public transit. Furthermore, this group lives the
furthest distance from Union Station (58 km on average), and live an average distance of 7.6 km
from a GO Train station, which is distinctly higher than other clusters.
Relative to other groups, spatially captive users are highly satisfied with the availability
of parking (7.9 out of 10) and seat availability (mean of 7.9 out of 10). Average parking
occupancy rates at stations closest to this group are on average 76% full, which is statistically
lower than the mean. Higher satisfaction levels with these service attributes is perhaps a
reflection of the low morning peak frequency of the nearest train stations to these users, as on
average two trains an hour serve these stations, therefore crowding at these stations is likely
minimal. Spatially captive users are very likely to continue to use the train service (mean of 9.3
out of 10) and among the most likely group to recommend GO Transit (mean of 8.3 out of 10).
Recommendations:
The spatially captive users are among the most loyal GO Train users, which is perhaps a result of
their captivity to train service, to avoid driving because of the cost and the negative effects of
stress that can be felt if they drive (39). It is recommended to continue to monitor the satisfaction
levels of these users, to ensure they remain regular and happy riders.
Cluster 5: Connected choice riders
Connected choice riders (13% of the sample) are satisfied with most service characteristics and
highly loyal to GO Transit. Users expressed their likelihood of future usage as 9.3 out of 10 on
average, and are among the most likely group to recommend service to friends or colleagues (8.6
out of 10). However, service characteristics that users are dissatisfied with include seat
availability (6.6 out of 10 on average). The frustration with seat availability expressed by these
users may be a result of these riders’ proximity to Union Station, where trains would be reaching
their capacity. On average these riders live 25 km from Union Station, and live close to a train
station (mean of 3.4 km). Users are dissatisfied with available parking (mean of 6.8 out of 10),
and live near train stations with parking lots that are nearing full capacity (88% occupied on
average). Forty-two percent of users report that they most frequently use the Lakeshore West
corridor, which in 2016 had the highest weekday ridership of all train corridors.
These users are referred to as choice riders, because of their high levels of job
accessibility by transit and proximity to downtown. These users are selecting GO Transit over
other modes of transport including the TTC, however their trips may be in conjunction with other
16local transit service. These users had the highest, although not statistically significant, proportion
of high income users, namely 61% of these users reported having a household income of
$100,000 or more. Similarly, these users are the oldest in age, although not statistically
significant, where 61% of users are between 36 and 55 years of age, and 24% of users are above
the age of 55.
Recommendations:
Increasing levels of satisfaction with seat availability and availability of parking would be
important targets for these otherwise satisfied and loyal users. Short-turn trains may be an
effective strategy to alleviate crowding. Additionally, these users live under 4 km on average
from a train station, which is a distance easily achieved by bicycle. Promoting cycling can be
achieved through the provision of secured bicycle parking and bicycle lanes in the area leading
to the train stations serving this group. Considering their close proximity to the CBD and high
levels of regional transit accessibility, they are an important group of users to monitor, since they
are loyal, but it is unknown at what point or at what levels of service frustrations would cause a
shift to being highly dissatisfied and deciding to drive or take other means of transit.
Cluster 6: Long-distance commuters
Long-distance commuters (25% of the sample) are distinguished by their poor transit
accessibility, and their high parking accessibility. On average these users have access to 5,941
parking spaces within 10 km of their home, and similar to the long-distance commuters parking
occupancy rates are nearing capacity (87% occupied on average). These users live in census
tracts with the highest average commuting distances, 18.6 km on average. The most frequently
used train corridor of 78% of these users is the Lakeshore West or East line, particularly towards
the end of both lines. Accordingly, service frequency is high with an average of 4.7 trains an
hour during the morning commute.
With regards to on-time performance, these users are satisfied with service timeliness
(7.9 of 10), however they rate their satisfaction with communication of service delays as 7 out of
10. This suggests that users perceive that service is reliable and mostly adheres to schedules,
however in the event of a service disruption, more efforts are required to effectively
communicate information to customers regarding the disruption. Overall satisfaction levels
among these users are low (mean of 7.4 out of 10). Examining their level of loyalty; stated future
usage and recommending the service provider to others; we see a large discrepancy between
these two questions. These riders are very likely to continue to use GO Transit (mean of 9 out of
10), however the likelihood of recommending the service to friends or family has an average
score of 7.9 out of 10. Similar to the spatially captive riders these users are also likely frustrated
with commuting such distances by car and choose transit as the best alternative.
Demographic characteristics of these users are most similar to the connected choice
riders, as 59% of the sample reported a household income of $100,000 or more, and 59% of
users are between the ages of 36 and 55. These respondents use the train service to commute
daily, and 99% of riders reported using the service during peak times.
17Recommendations:
To increase satisfaction levels among these users, interventions related to service reliability and
communication of service disruptions are important. Strategies to minimize frustration and
confusion in the event of a delay should lead to a higher perception of service quality.
Additionally, reducing crowding levels through increased train service would increase
satisfaction among these riders, especially along the Lake Shore corridor as they are mostly
using this train line.
Cluster 7: Infrequent young students
The final cluster, infrequent young students (7% of the sample), as indicated by their name, are
predominantly under the age of 35 (64%), and 47% are students. Reflective of the high
proportion of students, only 38% of riders travel during peak times, although 94% of this group
reported using the service during the weekday. Relative to other clusters, there are more users
who are either lower or medium income, specifically, 47% reported a household income of less
than $50,000 and 43% of users earn between $50,000 and $99,999.
Low levels of satisfaction with available parking (mean of 6.5 out of 10) were reported
by infrequent young students. Average parking occupancy rates at stations closest to this group
are on average 87% full. However, because the majority of these users do not travel during the
morning peak, parking may be very difficult to find when arriving at stations at later times of the
day. These are loyal riders, with an average future usage response of 8.8 out of 10, and are likely
to recommend the service (mean of 8.1 out of 10). However, the overall satisfaction level of
these users is 7.7 out of 10 on average. These users have moderate job accessibility, and the train
service appears to be well integrated with local transit service. These users live an average
distance of 5.7 km from a train station, and on average live 43 km from Union Station.
Recommendations:
Infrequent young students would benefit from targeted service improvements at off-peak times.
To improve overall satisfaction levels among these users an increase in service frequency at off-
peak times must be addressed. Additionally, the current network structure may deter this group
from travelling more frequently, as the train service is predominantly designed to bring all
passengers through Union Station, however there are few institutions that are located in
proximity to Union Station. Accordingly, GO Transit needs to expand its network to a more
comprehensive system that links multiple activity centers and communities, and provides better
connections to large institutions. Another consideration to ensure that these users continue to use
GO Transit, is for greater financial incentives or concession passes. While students do have
access to a discounted rate, which is more substantial when a monthly pass is being purchased,
the student discount is potentially not significant enough for GO Transit to be an affordable
transportation option for students.
18DISCUSSION AND CONCLUSIONS
The main objective of this study was to present a new method of segmenting the transit market
by incorporating detailed geographic information about where the user lives, and the service that
they experience. Using a factor-cluster approach, regional train users in the Greater Toronto and
Hamilton Area were segmented according to their satisfaction levels, personal characteristics and
geographic factors. The results of this study reveal that contextual and geographic factors prove
to be especially useful for the identification of different groups of users and the development of
policies specific to each group that are specific to where they live and the transit service they
regularly use.
A consolidation of the recommended policies that arose from this analysis and their
relative impact on user satisfaction among the groups is presented in Figure 5. The four
overarching policies for service improvements are: service reliability and crowding, station
access and parking policies, fare policies, and network structure and off-peak level of service.
While improvements in service reliability and crowding would benefit all users, as Figure 5
suggests, service improvements such as reducing crowding levels would likely have the largest
impact on satisfaction levels of the connected choice riders. Knowing that these users live either
in the City of Toronto or in the suburbs immediately surrounding Toronto, the introduction of
short-turn train service particularly along the Lakeshore West corridor which 42% of these users
most frequently use, may have significant impacts on overall satisfaction levels of these users.
Shorter lines provide agencies with more opportunities for recovery from delays compared to
longer train lines (40) and would reduce crowding levels experienced by passengers who board
the train closer to Union Station. Additionally, it is interesting to note, that each group of users
reported higher average satisfaction with on-time performance than communication of delays.
Delays incurred by passengers have negative effects on overall satisfaction levels reported by
customers (41). However, policies aimed at minimizing frustration and confusion in the event of
a delay are important and cost-effective strategies that will likely lead to a higher perceived
service quality and should not be over-looked by transit agencies.
Frustration with available parking spaces was reported by all users. Park-and-ride
expansion at suburban rail stations has historically supported ridership growth (42),
however presents transit agencies including Metrolinx with a challenge as station parking lots
operate at near or full capacity. This requires strategies to reduce passengers’ reliance on park-
and-ride facilities by encouraging alternative means of station access (33). Loyal underserved
users are particularly frustrated with available parking, although these users live in
neighbourhoods with high transit accessibility which is well integrated with GO Train service.
Identifying and eliminating barriers that prevent these users from using local transit or active
modes to reach GO stations is critical. Furthermore, connected choice riders live closest to train
stations relative to other clusters (under 4 km on average) which is a distance easily achieved by
bicycle. Accordingly, policies to encourage cycling to stations, such as offering secured bicycle
parking and improved cycling facilities around train stations, should be targeted towards these
19users. Accordingly, to prioritize bicycle facility upgrades at stations, GO Transit should consider
which stations the connected choice riders frequently use.
Figure 5. Summary of recommended policies and their expected impact on each cluster
(hatching symbology represents clusters with high proportion of low income individuals)
We also identified which policies would have the largest impact on low income users in
Figure 5. Of the users in our sample, 13% reported an annual household income of under
$50,000, compared to 49% of respondents reported earnings of above $100,000. Important
policies that would impact both the unsatisfied young urbanites and infrequent young students
are related to the fare structure. More specific to the unsatisfied young urbanites, fare integration
with transit service in Toronto will benefit these riders and potentially attract the ridership of
similar individuals currently not using GO Transit. Also, reductions in the current fares would
benefit these riders. The fares of GO Transit are set to cost approximately 74% of the total cost
of driving, including the cost of fuel and the cost of parking downtown Toronto (43).
Accordingly, greater consideration towards individuals of lower socioeconomic status and the
economic burden that GO Transit fares might present is highly recommended, through subsidy
programs for example (44). Furthermore, the customers’ evaluation of GO Transit fares suggests
that the fare structure in the outer suburbs works well relative to the perception of the fare
structure within the City of Toronto, where fares are not competitive against Toronto’s transit
20service. Restructuring fare levels may increase the number of shorter inter-city trips on GO
Transit.
The final policy recommendation which is targeted towards the unsatisfied young
urbanites and infrequent young students, is for increased off-peak service and expanding the
network structure. GO Transit’s network structure is predominantly designed for commuters,
which is reflected by the low proportion of students in the sample (4%). Expanding the GO Train
network to facilitate suburban to suburban travel, and serving institutions and commercial hubs
would likely increase the satisfaction and usage of groups such as the unsatisfied young
urbanites and infrequent young students.
Overall the results of this study have demonstrated how geographic data can be
incorporated into the public transit segmentation approach to recommend geographically
sensitive strategies that can improve customer satisfaction. Future segmentation analyses that
build on this approach can be enhanced with access to detailed trip characteristics about the
users’ typical travel behavior, including which stations they regularly begin and end their trip at.
With growing competition in the transportation market, agencies need to be market-oriented to
maintain and/or increase ridership. The ability to identify where targeted interventions for
service quality improvements are required is expected to be very relevant and applicable for
transit agencies, particularly those with scarce resources. Accordingly, other transit agencies can
apply a similar approach to help them prioritize investments in service improvement that can
lead to the highest increase in satisfaction among a targeted group of users.
ACKNOWLEDGEMENTS
We wish to thank Joshua Engel-Yan, Reiner Kravis and Tatiana Noguera from Metrolinx for the
survey data and support. This work was supported by a research grant from the Social Sciences
and Humanities Research Council.
21REFERENCES
[1] de Oña, J., R. de Oña, L. Eboli, and G. Mazzulla. Perceived service quality in bus transit
service: A structural equation approach. Transport policy, Vol. 29, 2013, pp. 219-226.
[2] Hensher, D., P. Stopher, and P. Bullock. Service quality––developing a service quality index
in the provision of commercial bus contracts. Transportation Research Part A: Policy and
Practice, Vol. 37, No. 6, 2003, pp. 499-517.
[3] Davis, M., and J. Heineke. How disconfirmation, perception and actual waiting times impact
customer satisfaction. international Journal of Service industry Management, Vol. 9, No. 1,
1998, pp. 64-73.
[4] Prioni, P., and D. Hensher. Measuring service quality in scheduled bus services. Journal of
Public transportation, Vol. 3, No. 2, 2000.
[5] Olsen, S. Repurchase loyalty: The role of involvement and satisfaction. Psychology &
Marketing, Vol. 24, No. 4, 2007, pp. 315-341.
[6] Eboli, L., and G. Mazzulla. Relationships between rail passengers’ satisfaction and service
quality: A framework for identifying key service factors. Public Transport, Vol. 7, No. 2, 2015,
pp. 185-201.
[7] van Lierop, D., and A. El-Geneidy. Loyalty in transit: An analysis of bus and rail users in two
Canadian cities. Research in Transportation Economics,, Vol. 59, 2016, pp. 50-59.
[8] Eboli, L., and G. Mazzulla. Service quality attributes affecting customer satisfaction for bus
transit. Journal of Public Transportation, Vol. 10, No. 3, 2007, p. 2.
[9] dell’Olio, L., A. Ibeas, and P. Cecín. Modelling user perception of bus transit quality.
Transport policy, Vol. 17, No. 6, 2010, pp. 388-397.
[10] Beirão, G., and J. Cabral. Understanding attitudes towards public transport and private car:
A qualitative study. Transport Policy, Vol. 14, No. 6, 2007, pp. 478-489.
[11] Bordagaray, M., L. dell'Olio, A. Ibeas, and P. Cecín. Modelling user perception of bus
transit quality considering user and service heterogeneity. Transportmetrica A: Transport
Science, Vol. 10, No. 8, 2014, pp. 705-721.
[12] Krizek, K., and A. El-Geneidy. Segmenting preferences and habits of transit users and non-
users. Journal of Public Transportation, Vol. 10, No. 3, 2007, p. 5.
[13] Jacques, C., K. Manaugh, and A. El-Geneidy. Rescuing the captive [mode] user: An
alternative approach to transport market segmentation. Transportation, Vol. 40, No. 3, 2013, pp.
625-645.
[14] Beimborn, E., M. Greenwald, and X. Jin. Accessibility, connectivity, and captivity: Impacts
on transit choice. Transportation Research Record: Journal of the Transportation Research
Board, Vol. 1835, 2003, pp. 1-9.
[15] Beirão, G., and J. Cabral. Market segmentation analysis using attitudes toward
transportation: Exploring the differences between men and women. Transportation Research
Record: Journal of the Transportation Research Board, No. 2067, 2008, pp. 56-64.
[16] van Lierop, D., and A. El-Geneidy. A new market segmentation approach: Evidence from
two Canadian cities. Journal of Public Transportation, Vol. 20, No. 1, 2017, pp. 20-43.
[17] de Oña, J., R. de Oña, and G. López. Transit service quality analysis using cluster analysis
and decision trees: A step forward to personalized marketing in public transportation.
Transportation, Vol. 43, No. 5, 2016, pp. 725-747.
[18] De Oña, J., R. De Oña, F. Diez-Mesa, L. Eboli, and G. Mazzulla. A composite index for
evaluating transit service quality across different user profiles. Journal of Public Transportation,
Vol. 19, No. 2, 2016, p. 8.
22[19] Molander, S., M. Fellesson, M. Friman, and P. Skålén. Market orientation in public
transport research—A review. Transport Reviews, Vol. 32, No. 2, 2012, pp. 155-180.
[20] Anderson, R. Consumer dissatisfaction: The effect of disconfirmed expectancy on perceived
product performance. Journal of Marketing Research, 1973, pp. 38-44.
[21] Parasuraman, A., V. Zeithaml, and L. Berry. A conceptual model of service quality and its
implications for future research. the Journal of Marketing, 1985, pp. 41-50.
[22] Weinstein, A. Handbook of market segmentation: Strategic targeting for business and
technology firms. Psychology Press, 2004.
[23] Anable, J. ‘Complacent car addicts’ or ‘aspiring environmentalists’? Identifying travel
behaviour segments using attitude theory. Transport Policy, Vol. 12, No. 1, 2005, pp. 65-78.
[24] Fujii, S., and R. Kitamura. What does a one-month free bus ticket do to habitual drivers? An
experimental analysis of habit and attitude change. Transportation, Vol. 30, No. 1, 2003, pp. 81-
95.
[25] Lai, W., and C. Chen. Behavioral intentions of public transit passengers—The roles of
service quality, perceived value, satisfaction and involvement. Transport Policy, Vol. 18, No. 2,
2011, pp. 318-325.
[26] Tyrinopoulos, Y., and C. Antoniou. Public transit user satisfaction: Variability and policy
implications. Transport Policy, Vol. 15, No. 4, 2008, pp. 260-272.
[27] De Ona, J., R. de Oña, L. Eboli, and G. Mazzulla. Heterogeneity in perceptions of service
quality among groups of railway passengers. International Journal of Sustainable
Transportation, Vol. 9, No. 8, 2015, pp. 612-626.
[28] Abenoza, R., O. Cats, and Y. Susilo. Travel satisfaction with public transport: Determinants,
user classes, regional disparities and their evolution. Transportation Research Part A: Policy and
Practice, Vol. 95, 2017, pp. 64-84.
[29] Diana, M. Measuring the satisfaction of multimodal travelers for local transit services in
different urban contexts. Transportation Research Part A: Policy and Practice, Vol. 46, No. 1,
2012, pp. 1-11.
[30] GO Transit. Strategic Plan GO 2020.In,
http://www.gotransit.com/Public/en/docs/publications/Strategic_Plan_GO_2020_lowres.pdf,
2017.
[31] Brons, M., M. Givoni, and P. Rietveld. Access to railway stations and its potential in
increasing rail use. Transportation Research Part A: Policy and Practice, Vol. 43, No. 2, 2009,
pp. 136-149.
[32] Givoni, M., and P. Rietveld. The access journey to the railway station and its role in
passengers’ satisfaction with rail travel. Transport Policy, Vol. 14, No. 5, 2007, pp. 357-365.
[33] Engel-Yan, J., M. Rudra, C. Livett, and R. Nagorsky. Strategic station access planning for
commuter rail: Balancing park-and-ride with other modes. Transportation Research Record:
Journal of the Transportation Research Board, No. 2419, 2014, pp. 82-91.
[34] Metrolinx. GO Rail Station Access Plan.In, 2016.
[35] Iacono, M., K. Krizek, and A. El-Geneidy. Access to destinations: how close is close
enough? Estimating accurate distance decay functions for multiple modes and different purposes.
2008.
[36] Figler, S., P. Sriraj, E. Welch, and N. Yavuz. Customer Loyalty and Chicago, Illinois,
Transit Authority Buses: Results from 2008 Customer Satisfaction Survey. Transportation
Research Record: Journal of the Transportation Research Board, No. 2216, 2011, pp. 148-156.
23You can also read