Expression analysis of selected genes involved in tryptophan metabolic pathways in Egyptian children with Autism Spectrum Disorder and learning ...
←
→
Page content transcription
If your browser does not render page correctly, please read the page content below
www.nature.com/scientificreports
OPEN Expression analysis of selected
genes involved in tryptophan
metabolic pathways in Egyptian
children with Autism Spectrum
Disorder and learning disabilities
Aliaa M. Higazi1*, Hanan M. Kamel1, Emad A. Abdel‑Naeem2, Noha M. Abdullah1,
Doaa M. Mahrous3 & Ashraf M. Osman1
Autism Spectrum Disorder (ASD) and learning disabilities are neurodevelopmental disabilities
characterized by dramatically increasing incidence rates, yet the exact etiology for these disabilities
is not identified. Impairment in tryptophan metabolism has been suggested to participate in the
pathogenesis of ASD, however, further validation of its involvement is required. Additionally, its
role in learning disabilities is still uninvestigated. Our objective was to evaluate some aspects of
tryptophan metabolism in ASD children (N = 45) compared to children with learning disabilities (N = 44)
and healthy controls (N = 40) by measuring the expression levels of the MAOA, HAAO and AADAT
genes using real-time RT-qPCR. We also aimed to correlate the expression patterns of these genes
with parental ages at the time of childbirth, levels of serum iron, and vitamin D3 and zinc/copper ratio,
as possible risk factors for ASD. Results demonstrated a significant decrease in the expression of the
selected genes within ASD children (p < 0.001) relative to children with learning disabilities and healthy
controls, which significantly associated with the levels of our targeted risk factors (p < 0.05) and
negatively correlated to ASD scoring (p < 0.001). In conclusion, this study suggests that the expression
of the MAOA, HAAO and AADAT genes may underpin the pathophysiology of ASD.
Autism Spectrum Disorder (ASD) and learning disabilities are grouped as neurodevelopmental d isorders1. Diag-
nostic and Statistical Manual of Mental Disorders (DSM-5) described ASD as defects in social participation,
either verbal or non-verbal difficulties in communication, and stereotyped forms of movements2. In 2014, a learn-
ing disability was defined as a neurological condition that interferes with an individual’s ability to store, process,
or produce information according to National Adult Literacy and Learning Disabilities Center3. Taken together,
all children with autism have at least one form of learning disability, however, not all children with learning dis-
abilities are autistic. Therefore, it is crucial to differentiate between them. The rate of incidence of both ASD and
learning disabilities is significantly increasing. It was determined that ASD is diagnosed in approximately 1 in 59
children worldwide1. However, the prevalence of learning disabilities is usually divided according to age group,
residence, severity, and income. It was reported that up to 10% of children (between the ages of 6 to 18 years old)
are distinguished as having at least one form of a learning disability such as dyslexia or d yscalculia4.
ASD and learning disabilities are multi-factorial and heterogeneous conditions both in their etiology and
clinical presentations, and their risk genes remain largely unknown. Nowadays, investigating the etiological
bases underlying these diseases becomes increasingly important due to their continuous rise in incidence over
the last two decades in addition to the lack of precise prenatal screening tools, early diagnostic biomarkers, and
effective treatments. As well, these disabilities impose numerous difficulties on the families of children with
autism or learning a bilities5,6.
In previous studies, it was reported that autistic children share several biochemical deficiencies and metabolic
abnormalities which were considered as possible risk factors for the development of ASD such as deficiencies
1
Clinical and Molecular Chemistry Unit, Department of Clinical and Chemical Pathology, Faculty of Medicine,
Minia University, Minia, Egypt. 2Immunology Unit, Department of Clinical and Chemical Pathology, Faculty of
Medicine, Minia University, Minia, Egypt. 3Department of Pediatrics, Faculty of Medicine, Minia University, Minia,
Egypt. *email: aliaamonir@yahoo.com
Scientific Reports | (2021) 11:6931 | https://doi.org/10.1038/s41598-021-86162-w 1
Vol.:(0123456789)www.nature.com/scientificreports/
p-values
GI N = 40 GII N = 44 GIII N = 45 GI vs GII GI vs GIII GII vs GIII
Age of sampling (years)
Range 4–13 6–13 4–10 0.6 0.4 0.002*
Mean ± SD 7.6 ± 3.4 9.1 ± 2.3 6.1 ± 2.1
Age of diagnosis (years)
Range - 5–10 3–5 – - 0.01*
Mean ± SD – 8.3 ± 0.3 4.0 ± 0.5
Sex (%)
Male 22(55%) 32(72.7%) 32(71.1%) 0.3 0.2 0.8
Female 18(45%) 12(27.3%) 13(28.9%)
Siblings (%)
No 36(90%) 42(95.5%) 28(62.2%) 0.4 0.02* 0.004*
Yes 4(10%) 2(4.5%) 17(37.8%)
Age of mother (years)
At time of childbirth
Range 20–37 20–37 24–44 0.4 0.001* 0.001*
Mean ± SD 25.7 ± 4.1 26.7 ± 3.8 32.7 ± 4.8
Age of father (years)
At time of childbirth
Range 25–40 26–40 29–52 0.7 0.001* 0.001*
Mean ± SD 31.2 ± 3.7 31.7 ± 3.3 38.8 ± 5.2
Table 1. Demographic data of children within studied groups. GI; control group, GII; learning disabilities,
GIII; autism spectrum disorder, N; number, SD; standard deviation, *p-value < 0.05 = significant.
in maternal or autistic patients iron serum levels, vitamin D3 serum levels and zinc/copper ratios. Abnormali-
ties in the levels of tryptophan metabolites in the peripheral blood, urine, or brain tissues were also previously
associated with ASD. However, most of these studies were performed on animals or tissues rather than human
blood samples. Moreover, the data collected from these studies were inconsistent or not correlated with sug-
gested risk factors7,8.
The essential amino acid, L-tryptophan, is crucial for neurodevelopment. Although a small percentage of it is
metabolized into the neurotransmitter, serotonin, the majority of L-tryptophan enters the kynurenine pathway
to produce quinolinic acid (QA), kynurenic acid (KA), kynuramines, picolinic acid, and NAD; hence, it could
play a role in regulating central nervous system (CNS) function9. Tryptophan metabolic pathways are regulated
by an array of genes. A large-scale genetic analysis was previously performed to investigate genes involved in
tryptophan metabolism in ASD and revealed a complex genetic architecture using microarray technique in
animal brain tissues10. However, the data collected from this study have not been validated through quantitative
genetic analyses. The advantage of quantitative genetic analyses is the ability to detect gene variants and path-
ways associated with the disease of interest, thus, it could aid in elucidating underlying biological mechanisms.
Tryptophan metabolic pathways are understudied in the context of learning disabilities and ASD. Therefore,
further research is warranted. In the current study, we evaluated the expression of selected genes involved in the
pathways of tryptophan metabolism in the blood samples from children with learning disabilities and ASD. These
genes include monoamine oxygenase A (MAOA), 3-hydroxyanthranilate oxygenase (HAAO) and aminoadipate
aminotransferase (AADAT). Furthermore, we correlated the expression levels of these genes with the severity
of ASD and with our studied risk factors.
Results
Demographic and laboratory data of children within studied groups. The age of diagnosis was
significantly different (p = 0.01) between children with learning disabilities and autism, where ASD showed to
be detected earlier. We also found that ASD is more prevalent among siblings (37.8% of children with ASD
compared to 4.5% of children with learning disabilities). Our data showed that the incidence of ASD compared
to learning disabilities was significantly higher with advanced parental age at the time of childbirth (p = 0.001)
(Table 1). The demographic data of autistic children according to their scoring or degree of severity is shown in
Table 2.
With regards to laboratory data, the current study showed a statistically significant decrease in levels of
hemoglobin (p = 0.04), iron (p = 0.001) and Vitamin D3 (p = 0.007) in children with learning disabilities relative
to healthy children, while zinc/copper ratios remained indifferent (p = 0.08). Similar results were obtained in
children with ASD regarding hemoglobin (p = 0.006), iron (p = 0.001) and Vitamin D3 (p < 0.001) levels, yet a
statistically significant decrease in zinc/copper ratio (p < 0.001) was also observed. In addition, our data revealed
a statistically significant decrease in levels of hemoglobin (p = 0.049), Vitamin D3 (p = 0.02) and zinc/copper
Scientific Reports | (2021) 11:6931 | https://doi.org/10.1038/s41598-021-86162-w 2
Vol:.(1234567890)www.nature.com/scientificreports/
p-values
GIIIa N = 21 GIIIb N = 12 GIIIc N = 12 GIIIa vs GIIIb GIIIa vs GIIIc GIIIb vs GIIIc
Age of sampling (years)
Range 7–10 5–9 4–6 0.053 0.001* 0.01*
Mean ± SD 8.5 ± 1.1 7.2 ± 2.1 5.5 ± 1.7
Age of diagnosis (years)
Range 4–5 4–5 3–5 0.6 0.003* 0.03*
Mean ± SD 4.7 ± 0.5 4.1 ± 0.7 3.1 ± 0.9
Sex (%)
Male 14(66.7%) 8(66.7%) 10(83.3%) 0.7 0.5 0.6
Female 7(33.3%) 4(33.3%) 2(16.7%)
Siblings (%)
No 19(90.5%) 7(58.3%) 2(16.7%) 0.08 0.001* 0.09
Yes 2(9.5%) 5(41.7%) 10(83.3%)
Age of mother (years)
At time of childbirth
Range 24–38 28–40 30–44 0.007* 0.001* 0.08
Mean ± SD 29.8 ± 4.1 33.9 ± 3.6 36.7 ± 4.1
Age of father (years)
At time of childbirth
Range 29–43 35–47 38–52 0.002* 0.001* 0.09
Mean ± SD 35.4 ± 4.03 40.4 ± 3.7 43.3 ± 4.5
Table 2. Demographic data of children within studied ASD subgroups. GIIIa; mild autism spectrum disorder,
GIIIb; moderate autism spectrum disorder, GIIIc; severe autism spectrum disorder, N; number, SD; standard
deviation, *p-value < 0.05 = significant.
p-values
GI N = 40 GII N = 44 GIII N = 45 GI vs GII GI vs GIII GII vs GIII
Hb (g/dL)
Range 12.8–15.0 11.9–14.4 10.9–13.3 0.04* 0.006* 0.049*
Mean ± SD 13.9 ± 0.6 12.8 ± 0.6 12.1 ± 0.6
Iron (μg/dL)
Range 57–121 38–103 32–132 0.001* 0.001* 0.3
Mean ± SD 80.6 ± 17.1 62.7 ± 13.1 58.3 ± 18.02
Vit D3 (ng/mL)
Range 39–67 7.1–46 6.1–38.6 0.007* < 0.001* 0.02*
Mean ± SD 51.8 ± 7.5 17.7 ± 8.4 10.5 ± 5.6
Zn/Cu ratio
Range 0.77–0.99 0.73–0.91 0.51–0.75 0.08 < 0.001* 0.005*
Mean ± SD 0.87 ± 0.1 0.75 ± 0.09 0.53 ± 0.17
Table 3. Comparison between studied groups regarding laboratory data. GI; control group, GII; learning
disabilities, GIII; autism spectrum disorder, N; number, SD; standard deviation, Hb; hemoglobin, Vit D
3;
Vitamin D3, Zn/Cu; Zinc/Copper, *p-value < 0.05 = significant.
ratio (p = 0.005), but not with serum iron levels (p = 0.3), in autistic children compared to those with learning
disabilities (Table 3). The laboratory data of ASD subgroups are reported in Table 4.
Relative expression levels of selected genes within studied groups plus their correlations with
laboratory data and with each other’s. Relative to healthy control children, our data detected a signifi-
cant decrease in the expression levels of MAAO, HAAO and AADAT genes among children with ASD, but indif-
ferent expression levels in children with learning disabilities relative to both controls and ASD children (Fig. 1).
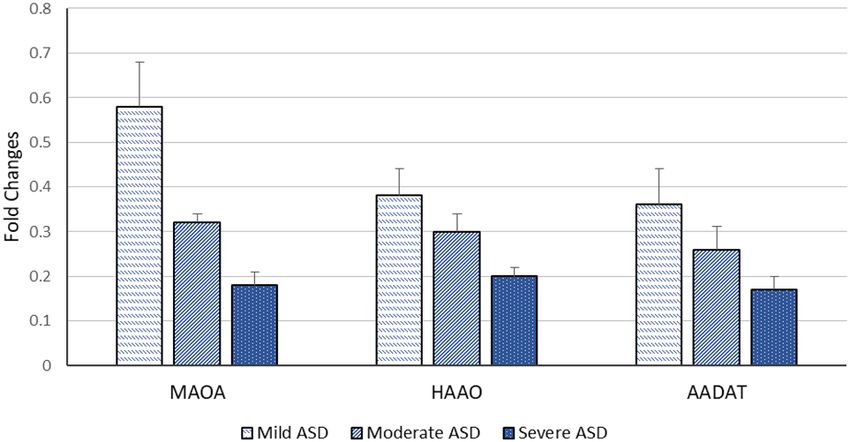
Regarding the severity of autism, the significant decrease in expression levels of our selected genes is associated
with an increased autism score (Fig. 2). According to the laboratory data of each child, there were significant
positive correlations between levels of iron and MAOA gene expression (r = 0.26 & p = 0.048), and between levels
of iron and HAAO gene expression (r = 0.33 & p = 0.03) and a weak positive correlation with AADAT gene expres-
sion (r = 0.23, p = 0.01). Furthermore, there were fair positive correlations between the levels of vitamin D3 and
Scientific Reports | (2021) 11:6931 | https://doi.org/10.1038/s41598-021-86162-w 3
Vol.:(0123456789)www.nature.com/scientificreports/
p-values
GIIIa N = 21 GIIIb N = 12 GIIIc N = 12 GIIIa vs GIIIb GIIIa vs GIIIc GIIIb vs GIIIc
Hb (g/dL)
Range 11.2–13 10.9–13.3 10.9–12.9 0.01* 0.001* 0.046*
Mean ± SD 12.1 ± 0.5 11.3 ± 1.0 11.0 ± 0.9
Iron (μg/dL)
Range 50–132 40–104 32–73 0.001* 0.001* 0.3
Mean ± SD 66.1 ± 14.4 56.3 ± 17.5 54.1 ± 8.3
Vit D3 (ng/mL)
Range 6.4–38.6 6.7–20.8 6.1–7.6 0.003* 0.002* 0.02*
Mean ± SD 13.2 ± 6.8 9.2 ± 3.8 6.9 ± 0.4
Zn/Cu ratio
Range 0.66–0.75 0.59–0.65 0.51–0.55 0.002* 0.001* 0.04*
Mean ± SD 0.71 ± 0.15 0.62 ± 0.10 0.53 ± 0.03
Table 4. Levels of risk factors in children within ASD subgroups. GIIIa; mild autism spectrum disorder,
GIIIb; moderate autism spectrum disorder, GIIIc; severe autism spectrum disorder, N; number, SD; standard
deviation, Hb; hemoglobin, Vit D3; Vitamin D3, Zn/Cu; Zinc/Copper, *p-value < 0.05 = significant.
Figure 1. Mean fold change of MAOA, HAAO & AADAT genes expression in diseased groups. The mean fold
changes of these genes’ expression were calculated as fold change from their expression in the control group.
*p-value < 0.05 = significant. ASD; Autism Spectrum Disorder, MAOA; monoamine oxygenase A, HAAO;
3-hydroxy anthranilate oxygenase, AADAT; aminoadipate aminotransferase.
Figure 2. Mean fold change of MAOA, HAAO & AADAT genes expression according to ASD severity. The
mean fold changes of these genes’ expression were calculated as fold change from their expression in controls.
ASD; Autism Spectrum Disorder, MAOA; monoamine oxygenase A, HAAO; 3-hydroxy anthranilate oxygenase,
AADAT; aminoadipate aminotransferase.
MAOA (r = 0.41 & p = 0.005), HAAO (r = 0.39 & p = 0.007) and AADAT (r = 0.48 & p = 0.001) genes expression.
Regarding zinc/copper ratios, there was a significant, moderate positive correlation with MAOA gene expres-
sion (r = 0.53 & p = 0.04), a weak positive correlation with HAAO gene expression (r = 0.21 & p = 0.003) and a fair
positive correlation with AADAT gene expression (r = 0.35 & p = 0.01) (Table 5). Finally, our data reported that
Scientific Reports | (2021) 11:6931 | https://doi.org/10.1038/s41598-021-86162-w 4
Vol:.(1234567890)www.nature.com/scientificreports/
Learning disabilities N = 44 ASD N = 45
MAOA HAAO AADAT MAOA HAAO AADAT
Hb
r 0.27 0.02 0.20 0.05 0.11 0.05
p-value 0.2 0.9 0.2 0.06 0.4 0.07
Iron
r 0.08 0.15 0.38 0.26 0.33 0.23
p-value 0.6 0.4 0.07 0.048* 0.03* 0.01*
Vit D3
r 0.29 − 0.02 0.21 0.41 0.39 0.48
p-value 0.1 0.8 0.3 0.005* 0.007* 0.001*
Zn/Cu ratio
r 0.25 0.35 0.18 0.53 0.21 0.35
p-value 0.06 0.5 0.07 0.04* 0.003* 0.01*
Table 5. Correlation between relative gene expression & laboratory data of diseased groups. r = 0.75–1 (strong
correlation), r = 0.5–0.74 (moderate correlation),r = 0.25–0.49 (fair correlation), r = 0.1–0.24 (weak correlation),
*p-value < 0.05 = significant, ASD; Autism Spectrum Disorder, N; number, MAOA; monoamine oxygenase A,
HAAO; 3-hydroxy anthranilate oxygenase, AADAT; aminoadipate aminotransferase, Hb; hemoglobin, Vit D 3;
vitamin D3, Zn/Cu; Zinc/Copper.
Figure 3. Correlation between relative expression levels of MAOA & HAAO genes among ASD. There was
a statistically significant strong positive correlation between MAOA and HAAO genes’ expression (r = 0.83 &
p = 0.0001). MAOA, monoamine oxygenase A; HAAO, 3-hydroxy anthranilate oxygenase.
Figure 4. Correlation between relative expression levels of MAOA & AADAT genes among ASD. There was
a statistically significant strong positive correlation between MAOA, AADAT genes’ expression (r = 0.86 &
p = 0.0001). MAOA, monoamine oxygenase A; AADAT, aminoadipate aminotransferase.
Scientific Reports | (2021) 11:6931 | https://doi.org/10.1038/s41598-021-86162-w 5
Vol.:(0123456789)www.nature.com/scientificreports/
Figure 5. Correlation between relative expression levels of AADAT & HAAO genes among ASD. There was
a statistically significant strong positive correlation between HAAO and AADAT genes’ expression (r = 0.89 &
p = 0.0001). AADAT, aminoadipate aminotransferase; HAAO, 3-hydroxy anthranilate oxygenase.
Age of mothers at Age of fathers at
ASD severity time of childbirth time of childbirth Hb Iron Vit D3 Zn/Cu ratio MAOA HAAO AADAT
r 0.23 0.31 − 0.097 − 0.204 − 0.473 − 0.333 − 0.932 − 0.830 − 0.891
p-values 0.042* 0.037* 0.528 0.179 0.001* 0.001* < 0.001* < 0.001* < 0.001*
Table 6. Correlation between ASD severity along with parental age, laboratory data of children and their
relative genes expression. r = 0.75–1 (strong correlation), r = 0.5–0.74 (moderate correlation),r = 0.25–0.49 (fair
correlation), r = 0.1–0.24 (weak correlation), *p-value < 0.05 = significant, ASD; Autism Spectrum Disorder, Hb;
hemoglobin, Vit D3; vitamin D3, Zn/Cu; Zinc/Copper, MAOA; monoamine oxygenase A, HAAO; 3-hydroxy
anthranilate oxygenase, AADAT; aminoadipate aminotransferase.
Coefficient Std. Error 95%CI p-value
Sex 1.6206 0.1622 1.2979, 1.9430 0.254
Age of sampling 1.8776 0.1644 1.55, 2.2 0.231
Age of diagnosis 3.871 0.11 3.851, 4.091 0.052
MAOA 1.7774 0.07333 1.63, 1.92 < 0.001*
HAAO 2.2992 0.06593 2.17, 2.43 < 0.001*
AADAT 2.2209 0.06065 2.1, 2.3 < 0.001*
Table 7. Regression analysis for the association between sex, age of sampling, age of diagnosis and targeted
genes expressions in relation to disease diagnosis. Std. Error; standard error, 95% CI; 95% confidence
interval, MAOA; monoamine oxygenase A, HAAO; 3-hydroxy anthranilate oxygenase, AADAT; aminoadipate
aminotransferase, *p-value < 0.05 = significant.
decreased expression levels of one of these genes are associated with a reduction in the expression level of the
other two genes (Figs. 3, 4, 5).
Correlation between ASD severity and parental ages, laboratory data along with expression
levels of selected genes. In this study, there were statistically significant, positive correlations between
parental age at the time of childbirth and ASD severity (p = 0.042 for mothers’ age, 0.037 for fathers’ age). As well,
we estimated that Vitamin D3 levels and zinc/copper ratios significantly decreased with increased ASD sever-
ity (r = − 0.473 & r = − 0.333 respectively & p = 0.001). Levels of MAOA, HAAO and AADAT genes expression in
autistic children showed a significantly strong, negative correlation with the degree of ASD severity (r = − 0.932,
r = − 0.83, r = − 0.891 respectively & p < 0.001) (Table 6).
Regression analysis regarding the expression of selected genes and different co‑variants in
relation to ASD diagnosis along with between targeted genes and different co‑variants. We
analyzed the regression association between our targeted genes expression along with the sex of included sub-
jects and their ages at the time of sampling and diagnosis in relation to disease diagnosis. Based on coefficient
values and 95% CI (coefficient intervals), the results in the current study revealed that the diagnosis of ASD is
dependent on the expression of MAOA, HAAO and AADAT genes (p-values < 0.001 for all) but not on other
included co-variants (p-values > 0.05 for all) (Table 7). Also, we investigated the associations of candidate genes
Scientific Reports | (2021) 11:6931 | https://doi.org/10.1038/s41598-021-86162-w 6
Vol:.(1234567890)www.nature.com/scientificreports/
Co-variants Coefficient Std. Error 95% CI p-value
Sex 4.481 1.336 1.824, 7.138 0.865
MAOA Age of sampling 5.594 1.389 2.833, 8.355 0.497
Age of diagnosis 0.962 0.472 0.02, 1.904 0.055
Sex 4.568 1.079 2.423, 6.712 0.073
HAAO Age of sampling 5.661 1.142 3.390, 7.932 0.488
Age of diagnosis 0.947 0.476 − 0.003, 1.897 0.051
Sex 0.354 0.096 0.162, 0.545 0.081
AADAT Age of sampling 0.432 0.102 0.230, 0.634 0.396
Age of diagnosis − 0.720 0.108 − 0.936, − 0.504 0.051
Table 8. Regression analysis for the association between targeted genes expressions and sex, age of sampling
along with age of diagnosis. Std. Error; standard error, 95% CI; 95% confidence interval, MAOA; monoamine
oxygenase A, HAAO; 3-hydroxy anthranilate oxygenase, AADAT; aminoadipate aminotransferase.
expression with different co-variants including our subjects’ sex, the age of sampling as well as the age of diagno-
sis via linear regression analysis. However, our data revealed that the expression of MAOA, HAAO and AADAT
genes are not associated with our included co-variants (p-values > 0.05 for all). These data mean that the expres-
sion levels of our three selected genes are not dependent on the levels of these co-variants. The detailed statistical
regression measures are shown in Table 8.
Discussion
ASD is a major health problem worldwide11. Learning disability is also very common; the American Academy of
Child and Adolescent Psychiatry reported that at least 1 in 10 school children are affected by learning disorders
and are receiving special education services12. The possible causes of both ASD and learning disabilities are still
uncertain, but researchers have found a range of risk factors that may be present from birth and tend to run in
families.
In the current study, siblings represented only 4.5% of our included learning disability children. In disa-
greement with our data but in keeping with most published literature, siblings of an Indian background with
dyslexia were shown to have significant problems in selective a ttention13. This could be attributed to a differ-
ence in the used methodologies. On the other hand, 45 children with ASD were included in our study, and 17
of them were siblings. Based on studies of families, the recurrence risk of ASD among siblings was estimated
at anywhere between 3 and 10%14. In a study performed by Miller et al., researchers found an elevated rate of
ASD recurrence in later-born siblings15. Likewise, Ozonoff et al. and an expansion study in 2015 indicated a
19.5% recurrence rate in ASD siblings with some variability in estimates across 15 different study sites. Thus, the
recurrence risk for a child depends on both genetic and environmental factors16,17. Similarly, it was revealed that
not all diagnosed cases of ASD and learning disabilities are genetically based, but environmental factors could
play a role15. However, most of the previous studies were focused on either the genetic view of these disorders or
their environmental risk factors with less emphasis on their correlation to each o ther18,19. In the current study,
we investigated some genetic aspects related to tryptophan metabolism pathways within ASD and learning dis-
ability children in association with a set of possible environmental risk factors containing parental ages, serum
levels of iron, vitamin D3 as well as zinc/copper ratios.
Our results show that older ages of fathers and mothers at the time of childbirth of their ASD and learning
disability children were led to a significantly higher incidence of children born with ASD and learning disability
compared to the control group. Furthermore, we found that children born to parents of advanced ages are asso-
ciated with a higher risk of developing ASD, which agrees with previous s tudies20–28. Sandin et al.27 recorded an
increased incidence of ASD when there are increased differences between parental ages and not only because
of advanced paternal or maternal ages. Similarly, the association between learning disability and advanced
parental ages was reported before28. Altogether, our data present an evidence for the possible incorporation of
accumulated parental age-related genetic mutations and epigenetic modifications in the pathogenesis of these
neurodevelopmental disorders.
The present study displays a significant decrease in the levels of serum iron and lower hemoglobin con-
centrations in children with ASD and learning disabilities in comparison to healthy controls. These findings
were similar to those recorded in many previous studies29–33. Moreover, it was reported that maternal intake of
iron supplements reduces their risk of having an autistic child34. Many regions in the brain contain the highest
concentrations of iron in the body because iron is crucial for the myelination of neurons and the synthesis of
neurotransmitters. Additionally, the brain is using 20% of basal body oxygen levels to maintain mitochondrial
ATP production and brain iron deficiency has been shown to damage mitochondrial DNA and change mito-
chondrial morphology and f unction29.
Our study showed a significant decrease in the levels of vitamin D in both children with ASD and learning
disabilities. It was revealed that reduction in the brain and serum levels of vitamin D could play a role in the
development of the unordinary social behaviours that occur in a number of psychological conditions, including
autism35. Likewise, early childhood and gestational vitamin D deficiencies were demonstrated within autistic
children and their mothers in many previous s tudies36–39. In accordance, children of women who had higher levels
of vitamin D were estimated to have a lower risk of autism. Additionally, it was shown that vitamin D supplements
Scientific Reports | (2021) 11:6931 | https://doi.org/10.1038/s41598-021-86162-w 7
Vol.:(0123456789)www.nature.com/scientificreports/
may improve autism symptoms in autistic children who have vitamin D deficiency or insufficiency40,41. The overall
prevalence of vitamin D deficiency was 77.3% in the learning disabilities group and 39.6% in the control group
as stated in the study by C ebulla42. Similar results were concluded in Frighi and coauthors s tudy43. On top, we
found a significant correlation between levels of vitamin D and severity of autism which agrees with the study
conducted by El-Ansary et al.44. The association between vitamin D deficiency and neurodevelopmental disor-
ders was claimed mainly to its role in immune regulation. Alongside this association, certain polymorphisms in
vitamin D receptor genes were distinguished as possible risk factors for the development of A SD45,46.
Zinc is utilized in the human body for normal growth and development from the time of intrauterine
development47. Its deficiency may cause neuropsychological problems such as emotional instability, irritability,
rain48,49. The current research
and depression. As well, it was established that copper toxicity severely affects the b
revealed a significant decrease in zinc/copper ratios in ASD cases when compared to both children with learning
disabilities and the control group (p = 0.005 & < 0.001 respectively). It was reported that children with ASD appear
to be at risk for zinc deficiency and copper toxicity and thus often have low zinc/copper ratios. Furthermore, a
number of studies considered this decreased ratio as a chemical marker for ASD. Additionally, our data stated
a significant fair negative correlation between this ratio and the scoring of ASD (r = − 0.333 & p = 0.001) which
agreed with a number of previous studies50–52.
Tryptophan plays vital structural and functional roles in neurodevelopment as it is involved in the synthesis
of cell membrane proteins as well as being a precursor for the neurotransmitter serotonin, the neurohormone
melatonin, niacin (which is also known as vitamin B3), as well as auxins (a class of phytohormones). Also, tryp-
tophan is mainly metabolized through the kynurenine pathway which is a source for N AD+53. The metabolomics
in the urine of young children with ASD revealed alterations in a number of metabolic pathways containing
tryptophan metabolisms. Dysregulation in tryptophan metabolism was found to cause an increase in QA and
a decrease in both KA and melatonin. These metabolic abnormalities could be responsible for seizures, sleep
disorders, gastrointestinal disturbances, and some other symptoms related to ASD54. Besides, it was discovered
that maternal inflammations lead to altered placental tryptophan metabolism by inducing transcriptional and
translational cascades in the placenta, which in turn cause abnormality in human fetus neurochemistry and
neurodevelopment55,56. Therefore, impairment in tryptophan metabolic pathways was strongly suggested as a
possible genetic risk factor that influences the development of ASD which needs further investigations. Further-
more, its role in learning disabilities is not inspected yet.
In the current study, we measured the expression levels of three genes involved in tryptophan metabolic
pathways, which are MAOA (serotonin pathway) along with two genes within the kynurenine pathway (HAAO
and AADAT) in both children with ASD and learning disabilities. We found disturbances through detection of
lower expression levels of these genes in patients with ASD only, which is correlated with the severity of autism.
Boccuto et al. used lymphoblastoid cell lines from patients with neurodevelopmental disorders including ASD.
They analyzed the metabolic profile of these cells. Their results showed a significant difference in the expression
levels of MAOA, HAAO, AADAT, SLC7A5, SLC7A8, TPH2 and WARS2 genes in cases with neurodevelopmental
disorders when compared to controls while the relative expression level of QPRT gene showed no significant
difference. These data were analyzed through a microarray study which in turn needs more validations10. The
results of this study agree with our results regarding MAOA, HAAO and AADAT genes.
MAOA enzyme is the primary metabolizing enzyme for monoamine neurotransmitters including seroto-
nin. Thus, it is a key regulator for brain function. Individuals who had loss of function mutations in MAOA
gene and a deficient MAOA activity showed increased levels of serotonin57–62 which appear to take part in the
pathogenesis of ASD through a vast of neuro-immune r esponses63. It was found that dysregulation in the body
levels of serotonin is associated with an increased incidence of abnormal behaviours which mimic many ASD-
associated ones64,65. Our findings showed a significant decrease in the expression of the MAOA gene which is
correlated with the degree of autism severity. Likewise, Gu et al. measured MAOA activity from post-mortem
tissues of the cerebellum and the frontal cortex from subjects with autism. They found that the activity of MAOA
in the cerebellum is lowered by 20.6% while in the frontal cortex is lowered by 27.8%66.
It has been reported that altered peripheral blood or cerebral levels of either QA or KA may participate in the
pathogenesis of neurologic disorders incorporating many ASD characteristics67,68. The HAAO gene is involved
in the kynurenine pathway of tryptophan metabolism. It encodes an enzyme that catalyzes the synthesis of QA
which is a precursor of N AD53. NAD is a precursor of NADH, an energy carrier for the mitochondria electron
transport chain. HAAO is an excitotoxin as well that has been suggested to be involved in disorders associated
with altered tissue levels of QA. According to our study, there is a decrease in HAAO gene expression in subjects
with ASD which may lead to a reduction in NAD synthesis and an impairment in mitochondrial function. It
was reported that a loss of function mutation of the maternal HAAO gene causes NAD deficiency and congenital
anomalies53. Finally, the AADAT gene encodes an enzyme that catalyzes the process of kynurenine transamina-
tion to KA69. A new missense mutation in AADAT gene was discovered by Li et al. which may provide a potential
molecular base for ASD in families70.
Subjects and methods
This study was carried out at the Clinical and Chemical Pathology along with Pediatrics Departments, Faculty of
Medicine, Minia University, Egypt. It was conducted in accordance with the ethical guidelines of both Declaration
of Helsinki and the International Conference on Harmonization Good Clinical Practice. One hundred twenty-
nine children were included. They were classified into three main groups. Group I was containing 40 apparently
healthy control children in addition to patients’ groups (Group II and III). Patients’ groups contained 89 children
selected from patients who regularly followed up at the Neuropsychiatric Clinic, Pediatric Hospital, Minia Uni-
versity, Egypt and from Kayan charity for education and rehabilitation of autistic children, Minia Branch, Egypt.
Scientific Reports | (2021) 11:6931 | https://doi.org/10.1038/s41598-021-86162-w 8
Vol:.(1234567890)www.nature.com/scientificreports/
The patients in group II (N = 44) involved children with learning disabilities while group III children (N = 45)
are those with ASD. The ASD group was further subdivided according to the severity of autism into group IIIa
with mild autism, group IIIb with moderate autism and group IIIc with severe autism. The diagnosis of learning
disabilities was performed through intelligence tests (IQ tests), achievement tests, visual-motor integration tests
and language tests71, while ASD children were diagnosed as defined by DSM-5 criteria. The severity of ASD was
characterized according to Childhood Autism Rating Scale (CARS)72. Diagnosis of all patients was made by
proficient specialists in this field. Informed consent was signed by parents of all participants and study approval
was obtained from the review board of the Minia Faculty of Medicine, Minia University, Egypt. Patients with
mental retardation, psychological disorders e.g. schizophrenia, psychopathological disease e.g. brain tumour,
type I IDDM or IQ-Achievement discrepancy were excluded.
An initial evaluation for all participants incorporated a detailed history, including prenatal, natal and post-
natal histories. All children were subjected to clinical examination including psychological examination accord-
ing to DSM-5 criteria and radiological examination including brain computerized tomography (CT). Venous
blood samples were withdrawn from all subjects for analysis of complete blood counts (CBCs) via automated
cell counter Celltac ES (Nihon Kohden Europe) plus liver and renal function tests by automated chemistry
auto-analyzer system Konelab 20i (Thermo Electron Incorporation, Vantaa, Finland) to exclude other diseases.
As well, serum levels of iron, zinc and copper were assessed by the direct colorimetric method using kits from
Spectrum Diagnostics (Cairo, Egypt) for iron, Quimica Clinica Aplicada S.A. (Amposta, SPAIN) for zinc and
JaICA, Nikken SEIL Co. (Shizuoka, Japan) for copper. The colour absorbance was measured via Microlab 300
analyzer (ELITechGroup Clinical Systems, France). The Zn/Cu ratio was calculated. Furthermore, serum levels
of vitamin D3 were measured via Enzyme-Linked Fluorescent Assay technique (ELFA) using (Mini Vidas,
Biomerieux, France).
Subjects’ whole blood samples were used to quantify the expression levels of MAOA, HAAO, AADAT genes
after RNA extraction by Gene JET RNA Purification Kit from Thermo Scientific (Waltham, Massachusetts,
United States) according to manufacture instructions. RNA was further reverse transcribed to cDNA using High
Capacity cDNA reverse transcription kit from Applied Biosystems, Thermo Fisher Scientific (Waltham, Mas-
sachusetts, United States). Real-time PCR was performed using TaqMan Gene Expression Assays Kit supplied
by Applied Biosystems, Thermo Fisher Scientific (Waltham, Massachusetts, United States). The thermal protocol
was run on a DT lite Real-Time PCR System (DNA technology, Moscow, Russia). The amounts of expression
for MAOA, HAAO and AADAT genes were made relative to the expression of the housekeeping gene Beta-actin
and calculated using the threshold cycle (Ct) method.
The different real-time PCR forward and reverse primers were designed as follows:
Forward Primers Reverse Primers
h MAOA 5′-ACA GCC TGA CCG TGG AGA AG-3′ 5′-GAA CGG ACG CTC CAT TCG GA-3′
h HAAO 5′-ACACCGGGATGTGGTCATTC-3′ 5′-ATAGTACCTGAGCCCATCTAGC-3′
5′-ACTCGGAGAATACTGAAGTGCTC-
h AADAT 5′-GGCTGGTGGCTTACCAAATC-3′
3′
h Β-actin 5′-CATGTACGTTGCTATCCAGGC-3′ 5′-CTCCTTAATGTCACGCACGAT-3′
Statistical analyses
Statistical Package for Social Sciences (SPSS) program software version 24 (SPSS Inc., Chicago, IL, USA) was
used. Descriptive statistics for parametric quantitative data were presented as mean ± standard deviation (SD) and
range, whereas categorical data were presented as number and percentage. Sample t-test was used for analyses of
parametric data between two groups. Analysis of variance (ANOVA) of regression and coefficient analysis along
with 95% CI for the coefficient estimates were used to demonstrate the significance of associations within linear
regression analysis. A p-value ≤ 0.05 was considered statistically significant. Expression levels were presented
as fold-change relative to the healthy control group. Correlations between two quantitative variables were done
by Pearson’s correlation coefficient. The correlation coefficient ranges were considered weak if r = 0–0.24, fair
if r = 0.25–0.49, moderate if r = 0.5–0.74 and strong if r = 0.75–1. Figures were assembled using Excel office 10.
Conclusion
Collectively, our study detected disturbances in tryptophan metabolism by measuring the expression levels of
three genes involved in tryptophan metabolic pathways. We found a decrease in the expression levels of MAOA,
HAAO and AADAT genes in ASD only. Learning disability children had no impairment in the metabolism of
tryptophan in relation to these three genes expression patterns. Accordingly, these genes can be used for early
diagnosis of autism and to differentiate between children with mild autism and children with learning disabilities
which may be more difficult to clinically tell apart. The current study supported the previous work which claimed
older maternal and/or paternal ages in addition to iron deficiency anemia along with vitamin D deficiency as
potential environmental risk factors for the predisposition of ASD and learning disabilities. To validate these
genes as markers, future studies on larger sample size and multi-central studies are required. Similar studies
regarding other genes involved in tryptophan metabolism could help in more understanding of the pathogenesis
and progression of autism and finding new biomarkers. Screening of pregnant mothers should be performed
and should include the measurement of maternal levels of our studied chemical risk factors including maternal
hemoglobin, iron and vitamin D levels. As well, the maternal expression levels of our selected genes could be
suggested in prospective studies to facilitate gene therapy studies and trials for treating and improving signs
and symptoms of ASD or for prenatal diagnosis and management. These findings help us to better understand
Scientific Reports | (2021) 11:6931 | https://doi.org/10.1038/s41598-021-86162-w 9
Vol.:(0123456789)www.nature.com/scientificreports/
and shed new light on the capable risk factors and their associations with some possible genetic etiology for the
pathogenesis of ASD and learning disabilities.
Received: 7 March 2019; Accepted: 7 March 2021
References
1. Autism spectrum disorders. Centers for disease control and prevention (CDC). https://www.cdc.gov/ncbddd/autism/data.html
(2018).
2. American Psychiatric Diagnostic and statistical manual of mental disorders (DSM-5®). American Psychiatric Pub. Association,
(2013).
3. Cortiella, C. & Horowitz, S. H. The state of learning disabilities: Facts, trends and emerging issues. New York: National center for
learning disabilities, 2–45 (2014).
4. University College London. "Learning disabilities affect up to 10 percent of children." ScienceDaily. ScienceDaily, 18 April 2013.
www.sciencedaily.com/releases/2013/04/130418142309.htm.
5. Rylaarsdam, L. & Guemez-Gamboa, A. Genetic causes and modifiers of autism spectrum disorder. Front. Cell. Neurosci. 13, 385
(2019).
6. Institute of Medicine (US) Committee on Nervous System Disorders in Developing Countries. Neurological, Psychiatric, and
Developmental Disorders: Meeting the Challenge in the Developing World. Washington (DC): National Academies Press (US);
2001. 5, Developmental Disabilities. https://www.ncbi.nlm.nih.gov/books/NBK223473/.
7. Bener, A., Khattab, A. O. & Al-Dabbagh, M. M. Is high prevalence of Vitamin D deficiency evidence for autism disorder? In a
highly endogamous population. J. Pediatr. Neurosci. 9(3), 227 (2014).
8. Golubeva, A. V. et al. Microbiota-related changes in bile acid & tryptophan metabolism are associated with gastrointestinal dys-
function in a mouse model of autism. EBioMedicine 24, 166–178 (2017).
9. Fernstrom, J. D. A perspective on the safety of supplemental tryptophan based on its metabolic fates–3. J. Nutr. 146(12),
2601S-2608S (2016).
10. Boccuto, L. et al. Decreased tryptophan metabolism in patients with autism spectrum disorders. Mol. Autism 4(1), 16 (2013).
11. Zablotsky, B., Black, L. I. & Blumberg, S. J. Estimated prevalence of children with diagnosed developmental disabilities in the
United States, 2014–2016. NCHS Data Brief 291, 1–8 (2017).
12. The American Academy of Child and Adolescent Psychiatry. Learning Disorders. Learning Disorders (aacap.org).
13. Sharma, P., Sagar, R., Pattanayak, R. & Mehta, M. Familial study of attentional and behavioural problems in children with Dyslexia
and their first-degree relatives in Indian setting. Asian J. Psychiat. https://doi.org/10.1016/j.ajp.2018.02.015 (2018).
14. Hansen, S. N. et al. Recurrence risk of autism in siblings and cousins: a multinational, population-based study. J. Am. Acad. Child
Adolesc. Psychiat. 58(9), 866–875. https://doi.org/10.1016/j.jaac.2018.11.017 (2019).
15. Miller, M. et al. Sibling recurrence risk and cross aggregation of attention-deficit/hyperactivity disorder and autism Spectrum
disorder. JAMA Pediatr. 173(2), 147–152 (2019).
16. Ozonoff, S. et al. Recurrence risk for autism spectrum disorders: a baby siblings research consortium study. Pediatrics 128, e488–
e495 (2011).
17. Messinger, D. et al. Early sex differences are not autism-spcific: a baby siblings research consortium (BSRC) study. Mol. Autism 6,
32 (2015).
18. Egawa, J., Watanabe, Y., Endo, T. & Someya, T. Association of rs2129575 in the tryptophan hydroxylase 2 gene with clinical phe-
notypes of autism spectrum disorders. Psychiat. Clin. Neurosci. 67(6), 457–458 (2013).
19. Shaw, C., Sheth, S., Li, D. & Tomljenovic, L. Etiology of autism spectrum disorders: genes, environment, or both. OA Autism 2(2),
11 (2014).
20. Parner, E. T. et al. Parental age and autism spectrum disorders. Ann. Epidemiol. 22(3), 143–150 (2012).
21. Van Balkom, I. D. et al. Paternal age and risk of autism in an ethnically diverse, non-industrialized setting: Aruba. PLoS ONE 7(9),
e45090 (2012).
22. Frans, E. M. et al. Autism risk across generations: a population-based study of advancing grandpaternal and paternal age. JAMA
Psychiat. 70(5), 516–521 (2013).
23. Lampi, K. M. et al. Parental age and risk of autism spectrum disorders in a Finnish national birth cohort.". J. Autism Dev. Disord.
43(11), 2526–2535 (2013).
24. Idring, S. et al. Parental age and the risk of autism spectrum disorders: findings from a Swedish population-based cohort. Int. J.
Epidemiol. 43(1), 107–115 (2014).
25. Gratten, J. et al. Risk of psychiatric illness from advanced paternal age is not predominantly from de novo mutations. Nat. Genet.
48(7), 718 (2016).
26. Gao, Y. et al. Association of grandparental and parental age at childbirth with autism spectrum disorder in children. JAMA Netw
Open. 3(4), e202868. https://doi.org/10.1001/jamanetworkopen.2020.2868 (2020).
27. Sandin, S. et al. Autism risk associated with parental age and with increasing difference in age between the parents. Mol. Psychiat.
21(5), 693 (2016).
28. Saha, S. et al. Advanced paternal age is associated with impaired neurocognitive outcomes during infancy and childhood. PLoS
Med. 6, e40 (2009).
29. Gunes, S., Ekinci, O. & Celik, T. Iron deficiency parameters in autism spectrum disorder: clinical correlates and associated factors.
Ital. J. Pediatr. 43(1), 86 (2017).
30. Chen, M. H. et al. Association between psychiatric disorders and iron deficiency anemia among children and adolescents: a
nationwide population-based study. BMC Psychiat. 13(1), 161 (2013).
31. Hergüner, S., Keleşoğlu, F. M., Tanıdır, C. & Çöpür, M. Ferritin and iron levels in children with autistic disorder. Eur. J. Pediatr.
171(1), 143–146 (2012).
32. Bener, A., Khattab, A. O., Bhugra, D. & Hoffmann, G. F. Iron and vitamin D levels among autism spectrum disorders children.
Ann. Afr. Med. 16(4), 186 (2017).
33. Liu, X. et al. Correlation between nutrition and symptoms: nutritional survey of children with autism spectrum disorder in
Chongqing, China. Nutrients 8(5), 294 (2016).
34. Schmidt, R. J., Tancredi, D. J., Krakowiak, P., Hansen, R. L. & Ozonoff, S. Maternal intake of supplemental iron and risk of autism
spectrum disorder. Am. J. Epidemiol. 180(9), 890–900 (2014).
35. Sabir, M. S. et al. Optimal vitamin D spurs serotonin: 1, 25-dihydroxyvitamin D represses serotonin reuptake transport (SERT)
and degradation (MAO-A) gene expression in cultured rat serotonergic neuronal cell lines. Genes Nutr. 13(1), 19 (2018).
36. Cannell, J. J. Vitamin D and autism, what’s new?". Rev. Endocr. Metab. Disord. 18(2), 183–193 (2017).
37. Larson, J. S. Gestational vitamin D and its relationship with autism spectrum disorders (University of California, 2016).
38. Vinkhuyzen, A. A. et al. Gestational vitamin D deficiency and autism-related traits: the generation R study. Mol. Psychiat. 23,
240–246 (2016).
Scientific Reports | (2021) 11:6931 | https://doi.org/10.1038/s41598-021-86162-w 10
Vol:.(1234567890)www.nature.com/scientificreports/
39. Whitehouse, A. J. et al. Maternal vitamin D levels and the autism phenotype among offspring. J. Autism Dev. Disord. 43(7),
1495–1504 (2013).
40. Lee, B. K. et al. Developmental vitamin D and autism spectrum disorders: findings from the Stockholm Youth Cohort. Mol Psychiat.
https://doi.org/10.1038/s41380-019-0578-y (2019).
41. Feng, J. et al. Clinical improvement following vitamin D3 supplementation in autism spectrum disorder. Nutr. Neurosci. 20(5),
284–290 (2017).
42. Cebulla B. Higher risk of vitamin D deficiency for people with learning disabilities. The Learning Disabilities Elf, (2014). Vitamin
D deficiency found in people with learning disabilities (nationalelfservice.net).
43. Frighi, V. et al. Vitamin D deficiency in patients with intellectual disabilities: prevalence, risk factors and management strategies.
Br. J. Psychiat. 205, 1–7 (2014).
44. El-Ansary, A. et al. In the search for reliable biomarkers for the early diagnosis of autism spectrum disorder: the role of vitamin
D. Metab. Brain Dis. 33(3), 917–931 (2018).
45. Zhang, Z., Li, S., Yu, L. & Liu, J. Polymorphisms in vitamin D receptor genes in association with childhood autism spectrum
disorder. Dis. Markers, (2018).
46. Biswas, S., Kanwal, B., Jeet, C. & Seminara, R. S. Fok-I, Bsm-I, and Taq-I variants of vitamin D receptor polymorphism in the
development of autism spectrum disorder: a literature review. Cureus 10(8), e3228 (2018).
47. El-Meshad, G., El-Nabi, S. A., Moharam, N. & El-Khair, M. A. The plasma zinc/serum copper ratio as a biomarker in dwith autism
spectrum disorders. Menoufia Med. J. 30(3), 727–727 (2017).
48. Sensi, S. L. et al. The neurophysiology and pathology of brain zinc. J. Neurosci. 31, 16076–16085 (2011).
49. Lakshmi, P. & Geetha, A. Level of trace elements (Cu2+, zinc, magnesium and selenium) and toxic elements (lead and mercury)
in the hair and nail of children with autism. Biol. Trace Elem. Res. 142, 148–158 (2011).
50. Li, S. O., Wang, J. L., Bjørklund, G., Zhao, W. N. & Yin, C. H. Serum copper and zinc levels in individuals with autism spectrum
disorders. NeuroReport 25(15), 1216–1220 (2014).
51. Sayehmiri, F. et al. Zn/Cu levels in the field of autism disorders: a systematic review and meta-analysis. Iran. J. Child Neurol. 9(4),
1 (2015).
52. Madsen, E. & Gitlin, J. D. Copper and iron disorders of the brain. Annu. Rev. Neurosci. 30, 317–337 (2007).
53. Shi, H. et al. NAD deficiency, congenital malformations, and niacin supplementation. N. Engl. J. Med. 377(6), 544–552 (2017).
54. Gevi, F., Zolla, L., Gabriele, S. & Persico, A. M. Urinary metabolomics of young Italian autistic children supports abnormal tryp-
tophan and purine metabolism. Mol. Autism 7(1), 47 (2016).
55. Williams, M. et al. Maternal inflammation results in altered tryptophan metabolism in rabbit placenta and fetal brain. Dev. Neurosci.
39(5), 399–412 (2017).
56. Goeden, N. S. Dysfunctional Placental Tryptophan Metabolism Is a Molecular Mechanism Linking Maternal Inflammation to
Altered Fetal Neurodevelopment and Adult Neurological Function. University of Southern California, (2017).
57. Bortolato, M., Floris, G. & Shih, J. C. From aggression to autism: new perspectives on the behavioral sequelae of monoamine
oxidase deficiency. J. Neural Trans. 125, 1–11 (2018).
58. Jaiswal, P. et al. SLC6A4 markers modulate platelet 5-HT level and specific behaviors of autism: a study from an Indian population.
Prog. Neuropsychopharmacol. Biol. Psychiat. 56, 196–206 (2015).
59. Levin, D. T. et al. Parental broader autism subphenotypes in ASD affected families: relationship to gender, child’s symptoms, SSRI
treatment, and platelet serotonin. Autism Res. 6(6), 621–630 (2013).
60. Harrington, R. A., Lee, L. C., Crum, R. M., Zimmerman, A. W. & Hertz-Picciotto, I. Serotonin hypothesis of autism: implications
for selective serotonin reuptake inhibitor use during pregnancy. Autism Res. 6(3), 149–168 (2013).
61. Mulder, E. J. et al. Urinary excretion of 5-hydroxyindoleacetic acid, serotonin and 6-sulphatoxymelatonin in normoserotonemic
and hyperserotonemic autistic individuals. Neuropsychobiology 61(1), 27–32 (2010).
62. Nabi, R., Serajee, F. J., Chugani, D. C., Zhong, H. & Huq, A. M. Association of tryptophan 2, 3 dioxygenase gene polymorphism
with autism. Am. J. Med. Genet. B Neuropsychiatr. Genet. 125(1), 63–68 (2004).
63. Keszthelyi, D., Troost, F. & Masclee, A. Understanding the role of tryptophan and serotonin metabolism in gastrointestinal func-
tion. Neurogastroenterol. Motil. 21(12), 1239–1249 (2009).
64. Abdulamir, H. A., Abdul-Rasheed, O. F. & Abdulghani, E. A. Serotonin and serotonin transporter levels in autistic children. Saudi
Med. J. 39(5), 487–494 (2018).
65. Muller, C. L., Anacker, A. M. & Veenstra-VanderWeele, J. The serotonin system in autism spectrum disorder: from biomarker to
animal models. Neuroscience 321, 24–41 (2016).
66. Gu, F., Chauhan, V. & Chauhan, A. Monoamine oxidase-a and B activities in the cerebellum and frontal cortex of children and
young adults with autism. J. Neurosci. Res. 95(10), 1965–1972 (2017).
67. Bryn, V. et al. Kynurenine pathway in autism spectrum disorders in children. Neuropsychobiology 76, 82–88 (2017).
68. Lugo-Huitrón, R. et al. Quinolinic acid: an endogenous neurotoxin with multiple targets. Oxid. Med. Cell. Longev. https://doi.org/
10.1155/2013/104024 (2013).
69. Goh, D. L. et al. Characterization of the human gene encoding alpha-aminoadipate aminotransferase (AADAT). Mol. Genet. Metab.
76(3), 172–180. https://doi.org/10.1016/s1096-7192(02)00037-9 (2002).
70. Li, S. J. et al. Two de novo variations identified by massively parallel sequencing in 13 Chinese families with children diagnosed
with autism spectrum disorder. Clin. Chim. Acta 479, 144–147 (2018).
71. Elliott, S. N. & Fuchs, L. S. The utility of curriculum-based measurement and performance assessment as alternatives to traditional
intelligence and achievement tests. Sch. Psychol. Rev. 26(2), 224–233 (1997).
72. Chlebowski, C., Green, J. A., Barton, M. L. & Fein, D. Using the childhood autism rating scale to diagnose autism spectrum dis-
orders. J. Autism Dev. Disord. 40(7), 787–799 (2010).
Acknowledgements
The current study was supported by the Faculty of Medicine, Minia University, Egypt. A number of patients
included in our study were supported by Kayan charity for education and rehabilitation of autistic children, Minia
Branch, Minia, Egypt. The authors would like to express their gratitude to the participants involved in this study.
Author contributions
A.M.H. suggested the main idea of the research, planned the study design, hypothesis and objectives, chose the
proper laboratory analytical methods, and carried them out, performed the statistical analysis, wrote the main
manuscript text, prepared figures, and tables, and rewrote the manuscript with all required revisions after review-
ers and editors comments. H.M.K., E.A.A. shared in formatting the idea and in designing the research and helped
in all steps of the research. N.M.A. shared in formatting the idea as well as the design of the research, collected
the samples from participants, performed the laboratory work and shared in writing the manuscript. D.M.M.
performed the clinical data collection, clinical examinations, and selection of the subjects. She took a part in
Scientific Reports | (2021) 11:6931 | https://doi.org/10.1038/s41598-021-86162-w 11
Vol.:(0123456789)www.nature.com/scientificreports/
rewriting the manuscript after revision. A.M.O. shared in formatting the idea and in designing the research. As
the main mentor of the lab, he helped each one in data analysis by his guide information and critical thinking.
Competing interests
The authors declare no competing interests.
Additional information
Correspondence and requests for materials should be addressed to A.M.H.
Reprints and permissions information is available at www.nature.com/reprints.
Publisher’s note Springer Nature remains neutral with regard to jurisdictional claims in published maps and
institutional affiliations.
Open Access This article is licensed under a Creative Commons Attribution 4.0 International
License, which permits use, sharing, adaptation, distribution and reproduction in any medium or
format, as long as you give appropriate credit to the original author(s) and the source, provide a link to the
Creative Commons licence, and indicate if changes were made. The images or other third party material in this
article are included in the article’s Creative Commons licence, unless indicated otherwise in a credit line to the
material. If material is not included in the article’s Creative Commons licence and your intended use is not
permitted by statutory regulation or exceeds the permitted use, you will need to obtain permission directly from
the copyright holder. To view a copy of this licence, visit http://creativecommons.org/licenses/by/4.0/.
© The Author(s) 2021
Scientific Reports | (2021) 11:6931 | https://doi.org/10.1038/s41598-021-86162-w 12
Vol:.(1234567890)You can also read