MAPPING SUBSURFACE IN KARST TERRAIN USING 2-D ELECTRICAL RESISTIVITY TOMOGRAPHY
←
→
Page content transcription
If your browser does not render page correctly, please read the page content below
SAGEEP 2018                          Nashville, Tennessee USA                   http://www.eegs.org

   MAPPING SUBSURFACE IN KARST TERRAIN USING 2-D ELECTRICAL
                  RESISTIVITY TOMOGRAPHY
                              Kenneth J. Bansah, Missouri S&T, Rolla, MO
                               Neil L. Anderson, Missouri S&T, Rolla MO

                                                Abstract
        Karst terrain is a unique and complex environment and has been a subject of increasing
investigation for engineering, geotechnical, environmental, and archeological purposes. In this study, the
electrical resistivity tomography (ERT) technique was used to image a test site in southwestern Missouri
with the goal to map variable depth-to-bedrock and to characterize subsurface lithologic conditions. The
ERT technique employed a multi-electrode resistivity system, powered by a 12–volt deep cycle marine
battery, 5 feet electrode spacing, and a dipole-dipole array configuration with the intent to map the
subsurface to a depth of at least 100 feet. The output, a two-dimensional (2-D) resistivity profile, was
verified and constrained with active multichannel analysis of surface waves (MASW) data. The
resistivity of the soils and pervasively fractured bedrock was observed to be mostly controlled by
moisture content. Based on the moisture content, the soils and rocks were classified into moist soil (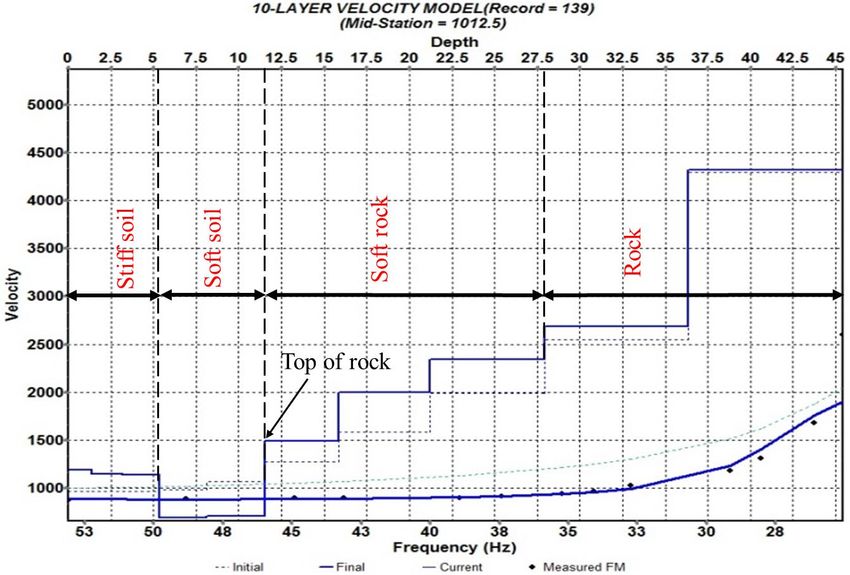
SAGEEP 2018                          Nashville, Tennessee USA                   http://www.eegs.org

        In this study, the electrical resistivity tomography (ERT) technique was used to map a karst
terrain which has been a subject of geophysical study in southwestern Missouri, USA over the past three
years. The ERT technique basically involves the passage of electrical current into the ground through a
pair of electrodes and the measurement of potential difference by another pair of electrodes to estimate
subsurface resistivity distributions that can be used for geological interpretations.

                                               Methods
        A multi-electrode resistivity system of 168 electrodes was used to acquire ERT data along west-
east traverses spaced at 100 feet. The electrodes were spaced at 5 feet interval with the intent to image
the subsurface to a depth of at least 100 feet. The dipole-dipole array configuration which has produced
very reliable and high quality ERT data in previous studies (Bansah & Anderson, 2017a) at the test site
was employed. The field data (resistivity measurements) were processed into 2-D ERT profiles using the
RES2DINV software. To verify and constrain the ERT interpretations, 1-D active multichannel analysis
of surfaces waves (MASW) data were acquired along north-south traverses as depicted in Figure 1. The
active MASW survey adopted a multi-channel seismograph with 24 geophones spaced at 5 feet,
geophone frequency of 4.5 Hz, 20-pounds sledge hammer as an acoustic source, and a source offset of
10 feet. Borehole control was acquired as an additional verification; however, only the ERT and active
MASW are presented in this paper.
        The test site is located near the city of Springfield in southwestern Missouri. Bedrock is
Mississippian limestones and cherty limestones which are underlain by Ordovician and Cambrian rocks.
The bedrock, which is exposed in some places, is pervasively fractured and extensively karsted. The
active MASW procedure, test site location, and geological setting are further described by Bansah and
Anderson (2017b).

Figure 1: An illustration of the ERT and MASW configurations. The figure is not drawn to scale. ERT
traverse is 835 feet long; MASW is 115 feet long.

                                                Results
        An example 2-D ERT profile with superposed geologic interpretations is shown in Figure 2. The
2-D ERT profile shows that the rock is pervasively fractured with varying depth-to-top of rock. The top
of rock is depicted by the dark dotted line (125 ohm.m contour) and can be located at depth as deep as
40 feet and as shallow as 7 feet. Resistivity of the subsurface is a function of moisture content, clay
content, salinity, porosity, and permeability. Resistivity at the test location is largely controlled by
moisture content and thus, in the 2-D ERT profile, soil and rock have been classified into dry soil, moist
soil, moist rock, and dry rock. Dry surficial soil has resistivity 125 ohm.m and is underlain by moist soil
with resistivity
SAGEEP 2018 Nashville, Tennessee USA http://www.eegs.org
the pervasively fractured bedrock shown in the 2-D ERT profile in many instances appeared to portray
the surface topography; that is, depressions in the top of rock in many areas, manifest in the surface
topography.
Figure 2: Example 2-D ERT profile with superposed geologic interpretations.
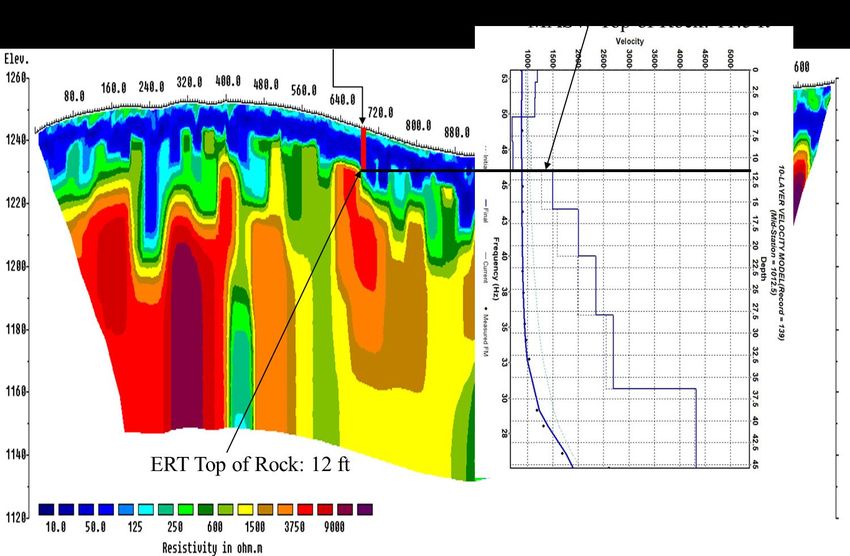
Figure 3 is a 1-D MASW profile acquired with the goal to verify and constrain the ERT
interpretations. The shear-wave velocity of soil/rock on the 1-D MASW profile varies from 550 ft/s to
about 4300 ft/s, an indication of marked variation in stiffness. Based on the National Earthquake Hazard
Reduction Program’s (NEHRP) soil/rock classification criteria, soil and rock at the test location were
classified into stiff soil (1200 ft/s), soft soil (550 ft/s), soft rock (1500 ft/s to 2400 ft/s), and rock (> 2500
ft/s). In Figure 4, the 1-D MASW profile was superposed on the 2-D ERT profile. At the 700 foot mark,
where the MASW ties with the ERT, estimated depth-to-top of rock on the 1-D MASW profile is 11.5
feet, while that on the 2-D ERT profile is 12 feet.
The MASW data and interpretations were observed to be consistent with the ERT
interpretations; the MASW data reasonably verifies and validates the ERT data. Similar observations on
the consistency of ERT and MASW data in the study area have previously been reported by Bansah and
Anderson (2017b). Thus, in the absence of borehole control and other data verification techniques,
active MASW could be a useful technique for verifying and constraining ERT data.SAGEEP 2018 Nashville, Tennessee USA http://www.eegs.org Figure 3: 1-D MASW profile. MASW data were acquired transversely to ERT traverse. Figure 4: 2-D ERT profile with superposed corresponding 1-D MASW profile.
SAGEEP 2018                           Nashville, Tennessee USA                     http://www.eegs.org

                                                Conclusion
         The ERT technique was used to map variations in depth-to-top of rock and to characterize
soil/rock in a complex karst terrain. The ERT data were acquired with a multi-electrode resistivity
system at a study location in southwestern Missouri, USA. MASW data acquired perpendicular to the
orientation of the ERT traverses were used to verify and constrain the ERT interpretations. Rocks at the
study location were pervasively fractured and showed marked variations in depth-to-top of rock.
         Resistivity of soil/rock was mostly controlled by moisture content; thus, soil and rock were
classified into dry soil (125 ohm.m), moist soil (1500 ohm.m). Based on the shear-wave velocity data from active MASW survey and reference to
the NEHRP criteria, the soil profile consisted of stiff soil (1200 ft/s), soft soil (550 ft/s), soft rock (1500
ft/s to 2400 ft/s), and rock (>2500 ft/s). Depressions in the pervasively fractured bedrock in many areas
were observed to manifest in the surface topography; thus, the topography of the pervasively fractured
bedrock in the study area can be described as being a function of the surface topography. The active
MASW data were consistent with the ERT data; hence, active MASW can be a technique of choice for
verifying and constraining ERT data.

                                                    References
Bansah, K., & Anderson, N. (2017a), Factors Contributing to Karst Development in Southwestern
      Missouri, USA, In Symposium on the Application of Geophysics to Engineering and
      Environmental Problems, Society of Exploration Geophysicists and Environment and
      Engineering Geophysical Society, 219-223. https://doi.org/10.4133/SAGEEP.30-013
Bansah, K. J., & Anderson, N. L. (2017b), Multichannel Analysis of Surface Waves: Estimating Depth
      to Bedrock and Acoustic Properties in Karst Terrain, In 51st US Rock Mechanics/Geomechanics
      Symposium. American Rock Mechanics Association.
Debeglia, N., Bitri, A., & Thierry, P. (2006), Karst Investigations Using Microgravity and MASW;
      Application to Orléans, France, Near Surface Geophysics, 4(4), 215-225.
Dobecki, L. T. & Upchurch, B. S. (2006), Geophysical Applications to Detect Sinkholes and Ground
      Subsidence, The Leading Edge, 25(3), 336-341. https://doi.org/10.1190/1.2184102
Gibson, P. (2004), Application of Resistivity and Magnetometry Geophysical Techniques for Near-
      Surface Investigations in Karstic Terranes in Ireland, Journal of Cave and Karst Studies, 66 (2).
      35-38. ISSN 1090-6924
Grandjean, G., Gourry, J. C., & Bitri, A. (2000), Evaluation of GPR Techniques for Civil-Engineering
       Applications: Study on a Test Site, Journal of Applied Geophysics, 45(3), 141-156.
Styles, P., McGrath, R., Thomas, E., & Cassidy, N. J. (2005), The Use of Microgravity for Cavity
        Characterization in Karstic Terrains, Quarterly Journal of Engineering Geology and
        Hydrogeology, 38(2), 155-169.
Šumanovac, F., & Weisser, M. (2001), Evaluation of Resistivity and Seismic Methods for
     Hydrogeological Mapping in Karst Terrains, Journal of Applied Geophysics, 47(1), 13-28.
You can also read