Lifting Condensation Level Height (LCL Height) Value-Added Product Report - DOE/SC-ARM-TR-242 - Atmospheric Radiation ...
←
→
Page content transcription
If your browser does not render page correctly, please read the page content below
DOE/SC-ARM-TR-242

Lifting Condensation Level Height (LCL Height)
Value-Added Product Report

T Toto A Vogelmann
S Endo K Gaustad
S Giangrande

April 2020
DISCLAIMER

This report was prepared as an account of work sponsored by the U.S.
Government. Neither the United States nor any agency thereof, nor any of
their employees, makes any warranty, express or implied, or assumes any
legal liability or responsibility for the accuracy, completeness, or
usefulness of any information, apparatus, product, or process disclosed, or
represents that its use would not infringe privately owned rights. Reference
herein to any specific commercial product, process, or service by trade
name, trademark, manufacturer, or otherwise, does not necessarily
constitute or imply its endorsement, recommendation, or favoring by the
U.S. Government or any agency thereof. The views and opinions of
authors expressed herein do not necessarily state or reflect those of the
U.S. Government or any agency thereof.
DOE/SC-ARM-TR-242

Lifting Condensation Level Height
(LCL Height) Value-Added Product Report

T Toto, Brookhaven National Laboratory (BNL)
A Vogelmann, BNL
S Endo, BNL
K Gaustad, Pacific Northwest National Laboratory
S Giangrande, BNL

April 2020

Work supported by the U.S. Department of Energy,
Office of Science, Office of Biological and Environmental Research
T Toto et al., April 2020, DOE/SC-ARM-TR-242

 Acronyms and Abbreviations
ARM Atmospheric Radiation Measurement
LASSO LES ARM Symbiotic Simulation and Observation
LCL lifting condensation level
LES large-eddy simulation
MAWS meteorological automatic weather station
MET surface meteorological system
NetCDF Network Common Data Form
OKM Oklahoma Mesonet
SGP Southern Great Plains
VAP value-added product

 iii
T Toto et al., April 2020, DOE/SC-ARM-TR-242

 Contents
Acronyms and Abbreviations ...................................................................................................................... iii
1.0 Introduction .......................................................................................................................................... 1
2.0 Input Data ............................................................................................................................................. 1
3.0 Algorithm and Methodology ................................................................................................................ 2
4.0 Output Data .......................................................................................................................................... 3
5.0 Summary............................................................................................................................................... 4
6.0 Example Plots ....................................................................................................................................... 4
7.0 References ............................................................................................................................................ 5

 Figures
1 Flowchart describes the processing of a 24-hour period (1 day) of surface meteorological data. ......... 2
2 Flowchart describes the LCL algorithm as performed for each time step.............................................. 3
3 Quick look image produced by the LCL VAP on 20180505. ................................................................ 4

 Tables
1 Input variables. ....................................................................................................................................... 1
2 Major output variables............................................................................................................................ 4

 iv
T Toto et al., April 2020, DOE/SC-ARM-TR-242

1.0 Introduction
 The lifting condensation level height (LCL, m) is determined from continuous surface-air observations of
 relative humidity and temperature as the altitude where the surface-air moisture equals saturation
 following a dry-adiabatic ascent. Values are computed from surface meteorological observations for 16
 facilities belonging to the U.S. Department of Energy Atmospheric Radiation Measurement (ARM) user
 facility Southern Great Plains (SGP) atmospheric observatory and for 133 Oklahoma Mesonet (OKM)
 stations.

 The LCL Height Value-Added Product (VAP) was developed for use by the Large-Eddy Simulation
 (LES) ARM Symbiotic Simulation and Observation (LASSO) project (Gustafson et al. 2016, 2017, 2018,
 2020).

2.0 Input Data
 The LCL VAP takes in data from ARM surface meteorology systems (MET) (Ritsche 2011) at 16
 facilities in north central Oklahoma. The systems use conventional in situ sensors to collect 1-min
 observations of temperature, relative humidity, pressure, wind speed, wind direction, and precipitation. In
 the event that a MET data file for a day is unavailable for SGP E13, the meteorological automatic weather
 station (MAWS) data (Holdridge and Kyrouac 2017) at SGP C1 is used.

 The LCL VAP also takes in 5-min time resolution meteorological data provided by the OKM stations
 (sponsored by the University of Oklahoma and Oklahoma State; Brock et al. 1995).

 Table 1. Input variables.
 Input Variables for ARM SGP facilities
 met.b1 mawsC1.b1
 (if metE13.b1 is not available)
 alt alt
 atmos_pressure atmospheric_pressure
 lat lat
 lon lon
 rh_mean atmospheric_relative_humidity
 temp_mean atmospheric_temperature

 Input Variables for OKM stations
 05okm.b1
 alt
 pres
 lat
 lon
 rh
 tdry_1_5m
 platform

 1
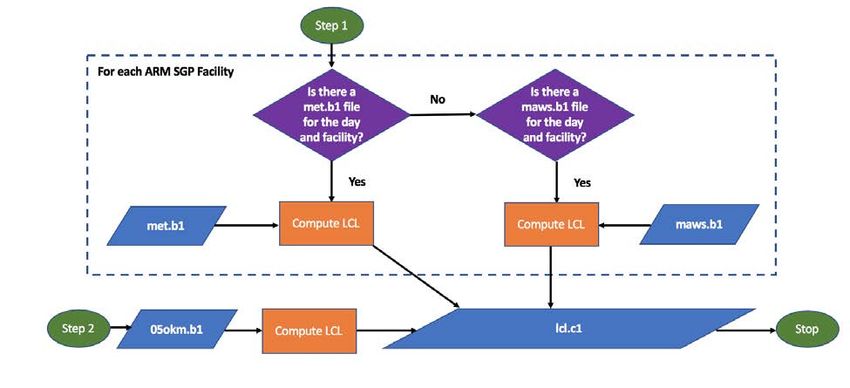
T Toto et al., April 2020, DOE/SC-ARM-TR-242

3.0 Algorithm and Methodology
 The data flow of the LCL VAP is depicted in Figure 1. For each ARM facility, if there is a met.b1 data
 file for the day, the LCL is computed from that data. For the SGP E13 facility, if there is no met.b1 data
 file for a particular day, the maws.b1 datastream for SGP C1 is used. For all OKM stations, the 05okm.b1
 datastream is used.

 Figure 1. Flowchart describes the processing of a 24-hour period (1 day) of surface meteorological
 data.

 A parcel method is adopted to determine LCL as the height at which the parcel water vapor
 mixing ratio reaches parcel saturation water vapor mixing ratio , thus:

 = ( = )

 where is LCL height, and z is parcel height.

 In the adiabatic air parcel, the initial water vapor mixing ratio is conserved whereas temperature
 and pressure decrease, respectively, following dry adiabatic lapse rate:

 = −

 and hydrostatic equilibrium:

 = −

 where is gravitational acceleration, is the specific heat constant, and is air density that is
 also a function of and .

 2
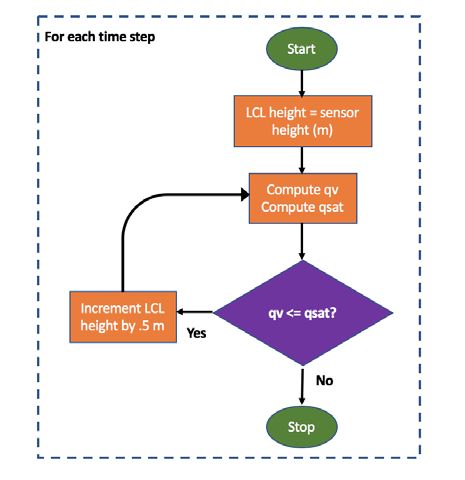
T Toto et al., April 2020, DOE/SC-ARM-TR-242

 Following the temperature and pressure changes, the saturation water vapor is calculated by:

 ( )
 ( , ) = 0.622 ∗
 – ( )

 where is saturation vapor pressure given by a variation of Teten’s approximation:
 7.5
 ( ) = 6.11 × 10237.7+

 where = − 273.15 is temperature in Celsius.

 The implemented algorithm is explained in Figure 2. For each 0.5 m increment in , the
 thermodynamic state of the parcel ( , and ) is updated, and the parcel is then evaluated
 against until the parcel becomes smaller than and the LCL height is determined.

 Figure 2. Flowchart describes the LCL algorithm as performed for each time step.

4.0 Output Data
 This VAP outputs a daily NetCDF file containing 1-min time resolution estimates of LCL heights for
 each SGP facility and effective 5-min time resolution estimates of LCL for the OKM stations. Included
 also are the temperature, relative humidity, and pressure used to compute LCL, as well as the latitude,
 longitude, and altitude of each SGP facility or OKM station.

 3
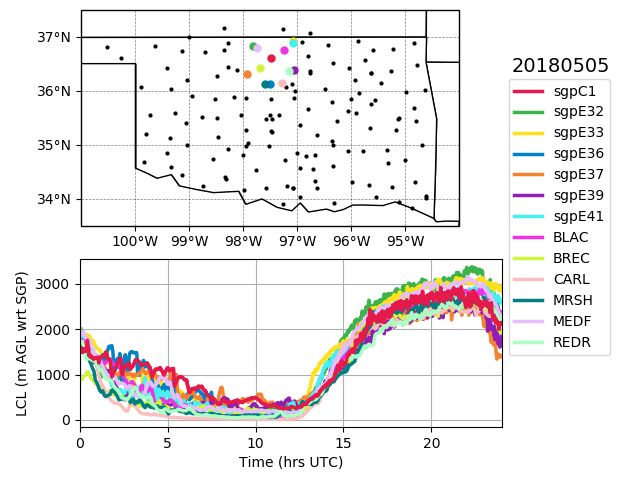
T Toto et al., April 2020, DOE/SC-ARM-TR-242

 Table 2. Major output variables.
 Datastream lcl.c1 fields
 lcl (time, stations)
 temperature (time, stations)
 relative_humidity (time, stations)
 pressure (time, stations)

5.0 Summary
 The LCL Height VAP computes lifting condensation level heights for the ARM SGP facilities and the
 OKM stations. The VAP is being used to evaluate shallow convection LES models at the ARM SGP
 through the LASSO project.

6.0 Example Plots
 Quicklook images are produced for each day of LCL processing. Figure 3 presents a sample output.

 Figure 3. Quick look image produced by the LCL VAP on 20180505. For each black and colored dot
 on the map of Oklahoma, an LCL time series is computed. The time series plot only shows
 the LCLs for the colored dots on the map, which are the stations/facilities within 60 km of
 SGP C1, for which names are indicated in the legend. The time series of LCLs are in meters
 above ground level with respect to the height of SGP C1.

 4
T Toto et al., April 2020, DOE/SC-ARM-TR-242

7.0 References
 MT Ritsche. 2011. ARM Surface Meteorology Systems Handbook. U.S. Department of Energy.
 DOE/SC-ARM/TR-086,
 http://www.arm.gov/publications/tech_reports/handbooks/met_handbook.pdf?id=88

 Brock, FV, KC Crawford, RL Elliott, GW Cuperus, SJ Stadler, HL Johnson, and MD Eilts. 1995. “The
 Oklahoma Mesonet: A Technical Overview.” Journal of Atmospheric and Oceanic Technology
 12(1): 5−19, https://doi.org/10.1175/1520-0426(1995)0122.0.CO;2

 Gustafson, WI, AM Vogelmann, X Cheng, S Endo, B Krishna, Z Li, T Toto, and H Xiao. 2016.
 Description of the LASSO Alpha 1 Release. U.S. Department of Energy. DOE/SC-ARM-TR-194,
 https://doi.org/10.2172/1373564

 Gustafson, WI, AM Vogelmann, X Cheng, S Endo, B Krishna, Z Li, T Toto, and H Xiao. 2017.
 Description of the LASSO Alpha 2 Release. U.S. Department of Energy. DOE/SC-ARM-TR-199,
 https://doi.org/10.2172/1376727

 Gustafson, WI, AM Vogelmann, X Cheng, S Endo, KL Johnson, B Krishna, Z Li, T Toto, and H Xiao.
 2018. Description of the LASSO Data Bundles Product. U.S. Department of Energy.
 DOE/SC-ARM-TR-216, https://doi.org/10.2172/1469590

 Gustafson, WI, AM Vogelmann, Z Li, X Cheng, KK Dumas, S Endo, KL Johnson, B Krishna, Z Li,
 T Toto, and H Xiao. 2020. “The Large-Eddy Simulation (LES) Atmospheric Radiation Measurement
 (ARM) Symbiotic Simulation and Observation (LASSO) Activity for Continental Shallow Convection.”
 Bulletin of the American Meteorological Society 101(4), https://doi.org/10.1175/BAMS-D-19-0065.1

 Holdridge, DJ, and JA Kyrouac. 2017. Meteorological Automatic Weather Station (MAWS) Instrument
 Handbook. U.S. Department of Energy. DOE/SC-ARM-TR-195,
 https://www.arm.gov/publications/tech_reports/handbooks/maws_handbook.pdf?id=27

 5
You can also read