Seismotectonic framework of the Feb 27, 2010 Mw 8.8 Maule, Chile earthquake sequence
←
→
Page content transcription
If your browser does not render page correctly, please read the page content below
Seismotectonic framework of the
     Feb 27, 2010 Mw 8.8 Maule,
      Chile earthquake sequence
mainshock slip distribution, aftershock relocations, and regional
                        moment tensors
        Gavin P Hayes, Kendra Johnson, Harley Benz
                   USGS NEIC, Golden, CO
                       Eric Bergman
           Global Seismological Services, Golden, CO
                 Anne Meltzer, Lucy Brown
                   Lehigh University, PA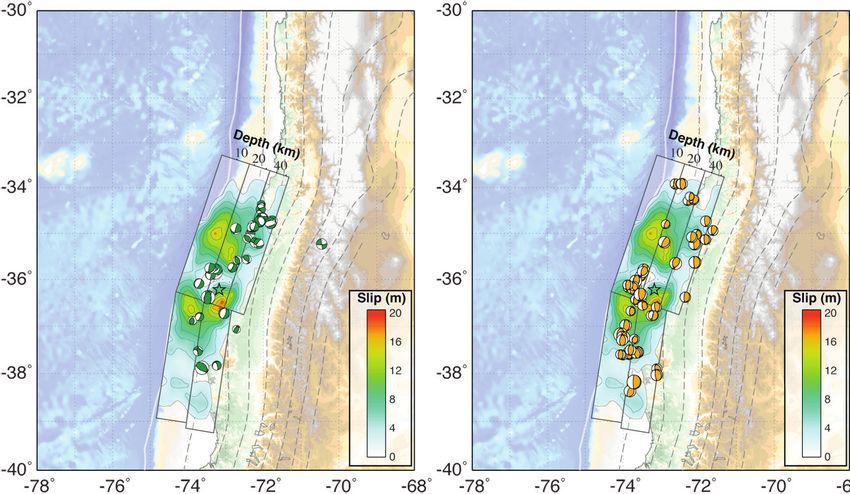
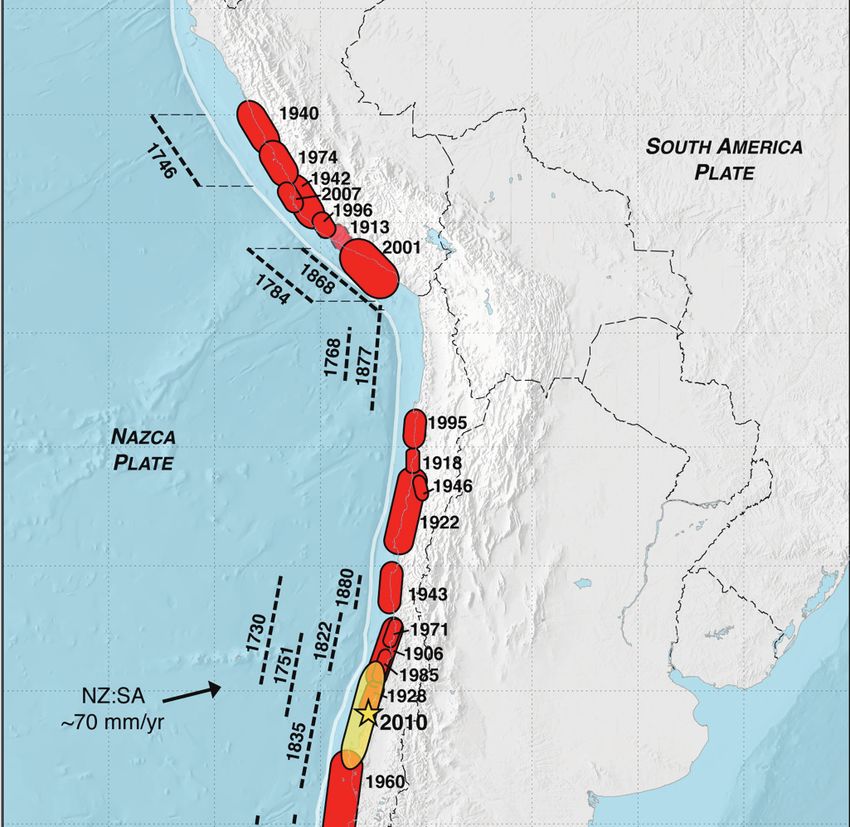
Tectonic Setting
 Long, well-documented
 history of large/great EQs.

 The South America
 subduction zone has both
 the shallow dip and deep
 coupled-uncoupled
 transition (~50 km)
 capable of producing very
 large EQs.

Compiled from Beck et al, 1998; Lay &
Kanamori, 1981; Chlieh et al., 2004; Dorbath et
al., 1990; Biggs et al., 2009.
Tectonic Setting
Interface south of epicenter
= South Chile Seismic Gap
(Ruegg et al., 2009) - had
not slipped since 1835.

Region to north partly
failed in 1906, ‘28 and ‘85.

2010-02-27: Maule EQ, Mw
8.8, ~400 km rupture
along-strike. At the time,
5th largest in instrumental
era.
Maule Response
160 mostly broadband
sensors deployed as the
International Maule
Aftershock Deployment
(IMAD) temporary
network; an
international
collaboration involving:

- Chilean Universities
- IRIS, USA
- INSU, CNRS, France
- GFZ, Germany
- U. of Liverpool, UK

Data open-access
following their collection
(most stations operated
for ~9 months).
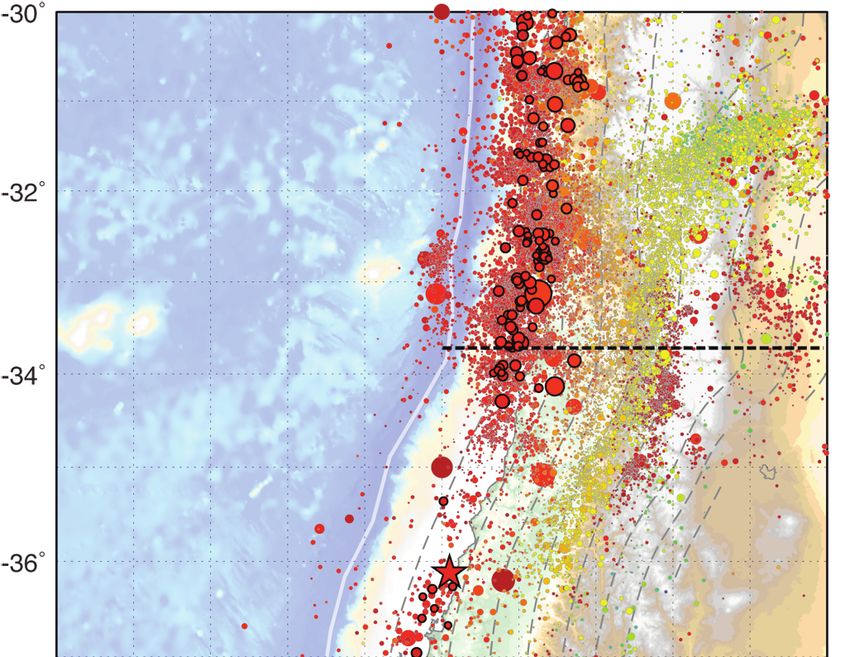
Maule Aftershock Data
Maule Aftershock Data

 30,000 events automatically located with PA-HYDRA, an offline
 module mimicking NEIC’s realtime data processing system.

 We have relocated the highest quality ~10% of these events, and
 performed moment tensor analyses on the largest ~500.

 Other analyses of the IMAD data include:

 - Lange et al. (2012): automatically picked, 6 month catalog, 20,000+
 aftershocks.

  - Rietbrock et al. (2012): automatically picked, 2 month catalog,
  30,000+ aftershocks. ~100 regional moment tensors.

 - Agurto et al. (2012): MT catalog of 125 RMTs, 150 gCMTs.
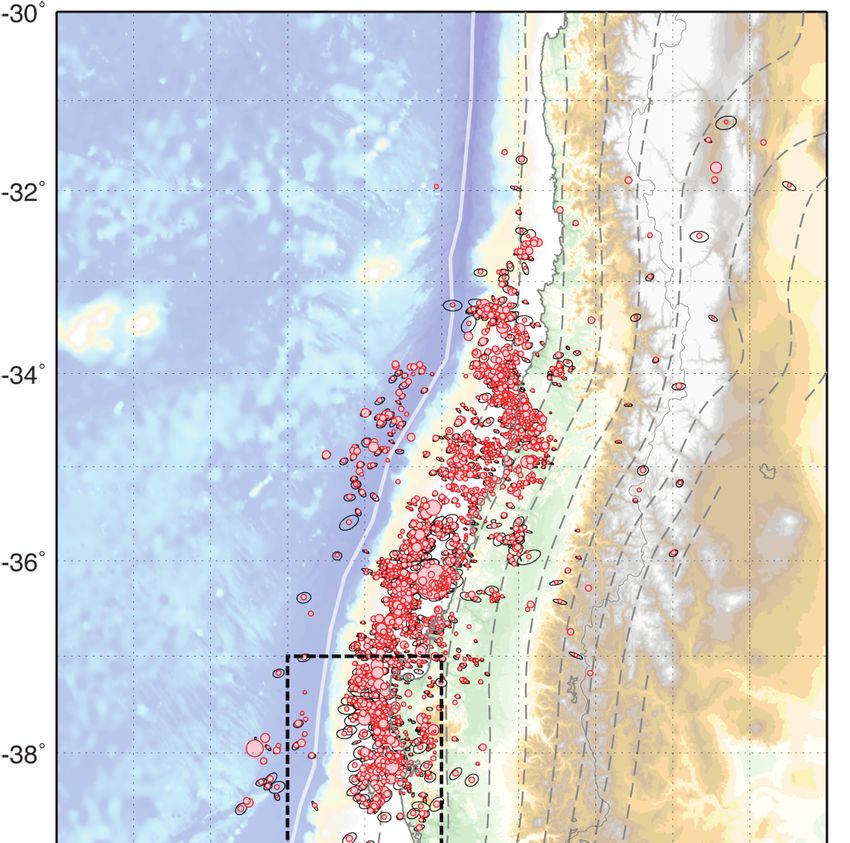
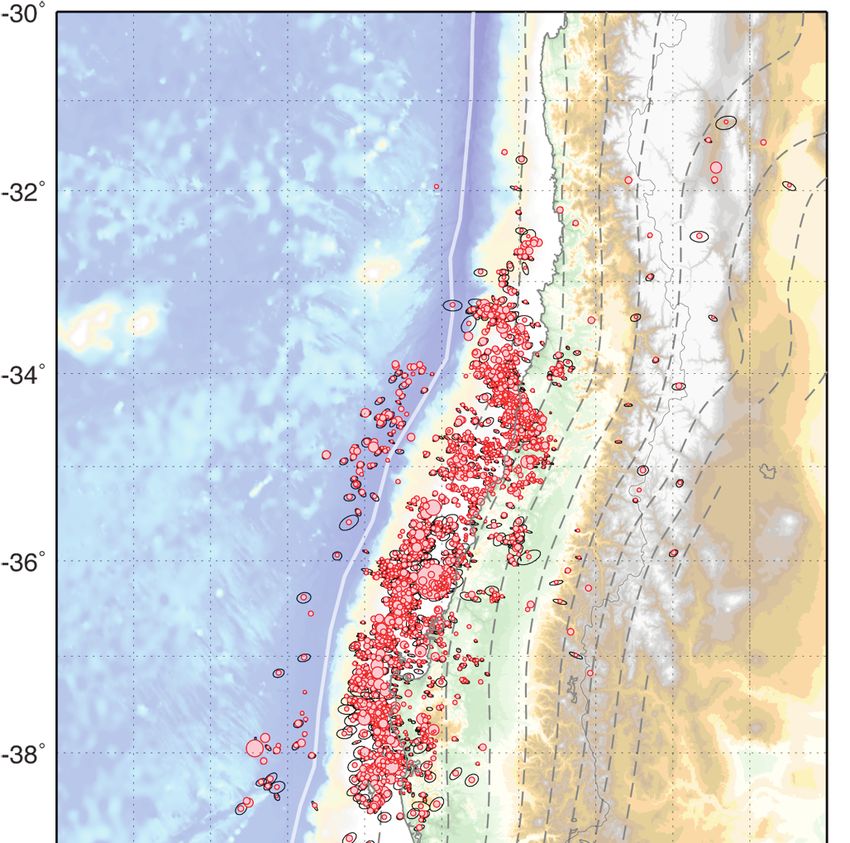
Relocated
Aftershocks

2,500 events, relocated
using a multiple event
location approach
(Hypocentral
Decomposition).

==> High-precision
relative and absolute
locations.

Horizontal uncertainty
averages ± 2.8 km.

Vertical uncertainty
averages ± 3-4 km.
Relocated
Aftershocks

Events relocated using
both local/regional, and
teleseismic phases
(linkage provides
higher accuracy for
offshore events).

Uncertainties
demonstrate dominant
SW-NE/W-E orientation
- i.e., bias in direction of
network.
Relocated
Aftershocks

Events relocated using
both local/regional, and
teleseismic phases
(linkage provides
higher accuracy for
offshore events).

Uncertainties
demonstrate dominant
SW-NE/W-E orientation
- i.e., bias in direction of
network.
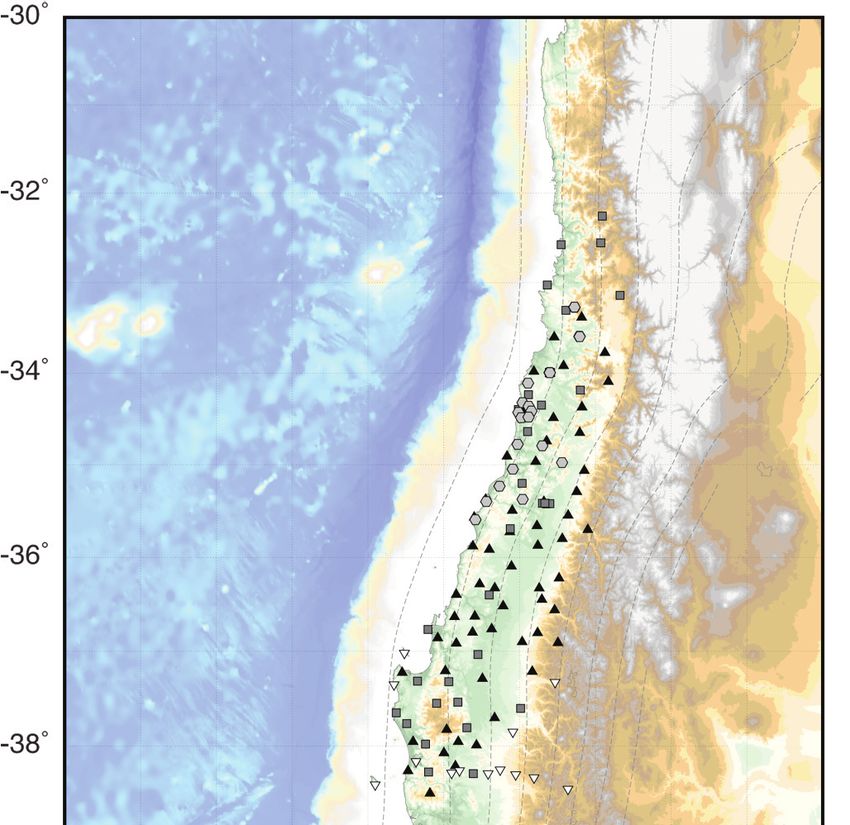
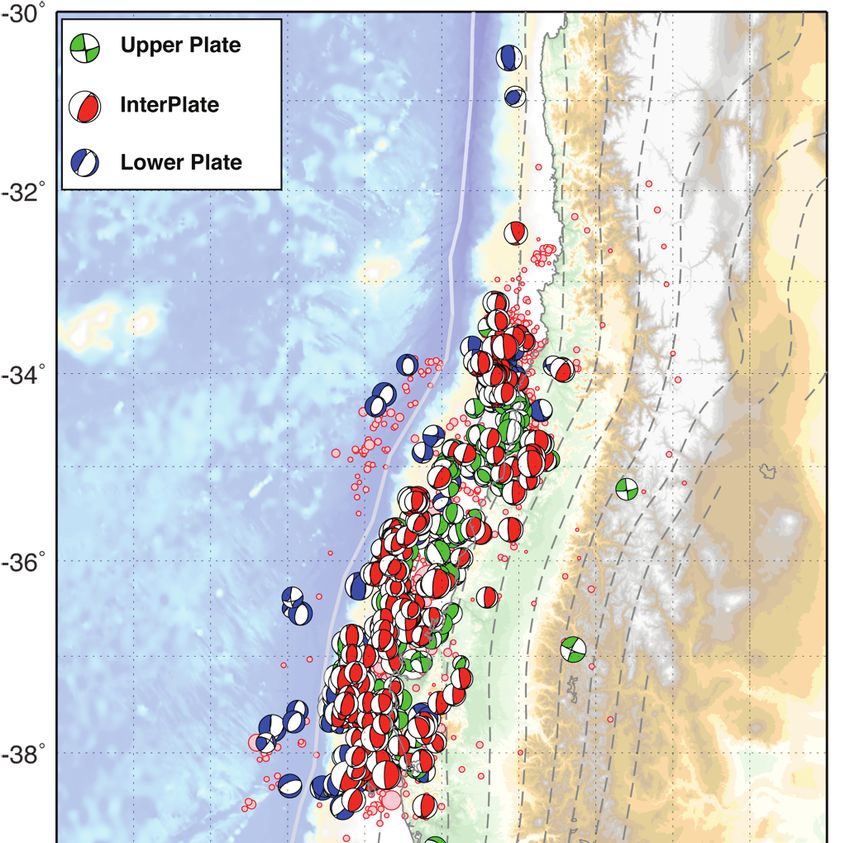
Maule RMTs

We have also used the
PA Hydra system to
produce regional
moment tensors
(RMT) for these
earthquakes.

==> RMT catalog of 450
earthquakes, M3.5 and
above.

Using these
mechanisms and our
slab models for the
region, we can begin to
analyze the tectonics
of the sequence,
dividing the catalog
into upper, lower and
interplate EQs.
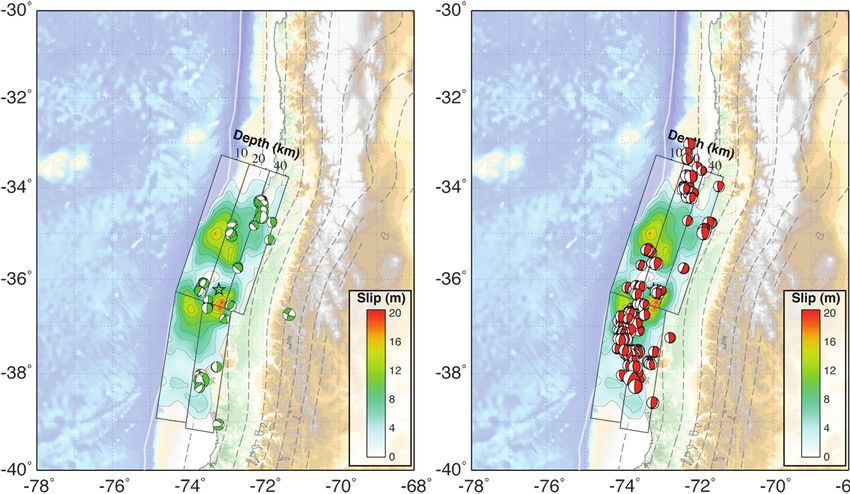
Maule RMTs

 Maule moment tensors predominantly thrust, with some
 distributed normal and oblique faulting events.
Maule RMTs: Well-Constrained
       Upper Plate                Inter Plate             Lower Plate

Majority of aftershocks interplate (~55-70%, depending on how data are
filtered for tectonic regime).

Large cluster of normal faulting earthquakes in north, near Pichilemu
(two M6.9-7.0 EQs on 2010/03/11).

Lower plate faulting on steep reverse structures in the offshore regions
north & south of the mainshock slip.
Maule RMTs: Poorly-Constrained
Upper Plate Inter Plate Lower Plate
Majority of aftershocks interplate (~55-70%, depending on how data are
filtered for tectonic regime).
Large cluster of normal faulting earthquakes in north, near Pichilemu
(two M6.9-7.0 EQs on 2010/03/11).
Lower plate faulting on steep reverse structures in the offshore regions
north & south of the mainshock slip.RMT Goodness of Fit Variations
(a)
1.0 Forward modeling fault plane
solutions in Regional Moment
Tensor inversions allows us to
Relative Fit
0.9
assess how well-constrained
0.8
strike and dip are in RMT
solutions.
0.7
0 10 ‘Good’ solutions span +/- 25
Delta Strike (o) deg in strike, +/- 20 deg in
dip?
(a)
1.0
See Kendra Johnson’s poster
Relative Fit
0.9 at this workshop.
0.8
0.7
0 10
Delta Dip (o)RMT Uncertainty
90 90
Area [-75 - -71], [-38.5 - -36.5] Area [-75 - -71], [-38.5 - -36.5]
Angles represent difference between nodal Angles represent rotation angle from slab
plane dip and slab dip (angular difference between RMT and slab)
0 0 0 0
Unce
rtain
ty
Interplate
10 10
45 45
All Plots
Filtered for Lower plate
Thrust EQs
Only
20 20
90 90
Even when considering RMT uncertainties, thrust faulting solutions
to the south & north of major coseismic slip are still confidently
lower plate events.Maule RMTs: Well-Constrained
Upper Plate Inter Plate Lower Plate
Even given the uncertainties of RMT solutions, these clusters of
aftershocks near the limits of co-seismic slip cannot be interplate.
==> Upper and lower plates respond to co-seismic slip at ends of rupture.Relocated Aftershocks Cross-sections show structure of aftershock sequence with depth. Four dominant regions of activity: 1) Two clusters along interplate thrust (shallow & deep) 2) Upper plate, near Pichilemu 3) Outboard of SZ
Cross-Sections
Cross-Sections
Cross-Sections
Cross-Sections
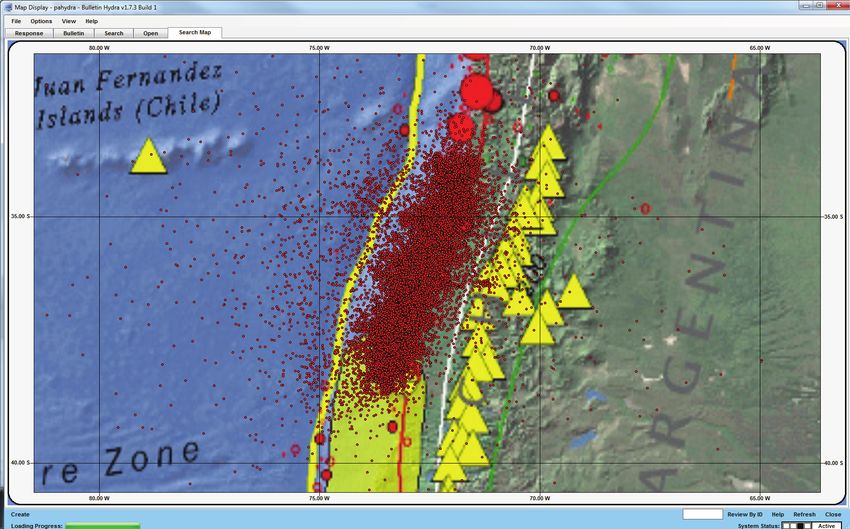
Maule FFM

Single-plane
teleseismic FFM.

Fits seismic data
extremely well
(explains 88% of
waveform data).

Aftershocks
dominantly cluster in
regions of lower or
transitional slip.

Reasonable fits to
horizontal & vertical
GPS data.
Maule FFM

Five-plane
teleseismic FFM.

Better accounts for
down-dip and along-
strike changes in slab
geometry.

Still fits seismic data
extremely well
(explains 90% of
waveform data).

Much better fits to
horizontal & vertical
GPS data.

==> Rapid seismic
FFMs still useful!
Coulomb Stress
Transfer
 ΔCFS calculations -
 comparing favored slip
 model and aftershock
 relocations - very
 sensitive to
 uncertainties in both.

 Preferred locations vs.
 slip model ==> 55%
 aftershock nodal planes
 show +ΔCFS (~5-10%
 gain over background
 seismicity).

 Within AS uncertainties
 (a few km), 90%
 aftershock nodal planes
 show +ΔCFS (~55% gain
 over background).
Summary

 30,000 aftershocks of the Febrary 2010 Maule earthquake (Mw 8.8)
 automatically located with an offline module mimicking NEIC’s
 realtime data processing system.

 2,500 events relocated to derive a high-precision catalog of the largest
 aftershocks (uncertainties < 3 km).

 500 Regional Moment Tensors allow analysis of tectonics of sequence -
 EQs divided into upper, lower, interplate. 55% of RMTs are interplate;
 35% lower plate. Upper plate aftershocks dominant in north, near
 Pichilemu, where two large normal faulting aftershocks occurred on
 03-11-10.

 Coulomb stress transfer calculations demonstrate importance of
 considering uncertainties - in both aftershock locations and slip
 distribution. Small uncertainties of relocated aftershocks in this study
 cause the percentage of events occurring on positively stressed faults
 to increase from 55% (at preferred locations) to 90% (within location
 uncertainties).
Geodetic Data Residuals
Maule GPS
Maule GPS
Megathrust Slip VS Slab1.0
FFMs & Slab1.0 - Slip vs Structure

 Comparisons of fault models with subduction zone geometry show
 coseismic slip was confined to a local minima in the subducting plate.
FFMs & Slab1.0 - Slip vs Structure

 Major northern asterity was
 located on the south side of a
 local high in subduction zone
 topography. Hypocenter and
 southern asperity was within
 the local minima.
Extra Slides
Relocation Vectors
                                        (a)   NORTH

                                                      Rose Digram


                                       WEST                     EAST


                                                        25.00


                                              SOUTH
                                        (b)   NORTH

                                                      Polar Histogram


                                       WEST                     EAST


                                                        25.00


                                              SOUTH
Aftershocks VS Coseismic Slip
(a) Interplate EQs vs Normalized Slip (b) Interplate EQs vs Normalized Slip Gradient
100 100
(i) Single Plane Model (i) Single Plane Model
50 50
0 0
0.0 0.5 1.0 0.0 0.5 1.0
100 100
Number of EQs
Number of EQs
(ii) 3-Plane Model (ii) 3-Plane Model
50 50
0 0
0.0 0.5 1.0 0.0 0.5 1.0
100 100
(iii) 5-Plane Model (iii) 5-Plane Model
50 50
0 0
0.0 0.5 1.0 0.0 0.5 1.0
Normalized Slip Normalized Slip Gradient
Comparisons of aftershock locations and coseismic slip show most
events occur away from peak slip, but also where slip gradients are low.You can also read