Impact of COVID-19 intervention on TB testing in South Africa - 10 May 2020 - NICD
←
→
Page content transcription
If your browser does not render page correctly, please read the page content below
Impact of COVID-19 intervention on TB
        testing in South Africa
              10 May 2020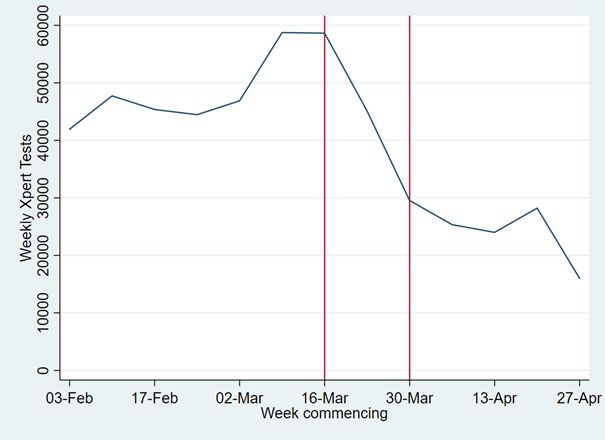
BACKGROUND
South Africa carries a disproportionate burden of The first laboratory case of COVID-19 in South Africa was
tuberculosis (TB) per capita and is listed in all three on confirmed on the 5th of March 2020 and the number
categories of priority countries by the World Health of cases have continued to increase with the total number
Organization (TB, TB/HIV and RR-MDR-TB). The estimated of new infections over 10 000 as of 10 May 2020[4]. The
number of incident TB cases in SA for 2018 was 301 000 concerns of excess mortality and potential impact on
while the estimated number of deaths due to TB in the overwhelming health capacity in a very short time has
same year was 63 000[1]. Significant progress has been led to introduction of various measures to reduce the
made in improving the diagnosis of TB in the country transmission of this disease. Social distancing measures
with universal testing of all individuals with symptoms were announced by the President of South Africa on
suggestive of TB (cough, fever etc.) using Xpert MTB/ Sunday 15th March with restrictions on international
RIF Ultra (Xpert) assay with > 2 million individuals tested travel, school closures (18th March), and mass gatherings.
annually in South Africa[2]. This assay is highly sensitive The national lockdown (level 5 restrictions) commenced
in detecting TB and also tests for rifampicin resistant TB. on Friday, the 27th of March[5]. Level 4 restrictions
The introduction of new and re-purposed drugs to treat commenced on 1 May 2020[6].
drug resistant TB has had significant impact on improving
outcomes and reducing mortality due to drug resistant We analyse the changes in TB testing volumes, number of
TB. Overall the burden of TB and drug resistant TB has cases detected and positivity in relation to the measures
shown positive signs with annual decline in incidence introduced to curb the spread of COVID-19 in South
observed[3]. Africa.
The novel SARS-CoV-2 virus is the causative agent for
Coronavirus disease first diagnosed in 2019 (COVID-19).
METHODS
Data was extracted for the period 3 February 2020 to 3 in the laboratory. Aggregation of the data to a national
May 2020 from the surveillance data warehouse (SDW) level and, by day, and week was undertaken. The analysis
at the National Institute for Communicable Diseases a was primarily descriptive in nature and included a 7
division of the National Health Laboratory Services. The day historical moving average. The positivity rate was
data extracted was restricted to the Xpert MTB/RIF Ultra calculated as the number of positive tests over the total
assay as this is the primary diagnostic tool widely used in number of tests. For this analysis the test data were not
South Africa. This test data included, the tests conducted, de-duplicated. Analysis was conducted using STATA
results of the tests and date when the test were registered version 15.
RESULTS
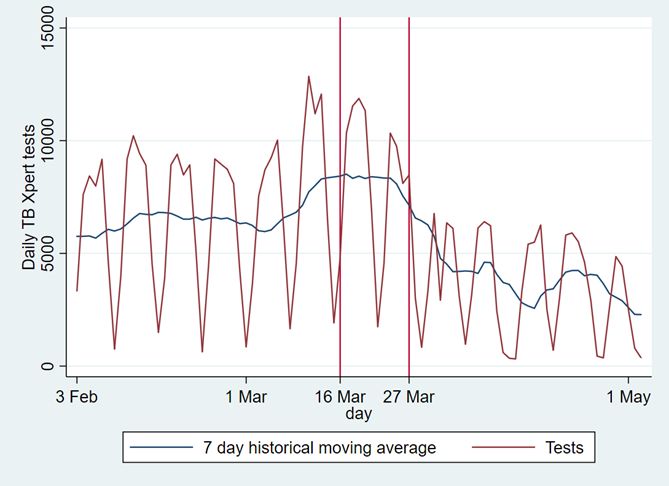
Over the period a total of 511 708 Xpert tests were The daily testing volumes are shown below. The social
conducted and 41 432 were positive for Mycobacterium distancing measures implemented from 16th-27th March
tuberculosis complex. The period covered 6 weeks before resulted in a decline in daily testing volumes compared
the interventions were introduced, and subsequent to the preceding week. Daily testing volumes declined
periods of interventions: social distancing (2 weeks) and sharply after commencement of the national lockdown
lock down (5 weeks). on the 27thof March and have continued to decline.
2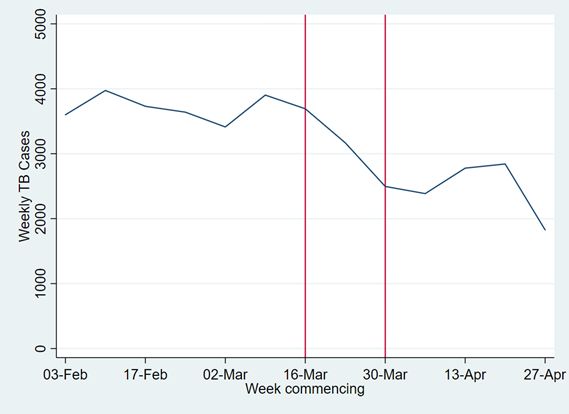
Red line indicates the start of the interventions: 16 March 2020 social distancing and 27 March 2020 lockdown.

              Figure 1. Trends in daily Xpert tests between 3 February 2020 to 3 May 2020, N=511 708.

Weekly testing volumes, positive tests and                            non-intervention weeks and dropped to a low of
positivity rates are provided in the table below.                     1826 during the national lockdown. The average test
Testing volumes declined more rapidly than                            volumes during the non-intervention period was 47
the TB cases detected resulting in an increase in                     520 per week while it was 24 574 during the lockdown
the weekly positivity rate during the lockdown                        period which was a 48% decline. A similar but less
period. The peak of tests in the week during                          dramatic decline was observed for Xpert positive
the non-intervention period was 58 742 and                            tests, the average test positive per week during the
dropped to 15 991 in the last week of this                            non-intervention period was 3710 while it was 2473
analysis in the intervention period. The number                       during the lockdown period which was a 33% decline.
of Xpert positive tests exceeded 3000 in all the

          Table 1. Weekly volumes of Xpert tests, positive tests and positivity stratified by COVID-19 interventions.

   Week commencing            COVID-intervention                      Positive Xpert tests          Total Tests        Positivity Rate
   03-Feb-20                  None                                    3 600                         41 937             8.6%
   10-Feb-20                  None                                    3 974                         47 738             8.3%
   17-Feb-20                  None                                    3 730                         45 366             8.2%
   24-Feb-20                  None                                    3 640                         44 463             8.2%
   02-Mar-20                  None                                    3 412                         46 873             7.3%
   09-Mar-20                  None                                    3 903                         58 742             6.6%
   16-Mar-20                  Social distancing                       3 692                         58 639             6.3%
   23-Mar-20                  Social distancing/Lockdown              3 167                         45 082             7.0%
   30-Mar-20                  Lockdown                                2 482                         29 310             8.5%
   06-Apr-20                  Lockdown                                2 386                         25 345             9.4%
   13-Apr-20                  Lockdown                                2 778                         24 006             11.6%
   20-Apr-20                  Lockdown                                2 842                         28 216             10.1%
   27-Apr-20                  Lockdown                                1 826                         15 991             11.4%

  The data in the table is shown graphically in Figures 2a,b,c.

                                                                     3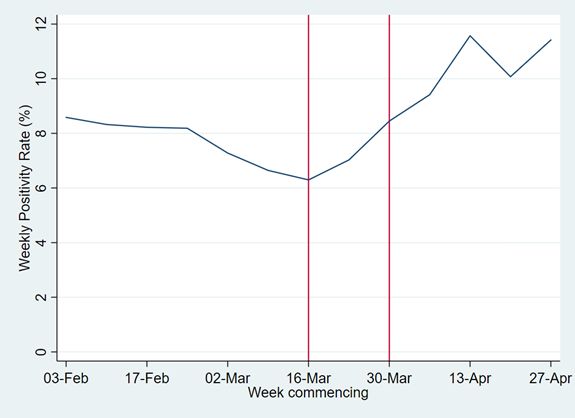
Weekly TB Tests

               Red line indicates the start of the interventions: 16 March 2020 social distancing and 27 March 2020 lockdown.

               Figure 2a. Trends in weekly Xpert tests between 3 February 2020 to 3 May 2020, N=511 708.

Weekly TB Positive Tests

               Red line indicates the start of the interventions: 16 March 2020 social distancing and 27 March 2020 lockdown.

         Figure 2b. Trends in weekly positive Xpert TB tests between 3 February 2020 to 3 May 2020, N=41 432.

                                                                  4
Weekly TB positivity Rate
Red line indicates the start of the interventions: 16 March 2020 social distancing and 27 March 2020 lockdown.
Figure 2c. Trends in weekly Xpert TB positivity rate between 3 February 2020 to 3 May 2020, N=41 432.
Weekly testing volumes are shown below with the social distancing week (16th March 2020) in yellow, the social
distancing-lockdown week of the 23rd in orange and the three lockdown weeks in red.
Figure 3. Weekly testing volumes stratified by social distancing intervention.
5CONCLUSION
The COVID-19 level 5 restrictions has resulted in a ~ 48% severely limited. Individual motivation to seek care is
average weekly decrease in TB Xpert testing volumes another factor in the face of the restrictions and it is
while, the number of TB positive declined by 33%. The possible that only those more with advanced TB would
relative difference resulted in a higher weekly positivity seek care. This may explain the increase in positivity
rate during the lockdown period. These unintended during the lockdown period.
consequences will have a negative impact on efforts to
control TB which remains the leading infectious disease The implications of undiagnosed TB are serious and will
cause of death in South Africa currently[7]. compromise past successes in reducing the burden and
mortality associated with TB and DR-TB. As both TB and
The dramatic declines in tests conducted for TB COVID-19 share similar clinical presentation (cough,
investigations are not explained by reduced testing fever, shortness of breath etc.) and are transmitted
capacity nor health service availability for TB as these through respiratory droplets and aerosols, a combined
were available and operational during the intervention strategy needs to be applied. This would utilise resources
period. The primary factor is restrictions introduced effectively while providing both short term and long
limiting movement and thereby access to services. During term benefits.
the lockdown period availability of public transport was
REFERENCES
1. WHO. Global TB Report. 2019 7 May 2020]; Available from: https://apps.who.int/iris/bitstream/hand
le/10665/329368/9789241565714-eng.pdf?ua=1.
2. NHLS. 2018/2019 NHLS Annual Report. 2019; Available from: https://www.nhls.ac.za/wp-content/uploads/2019/11/NHLS_
Annual_Report_2019.pdf.
3. NICD. Online TB Surveillance Dashboard. 2020; Available from: https://www.nicd.ac.za/diseases-a-z-index/tuberculosis-
general/.
4. NICD. COVID-19: Weekly epidemiology brief, week18, 2020. 2020; Available from: https://www.nicd.ac.za/covid-19-weekly-
epidemiology-brief-week-18-2020/.
5. Dlamini Zuma, N. Disaster Management Act, 2002, ammendment of regulations issued in terms of section 27(2). 2020;
Available from: http://www.cogta.gov.za/cgta_2016/wp-content/uploads/2020/03/Final-lockdown-regulations-1.pdf.
6. COGTA, S.G. South Africa to Move from Level 5 Lockdown to level 4. 2020; Available from: http://www.cogta.gov.za/?p=7968.
7. STATSSA. Mortality and causes of death in South Africa: Findings from death notification, 2017. 2020; Available from: http://
www.statssa.gov.za/publications/P03093/P030932017.pdf.
6Data Source
National Institute for Communicable Diseases, Centre for Tuberculosis
Contact
Prof Nazir Ismail:
naziri@nicd.ac.za
Dr Harry Moultrie:
harrym@nicd.ac.zaYou can also read