Modeling the Impacts of a Tailings Dam Failure at the Pebble Mine - February 28, 2019
←
→
Page content transcription
If your browser does not render page correctly, please read the page content below
Modeling the Impacts of a
Tailings Dam Failure at the Pebble Mine
              February 28, 2019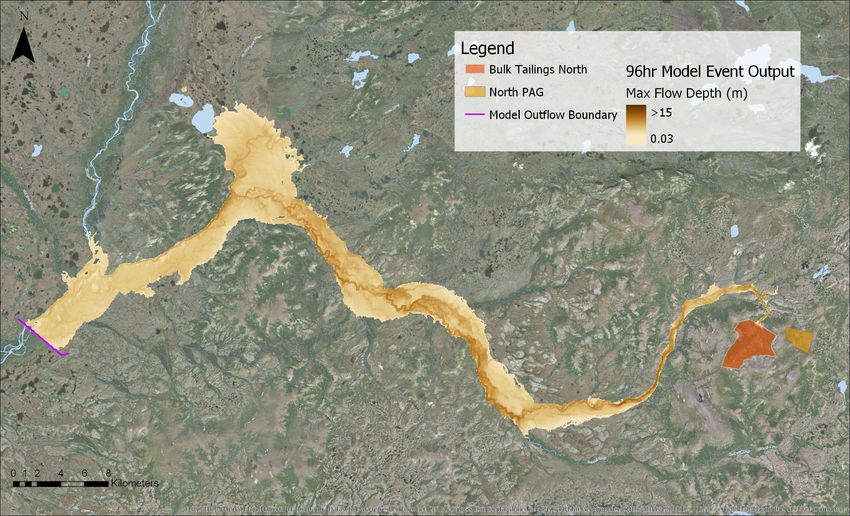
What is a Tailings Dam?

     Highland Valley Copper Mine, Logan Lake, British Columbia, Canada
Image 1: Klohn Crippen Berger: https://ambriefonline.com/tailings-dam-inspection-and-monitoring/
Image 2: Mccosker Contracting Ltd: http://www.mccoskers.com.au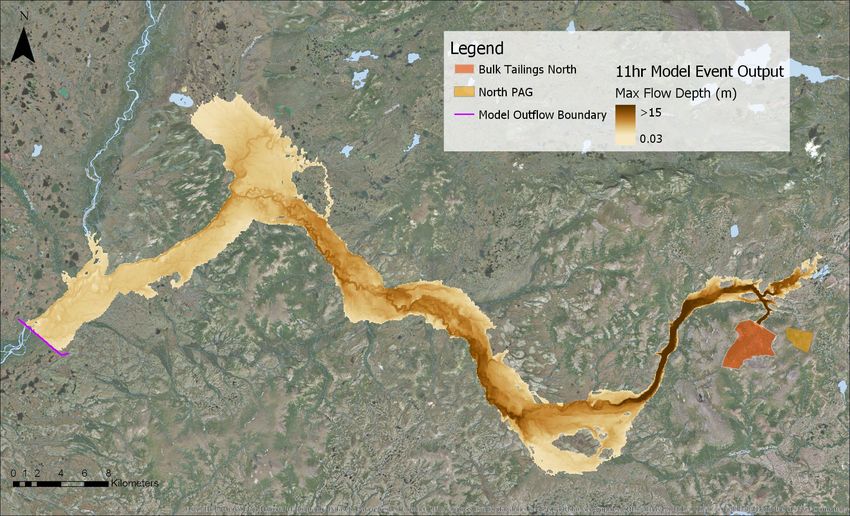
Pebble Tailings Storage Facilities (TSFs)
Recent Tailings Dam Failures

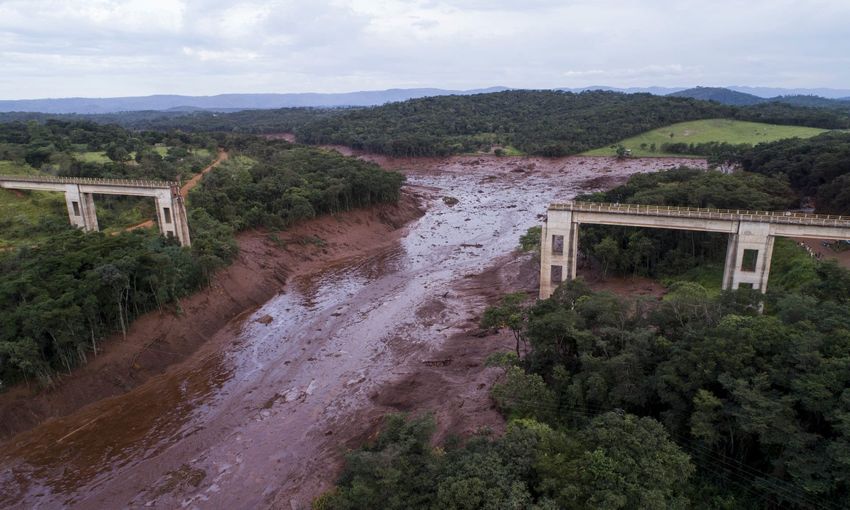
Brumadinho, Brazil, 2019

                                                            Samarco, Brazil, 2015
 http://www.mining.com/tailings-breach-at-imperial-metals-mount-polley-mine-40156/
 https://slate.com/news-and-politics/2015/12/brazil-mining-dam-disaster-toxic-sludge-and-
 irreversible-environmental-damage.html
 https://www.theguardian.com/world/2019/jan/25/brazil-dam-collapse-news-latest-mining-      Mt. Polley, BC 2014 (Knight Piésold design)
 disaster-brumadinho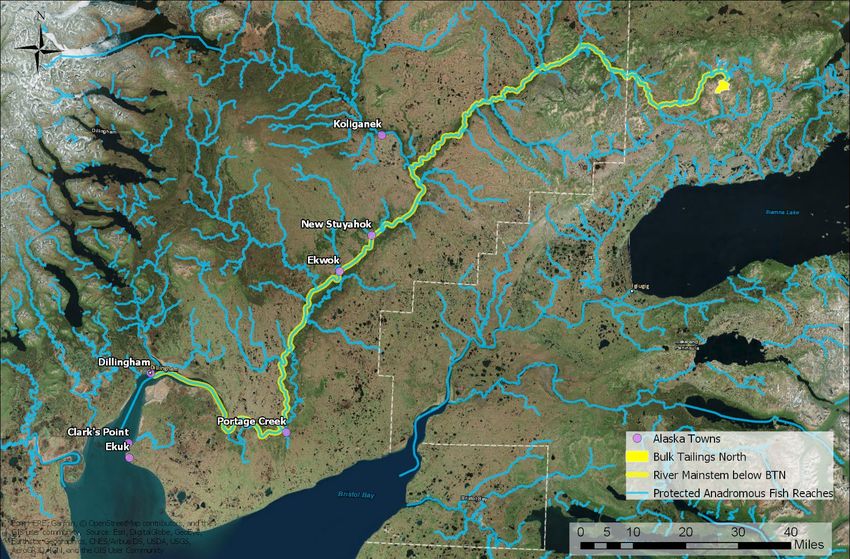
PLP’s Proposed tailings dam uses inferior design

“Dams designed with downstream construction methods are less likely to
fail than dams using centerline construction methods, especially under
seismic shaking (ICOLD 2018).”
“The centerline construction method was selected for the bulk TSF
north embankment to limit the footprint and volume of materials
required for construction”
                                 - Pebble Mine Draft EIS, p. 4.27-73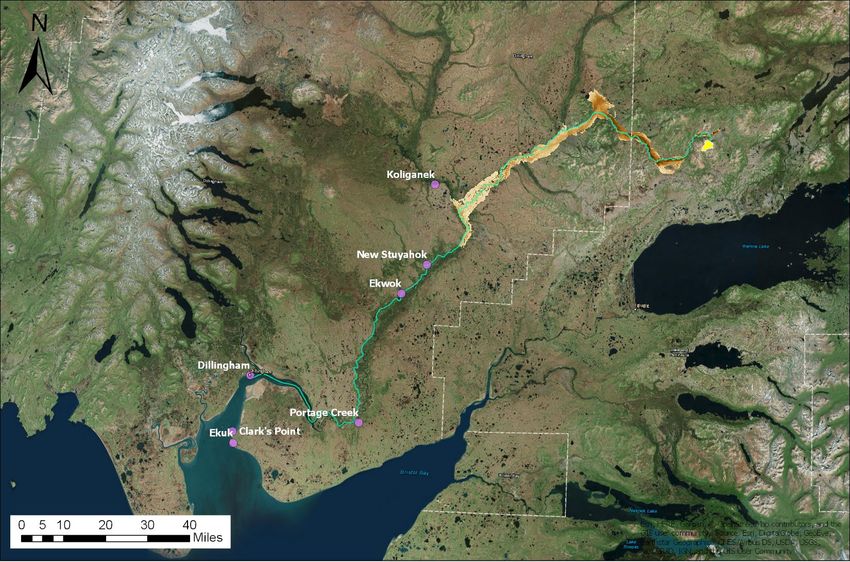
Draft EIS is Misleading about Failure Probability
                                                                            Probability of "1 in 2000" Event vs Duration of
“The probability of a full breach of the                                                        Analysis
bulk or pyritic TSF tailings embankments                              45%

was assessed to be extremely low”                                     40%

                                                                      35%

                    - DEIS p. 4.27-72

                                             Probability of Failure
                                                                      30%

                                                                      25%

“[a full tailings breach was] ruled out as                            20%

remote during the 20-year operational                                 15%

life due to likelihood of successful                                  10%

detection and intervention”                                           5%

                                                                      0%
              - FMEA, October 2018                                            20        50        100        200         500   1000
                                                                                             Duration of Analysis (yr)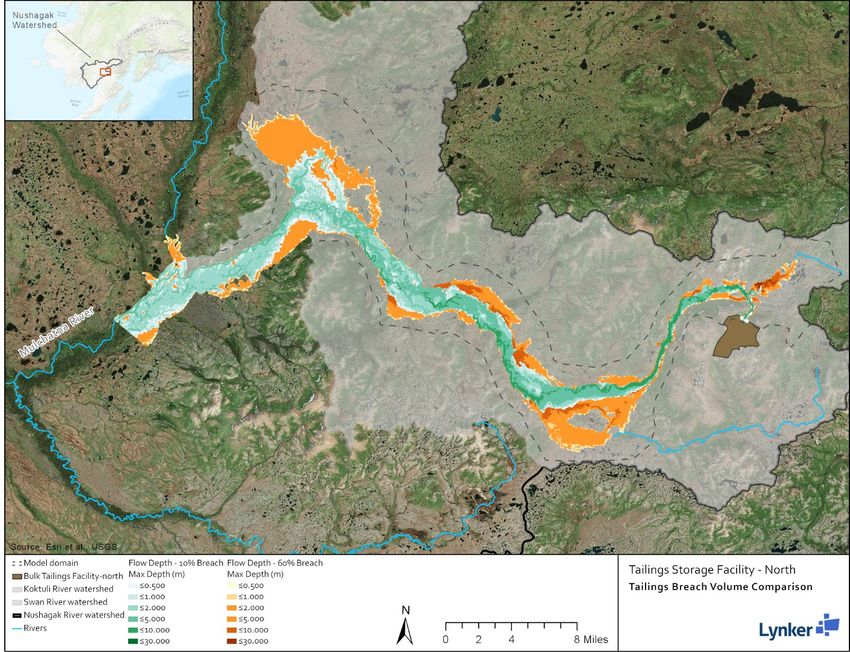
Draft EIS Did NOT consider a TSF failure
                                      Breach Volume Released vs Tailings Storage Facility Capacity
                         1.00E+09

                                                                                                                                Pebble TSF North
                         1.00E+08                                                                                                  3.42E+08
                                                                                                             Samarco
   Volume Release (m3)

                                                                                                             5.50E+07

                         1.00E+07

                                                                                                                           Mt Polley                            ~10,000x
                                                                                                                           2.36E+07
                         1.00E+06
                                            Rico (2008) Equation

                         1.00E+05                 y = 0.354x1.008
                                                                                                                                   EIS Bulk Tailings
                                                                                                                                  "Pipeline Rupture"
                         1.00E+04
                               1.00E+04                1.00E+05               1.00E+06                1.00E+07                  1.00E+08                 1.00E+09
                                                                                   Volume Capacity (m3)
                               Obs Breach Event          PLP BTN Rico Est Breach         EIS Bulk Tailings "Pipeline Rupture"          Power (Vf Rico (2008))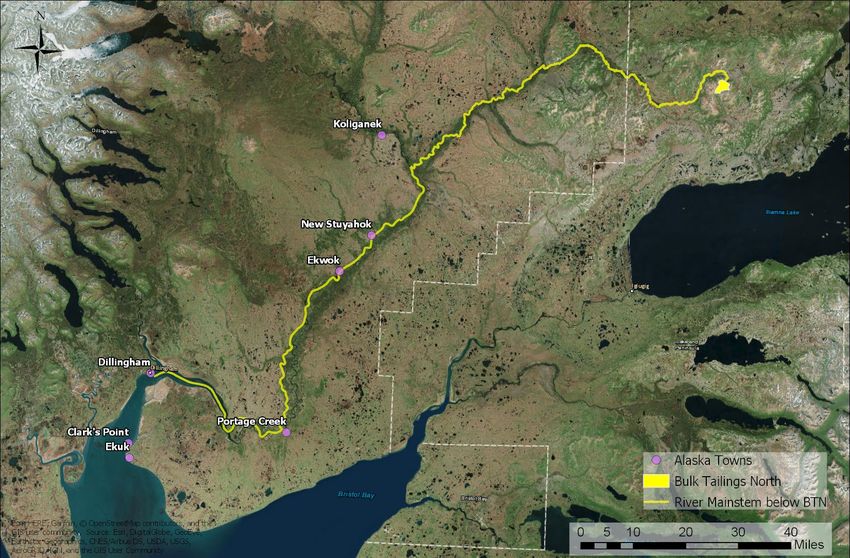
Our Goals and Approach
• Simulate the spatial extent of impacts in the event of a tailings dam failure at
  the Pebble Mine
• Develop scenarios based on historical TSF failures
• Use modeling framework consistent with prior industry practice (e.g., Knight
  Piesold, 2014; TetraTech, 2015)
• Explore sensitivity of outcomes to different physical and model parameters
   •   Tailings sediment concentration
   •   Tailings rheology (flow properties)
   •   Duration of breach
   •   Digital topographic dataset
   •   Channel and valley “roughness”
• Examine results in the context of impacts to salmon habitat
Study Area – Regional View

                                     Lliamna
                                           Lake
                                       Lake
                                        Iliamna

                   208 River Miles

         Bristol
          Bay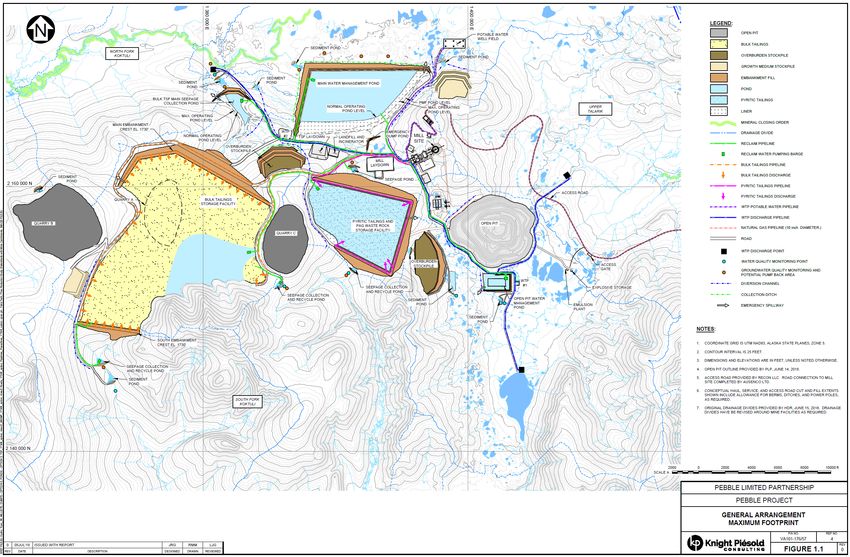
Model Domain – Tailings runout

~125 miles to
 Dillingham
Breach Scenario Simulations
Model runs explored a range of breach scenarios:
• Tailings volume released
• Rico et al. (2008) 41% release
• Low estimate 10% release
• High estimate 60% release
• Duration of breach event
• Varied from 6hr to 96hr Testing Breach
• Influences peak discharge rate Duration
• Max sediment concentration
• Varied from 35%-50%
• Influences flow propertiesResult: 24-hour Breach, 50 hr simulation
Sensitivity: Total volume released
Breach Volume Comparison

10% breach volume (green)
   • Inundated Area: 60.9 mi2
60% breach volume (orange)
   • Inundated Area: 110.3 mi2
Sensitivity: Duration of Breach
     11-hour breach inflow        24-hour breach inflow
Sensitivity – Duration of Breach (11 hr)
Sensitivity – Duration of Breach (96 hr)
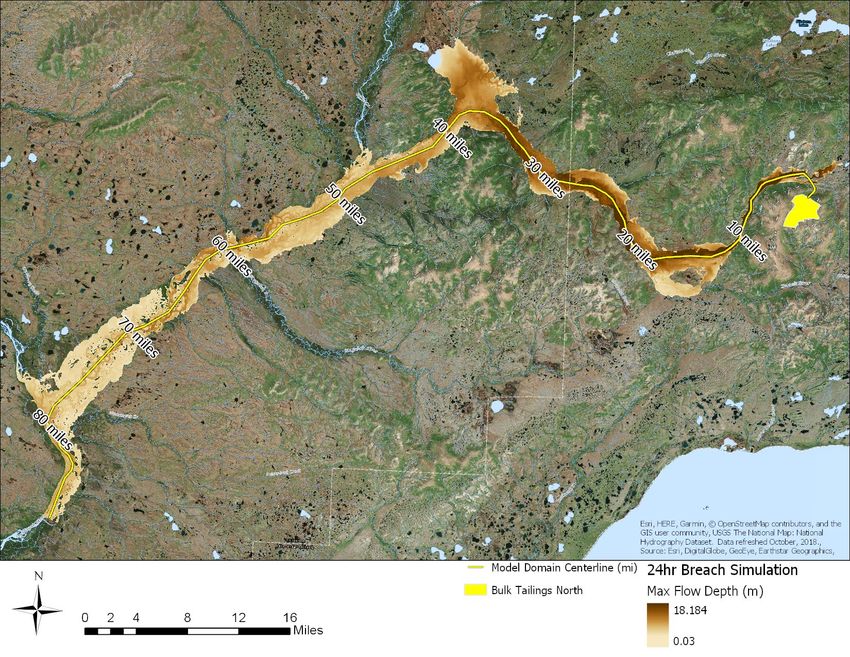
24-hour Breach: Larger Model Domain

                                            Lliamna
                                  Edge of     Lake
                                  Model
                                  Domain

                       208 River Miles

             Bristol
              Bay
Larger Model Domain: 24-hour Breach Model extends from TSF to Nushagak-Mulchatna Confluence • ~45% of tailings are deposited within the model floodplain • ~55% of tailings flow past the model boundary
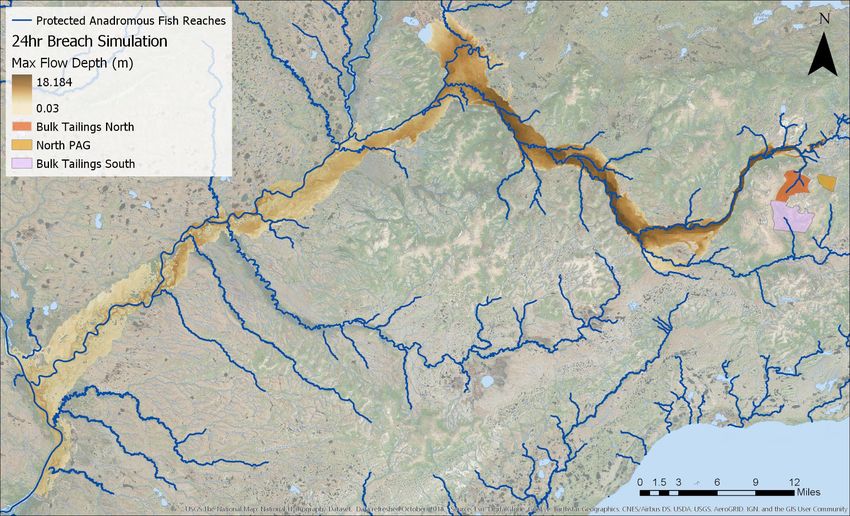
Anadromous Waters Affected – 24 Hour Event

                   Nushagak

• Tailings would directly
  impact >219 miles of
  anadromous waters
Potential impacts to the fishery • Deposition of fine-grained tailings in spawning habitat could decrease emergence success (e.g., Chapman, 1988; Kondolf, 2000) • Leaching of metals from tailings could create acute or chronic toxicity to salmonids Chapman, D. W. (1988). Critical review of variables used to define effects of fines in redds of large salmonids. Transactions of the American Fisheries Society, 117(1), 1-21. https://www.salmonography.com/Salmonid-Topic/Covering-the-redd/ Kondolf, G. M. (2000). Assessing salmonid spawning gravel quality. Transactions of the American fisheries Society, 129(1), 262-281.
Long-term impacts
“Unrecovered tailings that are exposed to oxygen could generate
acid on a timescale of years to decades…acid and heavy metals that
accumulate in streambed sediments, wetland soils, or isolated
waterbodies could impact water quality on a timescale of decades.”
                                      - Pebble DEIS, page 4.27-65

“Recovery of a massive release, especially one that reaches flowing
water, would be extremely difficult.”
                                      - Pebble DEIS, page 4.27-65
“The only common factor in all major TSF failures has been human
error, including errors in design, construction, operations,
maintenance, and regulatory oversight.”
- Pebble DEIS, p. 4.27-71Questions
Cameron Wobus, PhD: cwobus@lynkertech.com
Ryan Spies, MS: rspeis@lynkertech.com
Bill Szafranski, MS: bszafranski@lynkertech.comModel Domain – Mine Layout
Our Project Goals

• Simulate the spatial extent of impacts in the event of a tailings dam
  failure at the Pebble Mine
• Overlay this distribution with information on essential fish habitat
• Rely to the maximum extent possible on physical information from
  PLP and from analysis of previous failures

   “If tailings come out, it will kill fish for about 20 miles down the north fork
   of the Koktuli. And that's it. And in 10 years, they'll come back naturally.”
                                                   - Tom Collier, Pebble CEO, 2018
Tailings Release Volumes
You can also read


